DOI: 10.31038/CST.2018115
Abstract
Purpose: Transitioning away from fixed beam toward VMAT approach for multi-target SRS, we developed a standardized algorithmic approach for treatment planning, and a script-based evaluation application characterizing high, intermediate and low dose regions proximal to targets and throughout the brain. The evaluation script was used to compare metrics for clinically treated fixed- and VMAT-based plans to quantify benchmark norms.
Methods and Materials: Plans were examined for 79 patients (37 Fixed/47 VMAT) treating 179 (120 fixed/59 VMAT) targets. Dual purpose structures used for optimization and evaluation include 5 mm thick shells around the PTV (HDRing) and around the HDRing (MDRing) to control/measure dose fall off around the targets, and Brain – (PTV + 5 mm) to quantify for low dose regions. Effective gradients (GrEff) were calculated using V100% [cc] and V50% [cc] in HDRing and MDRings. Volume dependence of metric value distributions were characterized with quantile regression.
Results: Conformity index (CI) decreased rapidly toward unity with increasing volume, plateauing near 0. 5 cc. Conformity index was significantly improved for VMAT plans (1. 19 ± 0. 17 vs 1. 40 ± 0. 46, p<0. 001) whereas effective gradients (%/cm) were reduced (117. 55 ± 17. 26 vs 137. 62 ± 26. 50, p<0. 001). Gradients decreased with increasing target volume (TV) converging near 4 cc for fixed field plans. Quantiles for volumes outside the PTVs receiving 12 Gy or more were smaller for VMAT than fixed beams, increasing as smaller powers of volume (e. g. 0. 45 vs 0. 51). Doses 5-10 mm from targets were similar. Volume of Brain – (PTV+05) receiving at least 5 Gy depended on cumulative PTV volumes and were less for fixed vs VMAT beams. Automation of metric collection improved evaluation of newly generated treatment plans and expedited the transition to multi-target VMAT-based SRS.
Conclusions: Development of standardized algorithmic approach to optimization plus script based metrics calculation improved the SRS planning process and evaluation.
Introduction
The process of transitioning from single target to volumetric modulated arc therapy (VMAT)-based multi-target SRS is underway in many clinics. Conformity and gradient metrics of VMAT-based approaches have been demonstrated by several authors to match or exceed those achieved with other technologies [1-6]. In addition, these VMAT-based approaches reduce treatment time and improve clinical flow by utilizing the same planning and delivery technologies used for other treatments.
In making a transition for treatment planning we focused on two main themes. First, the ability to quantify achieved versus expected values for dosimetric measures in the context of historical experience is an important touchstone. We know that plans will vary in high, intermediate and low dose regions of the distributions, dependent on a range of parameters (e. g. technology used, planner experience, etc. ). Placing those quantified differences in the context of historical norms enables better informed judgements on treatment options. Second, in busy clinics, as the volume of multi-target SRS treatments increases, the number of planners involved may also increase. Standardized, algorithmic approaches for planning and evaluation are valuable for ensuring consistent, objectively demonstrable plan quality and efficiency.
For standardized comparison metrics to be clinically useful, they must be calculable with reasonable effort as part of routine practice so that statistics can be consistently reported and recorded for all treated patients and analyzed. We developed an approach combining a standardized contouring and structure nomenclature, with a script calculating a set of standardized metrics. For VMAT plans, an algorithmic approach to optimization was implemented. The approach was designed to be extensible to implementation with write-enabled scripting that enables programmatic creation of plans, structures and optimization, when that functionality becomes available in clinical systems. With that ability, these algorithmic approaches can be implemented as software applications to enable automation as part of planning processes to improve efficiency and plan quality.
Our objective here is to report on results from the application of this approach, demonstrating the ability of the metrics to provide quantified, clinically comprehensible comparisons of treatment planning approaches. Detailed values and regression parameters characterizing distribution of metrics values quantifying high, intermediate and low dose regions are reported. In particular, we focus on differences between the application of a standardized, algorithmic VMAT planning approach and a more conventional fixed beam approach using static MLCs.
Methods
The approach was applied for patients treated as we transitioned from the use of fixed static beams to VMAT arcs for stereotactic treatment of single and multiple brain lesions. Over this period, both VMAT and fixed beam approaches were used with volume based prescribed doses. All patients were treated on a Varian Edge accelerator outfitted with a high definition multi-leaf collimator (HDMLC). All planning was carried out with the Eclipse (Varian Medical Systems) planning system version 13. 6. Plans were calculated using 1 mm resolution.
Standardized Contouring
The standardized approach to target naming and contouring was defined (Figure 1). Gross tumor volumes (GTVs) and planning target volumes (PTVs) were numbered sequentially, with numbering continuing if patients return for future treatments (e. g. PTV01, PTV02…PTV12). PTV margins are typically 1 mm. Other organs at risk (OARs) are included as necessary with our standardized nomenclature. As described in Table 1, seven structure classes were contoured for use in optimization and evaluation.
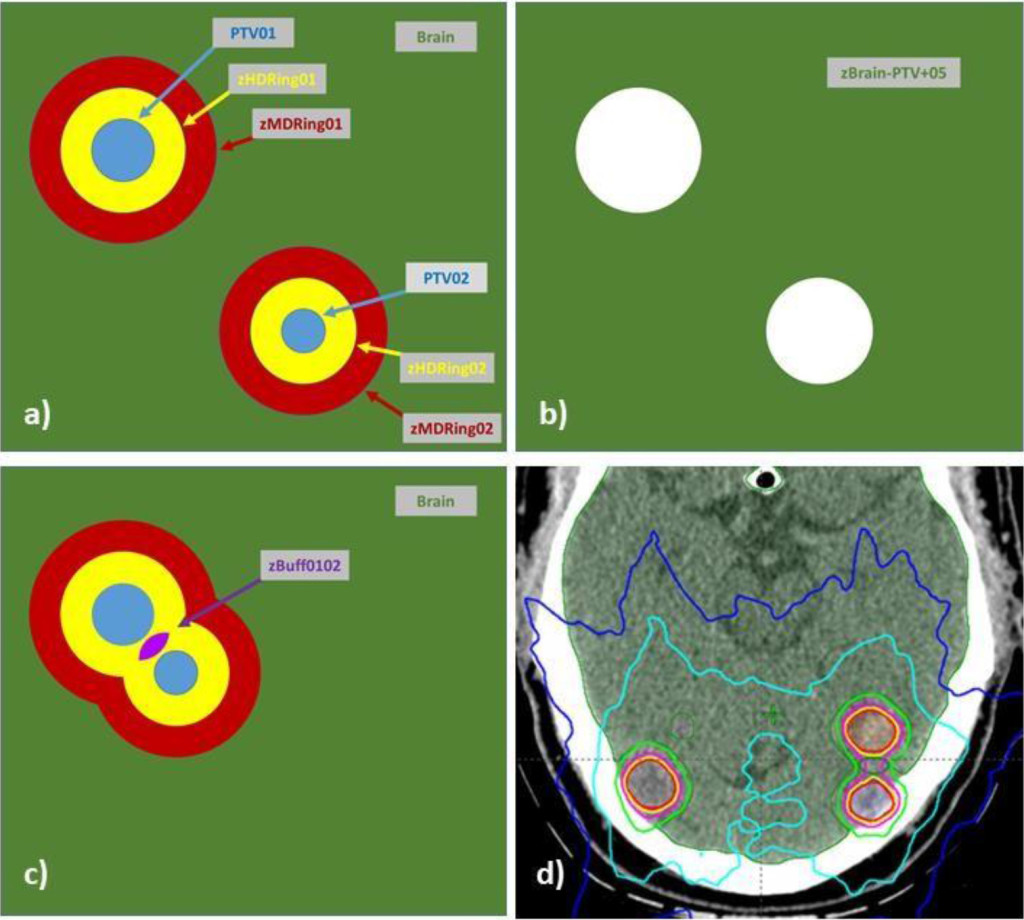
Figure 1. Structures utilized in algorithmic VMAT plan optimization and in treatment plan evaluation with a custom Eclipse API based script are illustrated: (a) PTVaa, HDRingxx, MDRingxx, (b) zBrain-PTV+05, (c) zBuffxxyy, (d) a dose distribution produced with the method.
Low dose spillage in the brain was measured using the brain structure with PTV targets and 0. 5 mm region around each PTV subtracted i. e. Brain – (PTV + 5 mm). To accommodate character restrictions in the planning system this structure was labeled zBrain-PTV+05.
Table 1. Structure classes were contoured for use in optimization and evaluation
|
Structure |
Purpose |
Construction comments |
|
GTVxx |
Gross tumor volume delineation |
Number targets with two digits. For subsequent treatments continue numbering in sequence. |
|
PTVxx |
Planning target volume delineation |
PTV numbers are matched to corresponding GTV |
|
zHDRingxx |
Used to optimize/measure intermediated dose region proximal to PTVs |
Ring 0-5 mm from PTVxx, crop all PTVxx’s out |
|
zMDRingxx |
Used to measure low dose region proximal to PTVs |
Ring 5-10 mm from PTVxx, crop all PTVxx’s out |
|
zBufxxyy |
Used to control fall off between close (< 1 cm) targets |
When two or more zHDRings overlap (e. g. zHDRingxx, zHDRingyy) create as Boolean AND of zHDRings. Crop PTVs out by by 0. 1 cm. |
|
zBrain-PTV+05 |
Used to monitor dose to normal brain |
Brain minus PTVs with 5 mm margin i. e. Brain-(PTV+ 5mm) |
Beam selection and optimization
Isocenter is placed by inspection of PTVs and OARs to a) minimize the distance to targets and b) minimize the potential of angular variations to negatively impact critical organs at risk, e. g. brainstem, optic nerves, optic chiasm. Thus, if one target abuts the brainstem, the isocenter placement is biased to be close to the brainstem.
A separate isocenter and plan was used for each PTV for fixed beam planning. For VMAT plans, a single isocenter was typically used to treat all PTVs. However, two isocenters/plans were used if separation and clustering of targets revealed improved ability to reduce low dose MLC transmission to normal brain with smaller collimator openings.
For VMAT planning, non-coplanar arcs corresponding to at least two minimally overlapping arc trajectories were used. Beams eye views (BEVs) were used to select table/gantry angle combinations minimizing transmission to organs at risk. BEVs were used to select optimal collimator rotations and groups with two principal goals: 1) minimize low dose contribution of leaf transmission and 2) optimize the ability of leaves to conformally minimize dose to OARs including normal brain. For example, if targets were clustered in both the left and right hemispheres of the brain with a large (> 3cm) separation, then two sagittal arcs could be used with collimator groups treating the left and right clusters separately. Collimator angles for each group would be selected to maximize the ability of leaves to block regions between the targets over the range of the arc. We note that other authors have shown that single isocenters are adequate in these circumstances [2, 6]
A standardized set of optimization constraints, listed in Table 2, were entered as the starting point for all optimizations. During optimization, constraint values were adjusted from start values to achieve the desired coverage. The Progressive Resolution Optimizer (PRO) (Varian Medical Systems) was used for all optimizations.
Table 2. Standardized optimization objectives and methods for using the standardized structures.
|
Structure |
Type |
Volume [%] |
Dose |
Priority |
Comment |
|
PTVxx |
Lower |
100 |
Rx[Gy] |
120 |
|
|
|
Upper |
0 |
Rx[Gy] + 25% |
50 |
– |
|
GTVxx |
Lower |
50 |
Rx[Gy] + 8% |
50 |
Push dose higher if needed to reduce horns in dose profile |
|
HDRingxx |
Upper |
2 |
Rx[Gy] |
80 |
|
|
|
Upper |
70 |
0.5 * Rx[Gy] |
100 |
Push Volume[%] to < 70% as optimization allows |
|
zBrain-PTV+05 |
Upper |
0 |
0.5*Rx[Gy] |
120 |
– |
|
|
Upper |
3 |
0.25*Rx[Gy] |
50 |
Push dose to < 0.25*Rx[Gy] as optimization allows |
|
zBufxxyy |
Upper |
20 |
0.9* Rx[Gy] |
50 |
Push volume[%] to < 20% as optimization allows |
|
Orbit_L Orbit_R |
Upper |
0% |
5 Gy |
50 |
Push dose as lower, as optimization allows, to minimize dose |
Scripted DVH Metrics Calculation and Recording
A script was written using C#. Net (version 15) and the Eclipse Application Programming Interface (ESAPI, version 13. 6) that is run from within the plan evaluation session to calculate a set of standardized DVH metrics using the standardized contours/nomenclature outlined in Table 1.
The script allows entry of the prescribed doses for each target. It operates on single plans and on plan sums. When multiple plans are used in a single course of treatment (e. g. two SRS isocenters/plans and one multi-fraction SBRT plan) the script is run on the plan sum so that the metrics reflect the composite dose.
Metrics collected included a series of those describing the PTVs (volume[cc] and RxDose[Gy]), dose achieved in each PTV (V100%[cc], Min[Gy], and Max[Gy]) as well as dose falloff around each PTV (V100%[cc], V50%[cc], V12Gy[cc], DC5%[Gy], and D5%[Gy] for both the HDRingxx and MDRingxx structures). Conformity index and effective gradient were also calculated as described below. Here we have used the standardized DVH nomenclature defined by AAPM Task Group 263.
The ICRU conformity index (CI) was calculated for each PTVxx using the zHDRingxx to restrict DVH measures to the region within 5 mm of each target. These are written as

The PTVxx, zHDRingxx and zMDRingxx structures were also used to calculate the effective gradient index, GrEff, described by Mayo et al [1]. With these structures GrEff constructs a volume- based average of the dose fall off within 10 mm of the PTV in units of %/cm.

Where
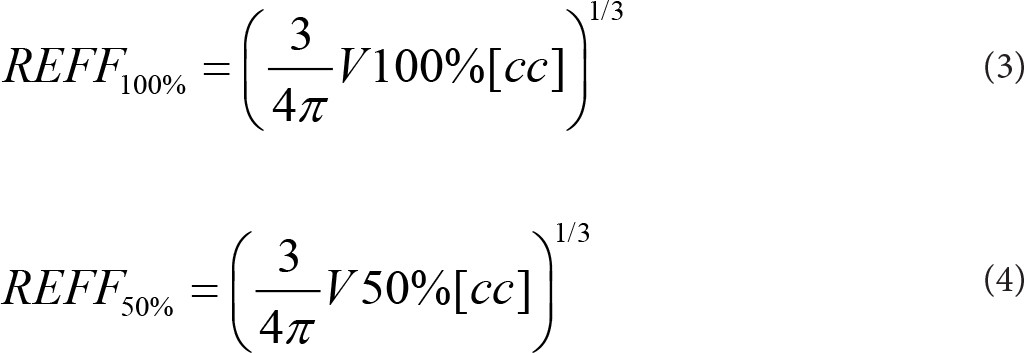
Ratios of prescribed dose to doses covering the hottest (D5% [cc]) and coldest (DC5% [cc]) five percent of the zHDRingxx and zMDRingxx structures were calculated to characterize dose falloff in intermediate and low dose regions.
Low dose spillage to brain tissue not adjacent to the PTVxx’s (i. e. outside the HRingxx’s) was characterized using the zBrain-PTV+05 structure by measuring: Volume [cc], V12Gy[cc], V10Gy[cc] and V5Gy[cc]. Delivering 12 Gy in 1 fraction has the same BED as 30Gy in 10 fractions assuming an α/β equal to 3. V12Gy [cc] has been used by several authors as a metric for gauging intermediate dose spread.
Significance of differences in means for distributions were assessed with the Student’s t test, p < 0. 05. Volume dependence of metrics was checked with Kendall’s tau (kt) correlations with a threshold, |kt|>0. 05. Quantile regression was carried out for volume dependent metrics evaluating median (50% quantile) and 50% confidence intervals (25% and 75% quantiles). Low dose spillage metrics in zBrain- PTV+05 were characterized with respect to cumulative target volumes. Target coverage metrics computed with PTVxx and HDRingxx structures were fit with respect to individual target volumes. All computations were carried out in R (3. 3. 6). Fit functional forms were selected empirically.
Results
A total of 79 patients with 179 SRS targets (120-VMAT and 59-fixed) were included in this study. Patients were treated between January and July of 2017. In this cohort there were 37 VMAT and 47 fixed plans. Fixed beam plans were typically used for patients with smaller numbers of targets. Average numbers of targets per plan were 3. 2 and 1. 2 for VMAT and fixed beam plans, respectively. There were no significant differences between the target volumes in the two sets of patients (2. 49 ± 4. 03 cc for VMAT and 3. 06 ± 3. 89 for fixed).
Conformity indices were regressed with the functional form

Regressions are illustrated in Figure 2 a and b. Coefficient values (CI0, a, b) were (1. 03, 0. 052, 0. 68), (1. 07, 0. 053, 0. 88) and (1. 06, 0. 13, 0. 60) for 25%, 50%, 70% quantiles of VMAT beams, respectively. For fixed beams coefficients for the same respective quantiles were (1. 19, 0. 0008, 3. 6), (1. 21, 0. 046, 1. 81) and (1. 32, 0. 11, 1. 4). At 1 cc, median and 50% CI were 1. 12 (1. 09-1. 17) and 1. 25 (1. 19-1. 43) for VMAT and Fixed beams, respectively. At 10 cc values were 1. 07 (1. 04-1. 09) and 1. 21 (1. 19-1. 32) for VMAT and Fixed beams. VMAT was significantly (p< 0. 001) more conformal than fixed beams.
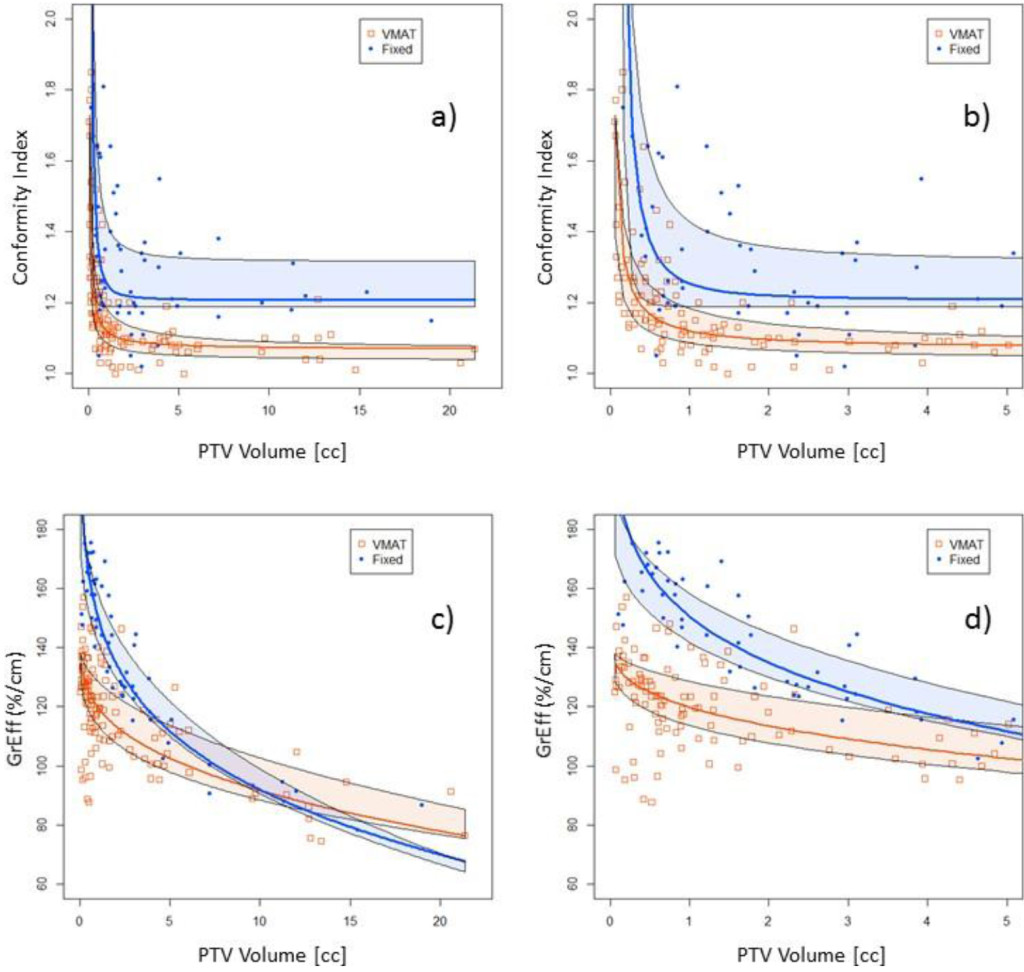
Figure 2. Conformity index for all target volumes (a). The same data are shown in part (b) with the x-axis zoomed in for clarity. GrEff for all target volumes (c). The same data are shown in part (d) with the x-axis zoomed in for clarity. Quantile regressions enable prediction of expectation values based on history and PTV volumes.
Effective gradients were regressed with the function

Regressions are illustrated in Figures 2 c and d. Coefficient values (GrEff0, a, b) were (139, 27, 0. 30), (143, 23. 6, 0. 34) and (140, 12. 1, 0. 50) for 25%, 50%, 70% quantiles of VMAT beams respectively. For fixed beams coefficients for the same respective quantiles were (192, 50. 6, 0. 30), (294, 143, 0. 15) and (210, 52. 4, 0. 33). At 1 cc, median and 50% CI were 119 (114-129) and 150 (142 – 158) %/cm for VMAT and Fixed beams. At 10 cc values were 91. 7 (88. 4-103) and 92 (90. 6-99. 0) %/cm for VMAT and fixed beams. Fixed beams demonstrated steeper dose gradients than VMAT beams for PTV target volumes < 10 cc.
Fall off of dose adjacent to the target volumes were examined with the HDRingxx and MDRingxx structures. In the HDRingxxs, V12Gy[cc] was regressed with respect to PTV volume using

Regressions are illustrated in Figure 3. Coefficients (a, b) for VMAT beams were (2. 37, 0. 411), (2. 84, 0. 456), (3. 14, 0. 484) for 25%, 50% and 75% quantiles, respectively. For fixed beams coefficients were (1. 92, 0. 537), (2. 81, 0. 507), (3. 23, 0. 563). Median and 50% CI at 1 cc were 2. 8 92. 4-3. 1) cc and 2. 8 (1. 9-3. 2) cc for VMAT and fixed beams, respectively. Respective values at 10 cc were 8. 1 (6. 8-9. 0) cc and 9. 0 (6. 2-10. 4) cc. Volumes outside the PTVs receiving 12 Gy or more were smaller for VMAT than fixed beams.
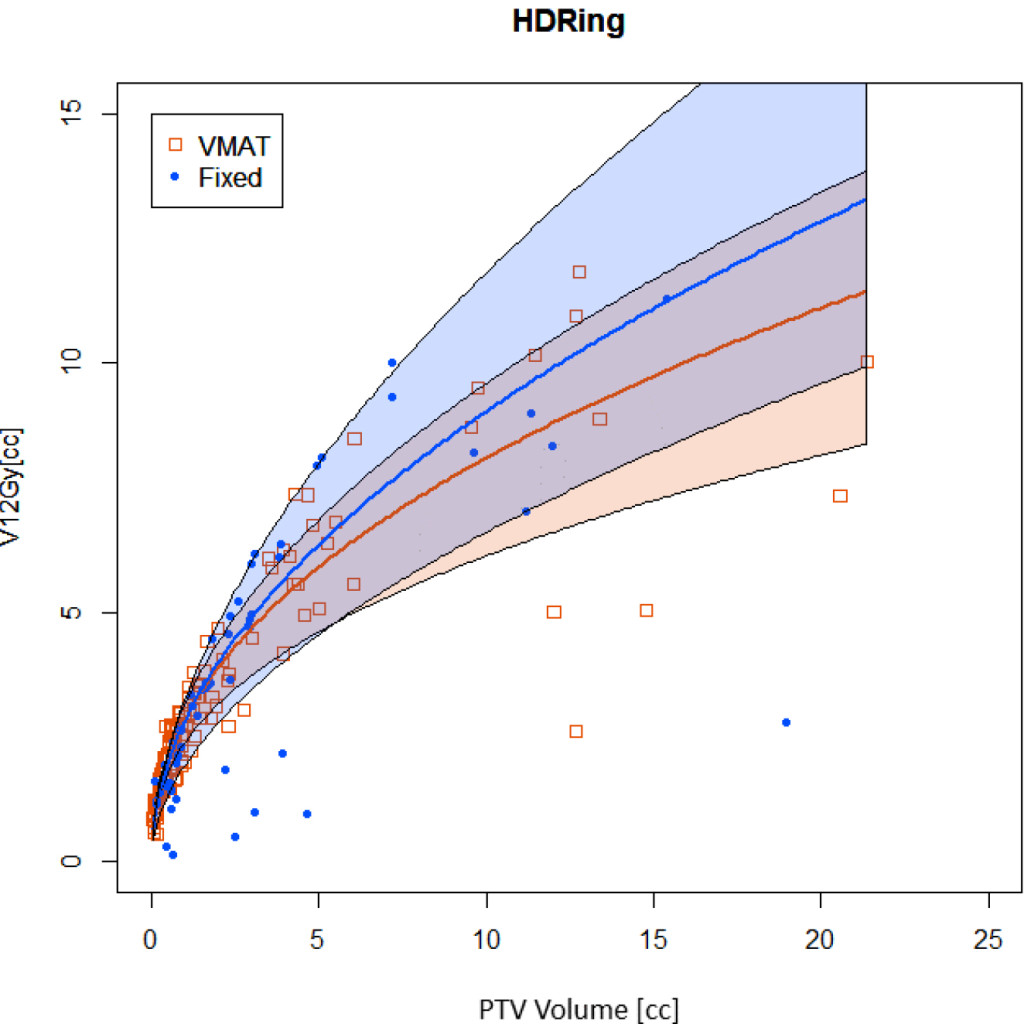
Figure 3. Volume receiving 12Gy or more in the HDRingxx structures surrounding PTV structures. Quantile regressions enable prediction of expectation values based on history and PTV volumes.
The dose falloff ratio (DFR) in the HD and MD rings was measured as the ratio of the difference in dose encompassing the “hottest” and “coldest” 5% of the ring structure to the prescribed dose. Steeper gradients imply larger DFR values.

The high dose (HD) in the HD and MD rings was measured as the ratio of dose encompassing the “hottest” 5% of the ring to the prescribed dose. Higher values of RHD are less desirable than lower.

Distributions of DRF and RHD are illustrated in Figure 4. In the HDRingxx structures, DFR was less variable for VMAT than fixed beams, but smaller consistent with the higher GrEff values.
RHD was smaller for VMAT than fixed beams consistent with VMAT being more conformal. In the MDRingxx structures, DRF and HD distributions were similar.
Distributions of low dose spread in the brain proximal to the targets (zBrain-PTV+05) showed significant (p<0. 001) difference for V5Gy [cc], V10Gy [cc] but not for V12Gy [cc] (p = 0. 13). Median and 50% CI for VMAT and fixed beams respectively were 62 (35. 4-131) cc and 11. 60 (4. 75-21. 1) cc for V5Gy [cc], 1. 0 (0. 4-3. 1) and 0. 2 (0. 0 – 0. 95) cc for V10Gy [cc]. For V12Gy [cc] values were 0. 0 (0-0. 1) cc for both VMAT and fixed. Both V5Gy [cc] and V10Gy [cc] demonstrated dependence on cumulative volume of PTVs in the multi-target plan.
For V5Gy [cc], using the functional form in equation 7 for quantile regression, coefficients (a, b) were (12. 5, 0. 317), (26. 5, 0. 29), (31. 3, 0. 5) for the 25%, 50% and 75% quantiles respectively. For fixed beams, respective coefficients were (4. 14, 0. 62), (5. 89, 5. 64) and (8. 69, 0. 65). Median and 50% CI at 3 cc cumulative PTV volume were 18 (9-36) cc and 11 (8-18) for VMAT and fixed beams. For 13 cc cumulative PTV volume respective values were 56 (28-113) and 25 (20-51). Fixed beam V5Gy [cc] values were significantly (p<< 0. 0001) lower than VMAT.
For V10Gy [cc], coefficients (a, b) were (0. 102, 0. 056), (0. 401, 0. 089), (0. 771, 0. 531) for the 25%, 50% and 75% quantiles respectively. For fixed beams, respective coefficients were (0. 005, 0. 844), (0. 108, 0. 768) and (0. 374, 0. 761). Median and 50% CI at 3 cc cumulative PTV volume were 0. 44 (0. 11 – 1. 4) cc and 0. 25 (0. 01-0. 86) cc for VMAT and fixed beams. For 13 cc cumulative PTV volume, respective values were 0. 50 (0. 12-3. 0) cc and 0. 78 (0. 05-2. 6) cc. For 10Gy [cc] fixed beam values were similar overall between VMAT and fixed beams.
Discussion
Automated analysis of SRS planning metrics provides a number of insights into the planning process and assists with ongoing quality assurance of plans. The metrics derived enable quantitative vs qualitative distinctions between plans such as VMAT and fixed field plans for multi-target SRS.
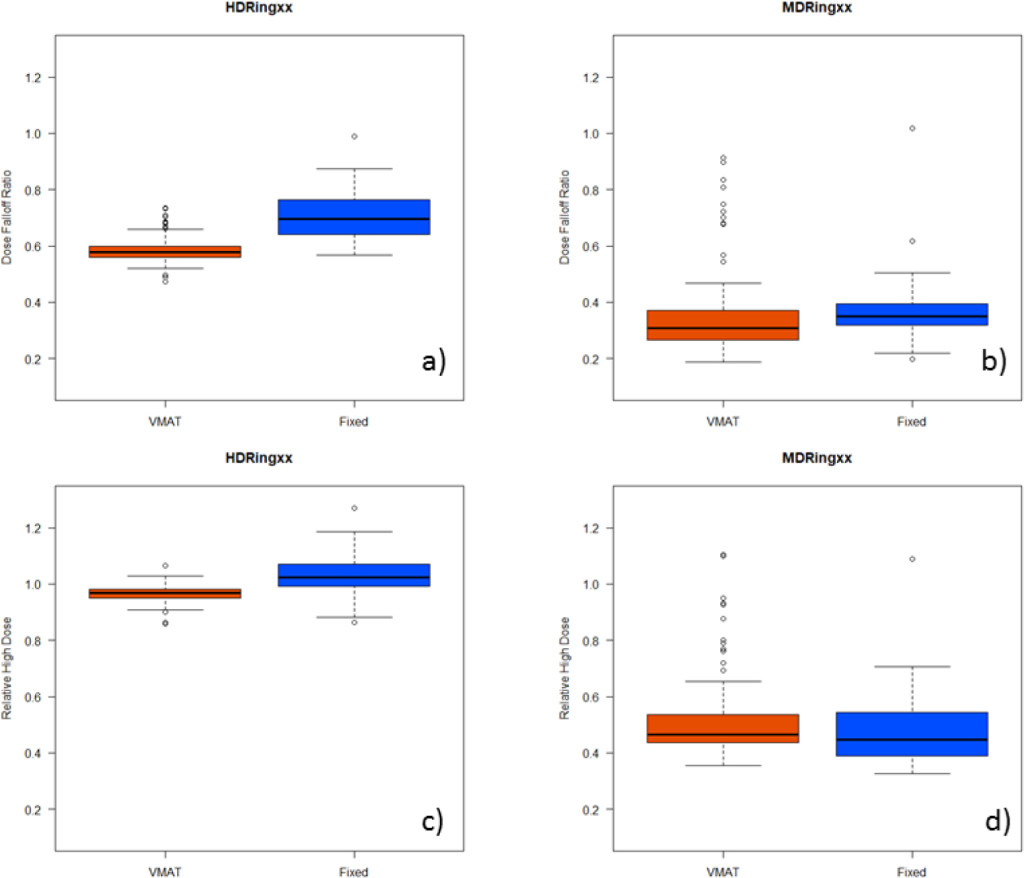
Figure 4. Characterizing dose distributions near to the PTVxx structures. Distributions of DFR and RHD values are illustrated with box and whisker plots for HDRingxx (a, c) and MDRingxx (b, d) structures.
Figure 2 shows the differences in conformity index and effective gradient (GrEff) between the two groups of plans. The quantile fits of these data show similar behavior between the two planning strategies. Conformity index is relatively constant for larger volumes but increases dramatically below a target volume of 0. 5-1. 0 cc. There is an improvement in conformity index with VMAT plans but a reduction in effective gradient compared to fixed field plans. The quantile analysis aids in providing a range of acceptable metric values for use in evaluating plan quality.
As expected, VMAT plans tend to spread more low dose to normal brain compared to fixed field plans because of the rotational nature of this treatment technique (see Figure 2a-c). However, this effect plateaus near 12 Gy. Figure 2d shows the V12Gy for normal brain for all plans included in this study, illustrating the similarities between the two techniques at this dose level. During the transition to multi-target VMAT treatment techniques, it is essential to closely monitor low-dose spread to minimize potential for cumulative low dose effects when patients return for additional treatment.
Figure 3 further investigates the distribution of dose outside of the target in the HDRingxx (within 0. 5 cm of the target) and the MDRingxx (0. 5 – 1. 0 cm from the target). The HDRingxx has a higher hotspot in fixed field plans however, the dose complement (hottest dose to the coldest 5% in this case) is in fact lower in the fixed field plans. One reason for this reversal is that the fixed field plans tend to be more asymmetrical due to the limited number of beam angles.
In their study of 6 patients with a total of 19 targets, Liu et al noted conformity indices of 1. 19 ±0. 14 for VMAT based SRS (RapidArc) compared to 1. 5 ± 0. 16 for Gamma Knife [3]. Mean V12Gy [cc] and V4. 5Gy [cc] values were 9. 7± 5. 1 cc and 10. 9± 7. 2cc for VMAT compared to Gamma Knife. Mean V4. 5Gy [cc] was 99 ± 27. 3 cc and 86. 7 ± 7. 2 cc VMAT and Gamma Knife respectively. Volume dependence of metrics was not investigated in that study. Similarly, Thomas et al re-planned 28 Gamma Knife cases with VMAT [2]. They reported in conformity index median of 1. 29 with ranging from 0. 99 to 4. 31 for VMAT compared to 1. 94 ranging from 1. 21 to 6. 10 for Gamma Knife plans. In an early (2010) study of VMAT (RapidArc) based SRS, for 12 patients and 14 targets (5. 2 ± 6. 0cc), Mayo et al. reported a mean conformity index of 1. 1 ± 0. 11 and a mean GrEff of 80 ± 0. 11 [1].
Our metrics compare favorably with those of prior authors demonstrating the viability of the algorithmic planning approach. By using the script to incorporate metric evaluation into the routine planning workflow, we were able to gather a much larger dataset than prior studies. This provided sufficient information to extend analysis to characterize volume dependence. Expansion of the amount of clinically relevant data produced by integrating analysis can collection into clinical processes further demonstrates value of the standardized, algorithm approach to planning and evaluation.
With quantification of distributions by quantiles, including regressions to account for PTV volume dependence, the evaluation script can be further enhanced to highlight values for individual plans that are outside the historic norms of our practice. This provides the basis for actively incorporating statistics on historic experience back into routine clinical planning processes. Further, the standardized approach for grouping individual constraints and historical context into a single plan evaluation metric, recently described by Mayo et al, will be incorporated into the script for overall plan evaluation using the set described [7].
The ability to efficiently create and evaluate treatment plans is an enormous asset in such a time-limited and work-intensive process as stereotactic radiosurgery. When write-enabled scripting becomes available for clinical use in Eclipse, the process of creating the structures and optimization constraints a described in this study could be made considerably faster. To demonstrate this potential, we created a set of ESAPI scripts in our non-clinical development environment to automate structure creation and plan optimization. These were run on plans transferred into the development environment to check the accuracy of the scripts and the time to execute. Automating these steps ensures consistency in creation and evaluation of plans, with the ability to easily identify outliers a compare plan quality across planners as well as institutions. These types of scripts could also be combined with knowledge-based planning strategies to further automate the planning process.
Conclusions
We believe the future of treatment planning is increased utilization of automation using statistically-based quantifications of experience to guide design and evaluation. Creation of algorithmically based planning approaches that also produce clinically meaningful quantified metrics is an important enabling step. Such metrics provide quantitative basis for defining differences between plans. By characterizing distributions of these metrics from clinically acceptable plans, expectation values for subsequent plans can be established. Our objective here is to report a method we have implemented as part of our transition to multi-target VMAT based SRS and demonstrate the utility of the method for making quantitative comparisons that can be incorporated into routine clinical practice
Acknowledgements: The work described was supported in part by a grant from Varian Medical Systems. We wish to thank Drs. Xxxxx and xxxxx at the xxxxx and yyyyy of yyyyy for sharing their insights and methods used in multi-target SRS VMAT planning.
References
- Mayo CS, Ding L, Moser R et al. Initial experience with volumetric IMRT (RapidArc) for intracranial stereotactic radiosurgery Int. J. Radiat. Oncol. Biol. Phys. 78: 1457–1466,
- Thomas EM, Popple RA, Fiveash JB, et al. (2014) Comparison of plan quality and delivery time between volumetric arc therapy (RapidArc) and Gamma Knife radiosurgery for multiple cranial metastases. Neurosurgery. 75:409–17.
- Liu H, Andrews DW, Shi W et al. (2016) PlanQuality and Treatment Efficiency for Radiosurgery to Multiple Brain Metastases:Non-Coplanar RapidArc vs. Gamma Knife. Front Oncol 11;6:26.
- Fiorentino A, Giaj-Levra N, Tebano U, Mazzola R, Ricchetti F, et al. (2017) Stereotactic ablative radiation therapy for brain metastases with volumetric modulated arc therapy and flattening filter free delivery: feasibility and early clinical results. Radiol Med 122: 676–682. [crossref]
- Clark GM, Popple RA, Fiveash JB, et al . (2012) Plan quality and treatment planning techniquefor single isocenter cranial radiosurgery with volumetric modulated arc therapy. Pract Radiat Oncol 2:306–13.
- Clark GM, Popple RA, Young PE, Fiveash JB (2010) Feasibility of single-isocenter volumetric modulated arc radiosurgery for treatment of multiple brain metastases. Int J Radiat Oncol Biol Phys 76:296–302.
- Mayo CS, Yao J, Eisbruch A et al. (2017) Incorporating big data into treatment plan evaluation: Development of statistical DVH metrics and visualization dashboards, Advances in Radiation.