Author Archives: dev

Consumer Requirement for a Healthful Vegetable Muffin: Agile Knowledge-Development through Mind Genomics

Abstract

We provide a rapid approach to the evaluation of new product ideas and opportunities through the science of Mind Genomics. The approach requires the specification of a product or opportunity, the creation of four questions which ‘tell a story,’ each with four answers (total of 16 answers), and the evaluation of combinations of the answers by a small, affordable group of 25 respondents. We look at the ratings for ‘most interested’ (top of the scale), identify mind-sets, and discover what ideas both interest people (opportunities), and engage people when thinking about them. We uncover new-to-the-world groups (high acceptor mind-sets) to identify which ideas about the new product are most compelling, and search for these high-acceptor mind-sets using a simple, 6-question personal viewpoint identifier. The approach is designed for rapid use, requiring a day or two at most, thus targeting the newly emerging cadre of food entrepreneurs who are not hampered by the traditional processes designed to reduce risk rather than capture opportunities.

Introduction

There is a continuing search for healthful snacks. The increasing and massively competitive focus on good-for-you, along with the knowledge that it is good tasting to ensure repeat purchase, means that the food company must develop efficient ways to screen new ideas. Over the decades, solution-providers in the food industry, particularly, but consumer package goods generally, have explored various ways to create new product ideas, ranging from the evaluation of different ideas (promise testing) to the assessment of concepts, with and without the presence of a product. The results of the effort have not been successful, perhaps because the researcher does not understand in depth the features of the product concept which make it attractive. Even focus groups, specifically called to ferret out the features which the product should have often do not identify what the product should be.

Part of the reason for failure or at least for the failure to succeed, is the tendency of researchers to create combinations with which they are comfortable, and to avoid creating product ideas or prototypes that they think will ‘fail.’ That is, there is an insidious drive for rationality in people, especially brand managers, but also market researchers and product developers. In the face of market failure, it is hard to accept that one’s ideas of what is a good product must have been wrong. Blame is cast upon sales, distribution, advertising, not upon the fact that the research approach simply came up with the wrong idea, an idea that ended up getting adopted and losing money when the manufacturer puts the product to the real test, the jury of public opinion. This desire not to be embarrassed by offering ‘bad test stimuli’ in the name of progressing the project can derail even the best of teams, as individuals think of themselves first, and only later of the project success.

Testing ideas for new and healthful products might take a lesson from the great American inventor, Thomas Edison, who used failure as a springboard to success. Each failure, in the mind of Edison, was something from which a lesson could emerge. What would happen to the creation of new and healthful ideas about food if we were to systematize the invention process, not so much in the systematic, lock-step way that systems current do (e.g., Stage Gate, Cooper, 1979; 1990) [1,2], but rather as a system to create combinations, see how they work, and move on? The creation of combinations should not be done by a person who is doing the thinking, but rather through experimental design, the systematic, statistics-driven method of making combinations of variables.

The food industry is plagued by a continuing spate of failures, often failures of a single unusual flavor in an otherwise successful line, but occasionally a massive ‘flame out,’ a major line of brands simply crashing. Professionals and the trade in the food industry accept this failure, assuming it is now part of the reality of the food business. High failure rates may be the result of the structure of the business, but they are also the result of desires to get products into the market for the gratification and resumes of brand manager, as well as the need to announce ongoing ‘innovation’ to the investors and to those in the stock market.

It may well be that part of the problem of today is the perfect storm of risk-aversion, ossified process of new product development, and a knowledge-acquisition system (market research insights, sensory testing) which itself is stultifying, substituting statistical rigor for intellectual acuity and competence. In other words, the system is ‘broken,’ aged, simply not working today because it was designed for yesterday’s slower, less competitive reality.

If one is to believe experts in other areas, such as perfume, and even the new crop of entrepreneurs in the food industry, one might walk away with the belief that the cause of failure is an over-reliance on so-called mindless or ‘insight-less’ consumer research. The expert perfumer, so-called ‘golden nose’ has the reputation of averring that her or his nose, ‘knows what the consumer wants. In the same way, many entrepreneurs ‘know’ what their prospective customers want. They may not have data, but they are swept up in the excitement, the abandon, and the oft-hidden hubris of their own efforts.

The Need for Data but the Complementary Need for Agility

Data are required for new products, especially for ideas, but how does one get these data in a rigorous, rapid, cost-effective manner. There are some who believe that a series of focus groups are the cost-effective way. Others belief that following the market and looking at trends will be the answer. Most believe that agility is key and talk about the need for a better process [3–6]. It is fine to talk about the need for agility, for data, for better decision processes, for more successes, but simply what does one do at a local, operational level, in the day to day world of product design?

The Mind Genomics Approach

The answer may lie in systematic, inexpensive research, in experimental design of combinations of test stimuli. The ratings of these stimuli, properly collected and analyzed, may give us part of the answer. This paper presents a short case history of the approach. It is based upon decades of work, which have led to products such as the Oral B Electric Toothbrush (1992), the Discover Card Cash Back Credit Card (1993), successful jewelry promotions by Kay Jewelers (1997), MasterCard (1007–2006), and ongoing efforts since then in the reduction of hospital readmissions in the case of congestive heart failure (Moskowitz & Gofman, 2018; Moskowitz, 2016, unpublished.)

Mind Genomics is an emerging science, focusing on the science of the everyday. The foundation of Mind Genomics comes from the fields of experimental psychology, consumer research, and conjoint measurement [7–9] Experimental psychology provides the world view, namely explore and define the relation between stimulus and response, rather than using statistical methods to understand large-scale, cross-sectional data. Through experimentation one understands how one variable affects another. Consumer research focuses on the everyday, the quotidian aspects of life, how we make decisions about things that we do, choose, purchase, and so forth. Consumer research provides the general focus, dealing with the normal, not the unusual, and not the strained ‘normalcy’ that must be done by experimental psychologists when they study behavior. Finally, conjoint measurement [10] brings in the use of experimental design, systematic combinations of variables, to understand choice, as these variables compete with each other, and add to each other to drive responses [11–13].

Mind Genomics as it is currently constituted approaches the problem of new product design in a straightforward manner. The governing notion is that one should pose a general topic (e.g., what are the features of a new, vegetable-based muffin for the health market, the topic studied here.) The researcher should then deconstruct the topic into four questions which ‘tell a story.’ This step can be hard or easy, depending upon the topic, the experience of the researcher. Finally, each question should generate four simple answers, phrased in declarative format. This third step is quite easy. It is the formulation of the four questions which is difficult. The approach is decades old, beginning in industrial applications in the early 1980’s by author Moskowitz, and evolving to a so-called DIY (Do It Yourself) technology in early 2000 [14,15].

Method

The mechanics of Mind Genomics are, by now, well-choreographed. The steps below fit very well into the innovation process, as should become obvious.

  1. Identify the Topic, Ask the Questions, and Present Four Answers: Table 1 presents the four questions, and the four answers to each question. Note that the question is only a heuristic to guide the creation of answers. Sometimes the answers are ‘off target,’ but that is irrelevant. It is important to keep in mind that the respondent will never see the questions. The respondent will only see the answers.
  2. Recruit Respondents to Participate, by Email Invitation: The omnipresence of the Internet has enabled researchers to do many types of studies on the Web, without having to meet the respondents. Panel companies have emerged to service the business of recruiting and provided participants for these studies. The past 20 years, the period of massive growth in the use of the Internet, has affected researchers as well. Much research is done on the web, but it is increasingly difficult to recruit respondents to participate, when these respondents come from one’s own list of contacts. The panel providers (here strategic partner, Luc.id, Inc.) guarantee the proper respondents. This study was done with 25 respondents, enough to provide statistically powerful answers through back-end regression modeling, albeit at an affordable price, and very rapidly (1–2 hours for the entire process, from setting up the study to receiving the PowerPoint report, ready for presentation.)
  3. Orient the Respondents: Present the respondents with an orientation page, telling them what the study is about. The sentence below reflects all the information that the respondent receives. It is good practice for the respondent to receive as little information as possible. In such a case, it is the set of elements which ‘drive’ the responses, and not any predetermined set of expectations.

    How intrigued are you about trying this baked snack this coming week: 1=NO WAY … 9=Yes yes yes

    Table 1. The four questions, and the four answers to each question.

    Question A: why do we need vegetables?

    A1

    Sustainable, better for you and better for the earth

    A2

    Vegetable are delicious

    A3

    Vegetables are very healthful for you

    A4

    Vegetables prevent health problems

    Question B: How to make vegetables appetizing & delicious to you?

    B1

    Delicious to eat and good for your body

    B2

    Think healthy, think muffin

    B3

    Global and adventurous eating

    B4

    Vegetable for all ages

    Question C: what will eating vegetable do for you?

    C1

    Lovingly created vegetable baked snacks

    C2

    A delicious way to great health

    C3

    Healthy as delicious for every eating occasion

    C4

    Convenient on-the-go snack

    Question D: how to make it fun to eat vegetable?

    D1

    Real food created by mom and real baker

    D2

    Made from the ingredients found in your own kitchen

    D3

    Customized in four flavors: cauliflower, chocolate pomegranate, carrot morning glory, garden vegetable

    D4

    This is gluten free and all natural

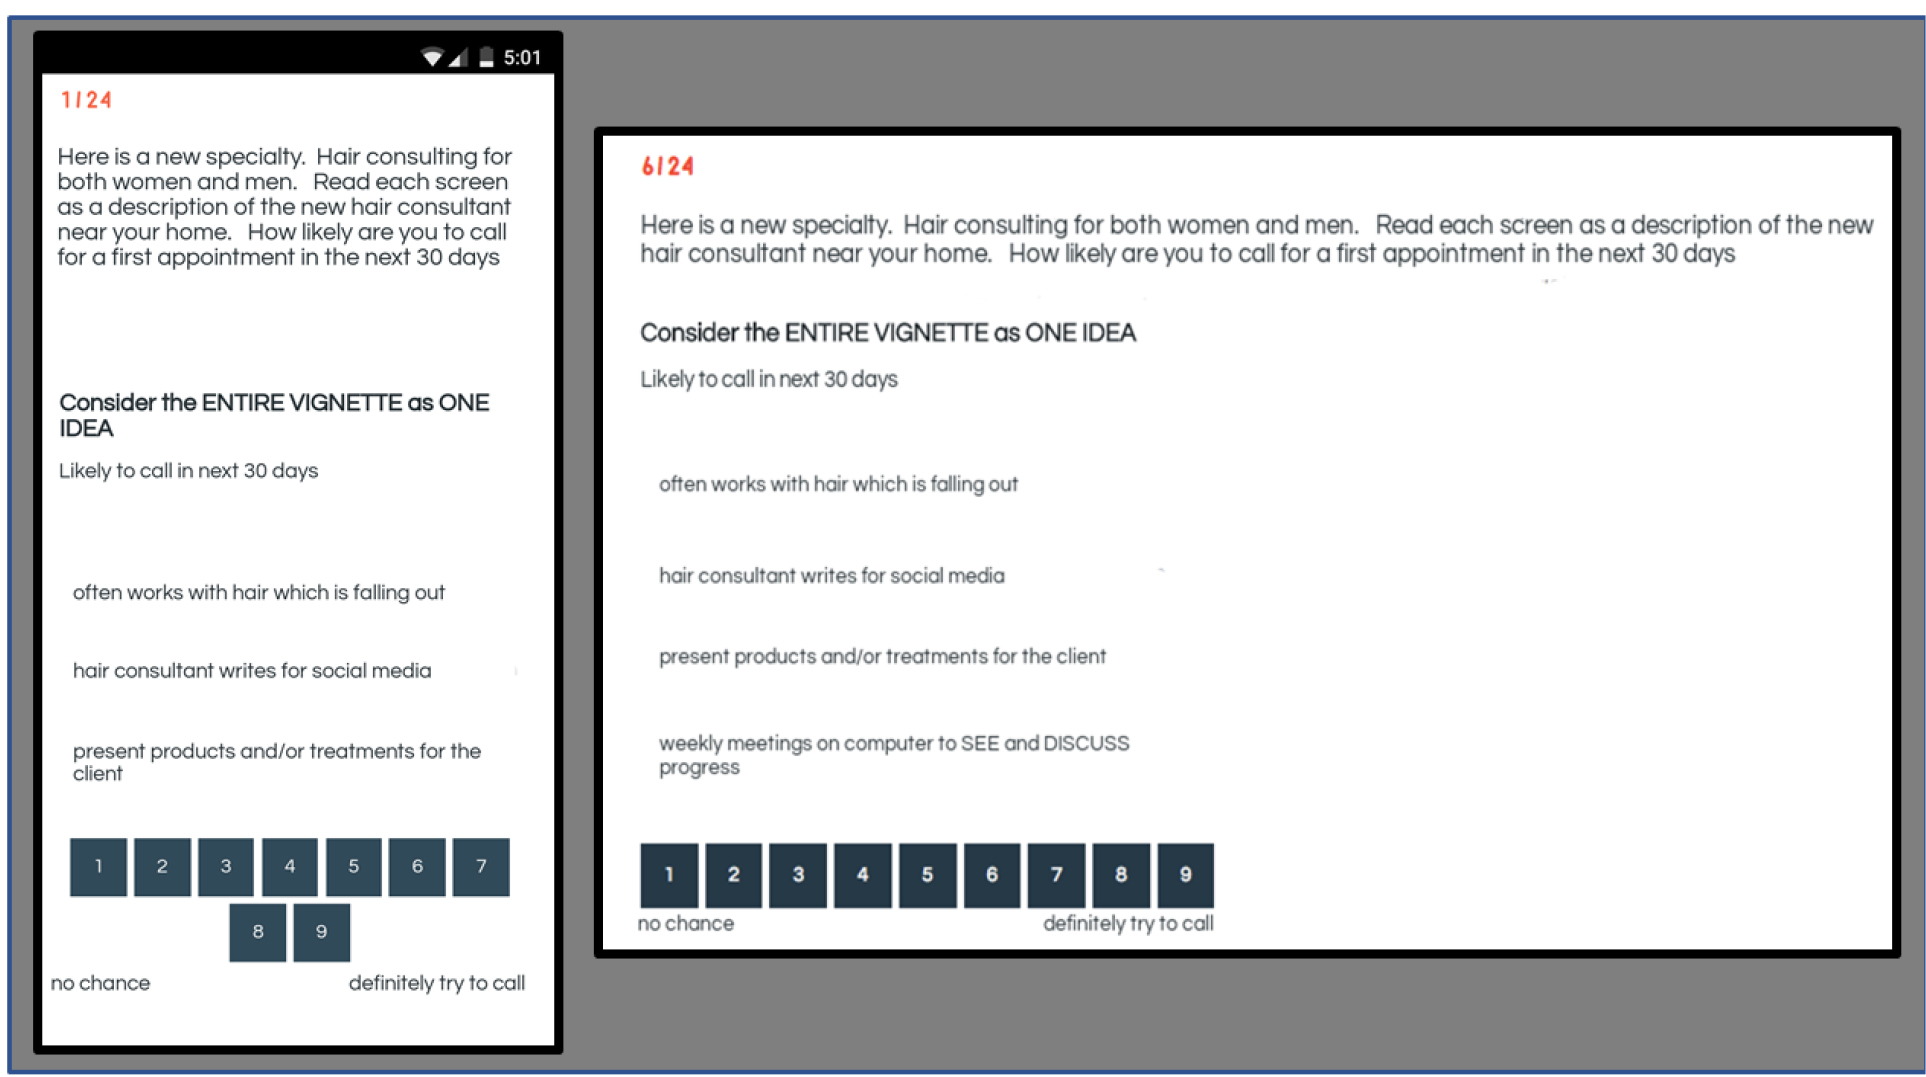
  4. Respondent Evaluates Systematically Varied Combinations (Vignettes): Each respondent evaluates 24 vignettes, a vignette comprising 2–4 elements, at most one element or answer from each question, but sometime no elements or answers from a question. The structure of the experimental design ensures that each element appears an equal number of times, and that the set of 16 elements are statistically independent of each other. The statistical independence allows for the application of OLS (ordinary least-squares) regression to relate the presence/absence of the 16 elements to the binary transformed rating (whether Top3, Top2 or Top1, respectively.) Furthermore, each respondent evaluated a different set of 24 vignettes. The underlying design is the same for each respondent [15,16]. Only the specific combinations change. This change in the combinations, maintaining, however, the basic structure of the design, is akin metaphorically to the ‘MRI’ in medicine, which takes different pictures of the same structure, and then recombines these pictures to give a 3-dimensional rendering of the structure. Figure 1 presents an example of a vignette as it would appear on the screen of a smartphone, making it possible to do research anywhere in the world, in almost any situation.

    Mind Genomics-021 - NRFSJ Journal_F1

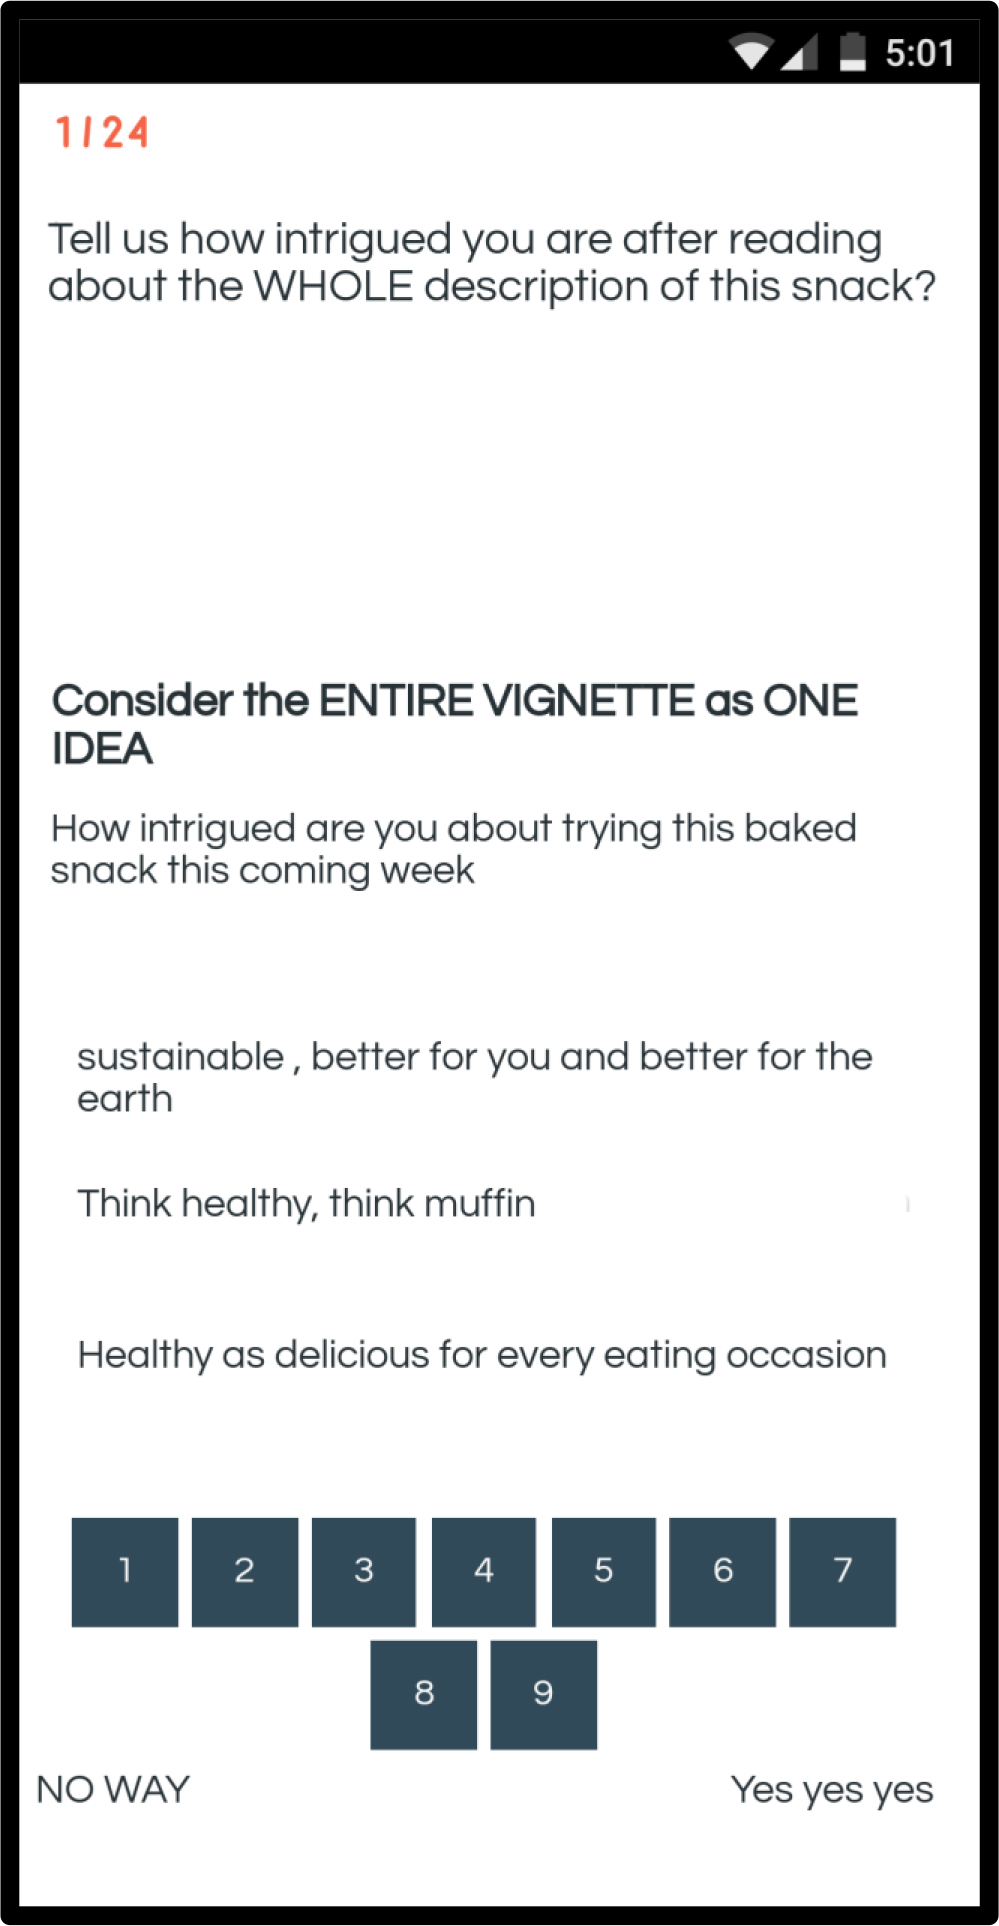
    Figure 1. Example of a vignette as it would appear on the screen of a smartphone.

  5. Prepare the Data for Statistical Analysis: Mind Genomics studies are set up to be analyzed using OLS (ordinary least-squares) regression. The independent variables are the presence/absence of the 16 ‘answers.’ The variables are coded 0/1 to reflect the fact that we are only interested in the effect that they have when they are present in a vignette versus absent from a vignette. They have no intrinsic numerical value. The dependent variable is a recoding of the original 9-point scale. The rationale for re-coding is that in practice, most researchers and business managers do not know how to interpret the numbers on a Likert scale. They do know how to interpret binary numbers (no/yes, bad/good). The rescaling or recoding of the ratings was done with three different criteria, to generate three new dependent variables:

    Top 3 – Ratings of 1–6 recoded as 0, ratings of 7–9 recoded as 100. This is the typical recoding, following standard practices in consumer research.

    Top 2 – Ratings of 1–7 recoded as 0, ratings of 8–9 recoded as 100. This is a more stringent characterization of ‘good’, because only two of the rating points are now ‘good.’

    Top 1 – Ratings of 1–8 recoded as 0, ratings of 9 recoded as 100. This is the most stringent characterization of ‘good,’ because only one rating point is ‘good,’ the highest rating. This will become the preferred approach here because it rapidly eliminates weaker ideas, even when the population of respondents tends to ‘uprate’ the vignettes as is often the case in other cultures, such as respondents in Latin America and in the Philippines. The uprated combinations give the research false positives.

  6. Estimate the Additive Constant and the 16 Coefficients, One for Each of the Answers: Our first analysis from OLS regression appears in Table 2, which compares the coefficients from the model when the three different dependent variables are estimated using the same 16 predictor variables.

    Table 2. Coefficients for the OLS model relating acceptance on the 9-point scale to the presence/absence of elements. Stringency of acceptance was defined at three different levels,

    TOP 1

    TOP 2

    TOP 3

    Stringency for approval – levels of the 9-point scale leading to a value of 100

    High 9

    Med 8, 9

    Low 7, 8, 9

    Additive constant

    25

    34

    58

    C4

    Convenient on-the-go snack

    6

    2

    0

    D2

    Made from the ingredients found in your own kitchen

    4

    4

    4

    A1

    Sustainable, better for you and better for the earth

    1

    1

    0

    A3

    Vegetables are very healthful for you

    1

    8

    5

    A4

    Vegetables prevent health problems

    1

    3

    1

    D1

    Real food created by mom and real baker

    1

    3

    1

    A2

    Vegetables are delicious

    0

    1

    -4

    C2

    A delicious way to great health

    0

    5

    1

    C1

    Lovingly created vegetable baked snacks

    -1

    4

    3

    C3

    Healthy as delicious for every eating occasion

    -1

    -4

    1

    B2

    Think healthy, think muffin

    -2

    -2

    -8

    D4

    This is gluten-free and all-natural

    -2

    3

    5

    D3

    Customized in four flavors: cauliflower, chocolate pomegranate, carrot morning glory, garden vegetable

    -3

    2

    7

    B3

    Global and adventurous eating

    -4

    -3

    -3

    B4

    Vegetables for all ages

    -4

    1

    -5

    B1

    Delicious to eat and good for your body

    -5

    8

    -1

The additive constant estimates the percent of times that a rating would be assigned either 9 (Top1), 8 or 9 (Top 2), or 7, 8 or 9 (Top3). The results from the OLS regression suggest a modest additive constant when the most stringent criterion is adopted (constant = 25), and a high additive constant when the most lenient, least stringent criterion is adopted (Constant = 58 for Top3). We interpret this to mean that when we use a tough criterion (only rating of 9), we get about 25% of the responses to be 9 in the absence of elements. This is a very encouraging result. It suggests that the notion of a vegetable-based muffin is, by itself, is a very good idea. When we reduce the strictness, the additive constant jumps to 58, meaning that in the absence of elements, almost 60% of the responses will be positive, even before the elements are introduced.

Thus far the data suggest strong positive feeling to the basic idea of a vegetable-based muffin. The additive constants are high. Even when we impose the greatest stringency, 9 to become 100, else 0, we find that a full 25% of the time we would we expect a positive reaction to the concept of a vegetable muffin.

When we move to the performance of the individual elements, we do not see any very strong performers, No element really stands out when we adopt the most stringent criterion. The only element which performs well is ‘convenient, on-the-go snack.’ As we look over the different columns, we see no real patterns which promise success. We may either have NO elements or answers which perform well, or more likely, we are dealing with a variety of populations with different proclivities and ideas that they prefer. These groups may cancel each other so what one group really likes, the other groups in the same population dislike. The result is a cancellation.

Looking at Self-Defined Subgroups of Respondents Using the Stringent Criterion of Acceptance

When we divide the respondents by WHO they say they are, we end up with two genders (male versus female), two ages (younger, < 30, older > 29)), and on group who says they are foodies. All groups are small. Yet, the Mind Genomics approach is sufficiently powerful with its permuted experimental designs to reveal the additive constant and the key elements for each group. We use the stringent criterion (rating of 9 recoded to 100, ratings of 1–8 recoded to 0.)

Table 3 shows that the basic acceptance of the vegetable muffin is equal among genders (additive constant is 24 for males, 21 for females), higher for the younger respondents (35 for younger versus 15 for the older respondents.) Finally, the acceptance of a vegetable muffin is higher among those respondents who label themselves ‘foodies’ (additive constant = 42, a very high level of basic interest.)

Table 3. Performance of the 16 elements by total panel, key self-defined subgroups, and by emergent mind-sets. The coefficients are taken from the Top1 model (ratings of 9 transformed to 100, other ratings transformed to 0). The development target is Mind-Set 2.


Total

Male

Female

Younger

Older

Foodie

Mind-Set 1

Mind-Set 2

Base size

25

13

12

31

12

15

10

5

Additive constant

25

24

21

35

15

42

30

22

C4

Convenient on-the-go snack

6

6

5

11

1

9

4

5

D2

Made from the ingredients found in your own kitchen

4

4

5

2

5

7

4

5

D1

Real food created by mom and real baker

1

1

4

-2

5

3

2

-1

A3

Vegetables are very healthful for you

1

0

4

0

2

2

0

2

A4

Vegetables prevent health problems

1

-2

7

-2

3

1

-4

8

A1

Sustainable, better for you and better for the earth

1

2

1

0

1

1

-3

6

A2

Vegetables are delicious

0

1

-1

-3

3

-2

0

-1

C2

A delicious way to great health

0

4

-3

0

1

0

2

-5

C3

Healthy as delicious for every eating occasion

-1

9

-11

-1

0

-2

-1

-3

C1

Lovingly created vegetable baked snacks

-1

6

-9

0

-2

-3

-2

-2

D4

This is gluten-free and all-natural

-2

-2

-1

-9

5

-2

-4

2

B2

Think healthy, think muffin

-2

0

-3

-5

1

-6

-4

-1

D3

Customized in four flavors: cauliflower, chocolate pomegranate, carrot morning glory, garden vegetable

-3

-7

2

-9

3

-2

-5

0

B4

Vegetables for all ages

-4

3

-7

-11

2

-8

-7

-3

B3

Global and adventurous eating

-4

-6

0

-7

-2

-8

-9

1

B1

Delicious to eat and good for your body

-5

0

-6

-9

-1

-8

-6

-5

Looking at the pattern of coefficients, the data suggest two messages for the product:

A convenience message, emphasizing a ‘convenient, on the go snack’. This positioning should appear to the total panel, but especially appeal to the younger respondent, and the respondent who considers him or her a ‘foodie.’

A ‘home’ and ‘health’ orientation, emphasizing that the product is ‘made from the ingredients found in your own kitchen.’ This phrasing can be elaborated for health but must be done so with care.

Dividing Respondents by Mind-Sets

One of the tenets of Mind Genomics is that in any topic where human judgment is important, there are different patterns of judgment, based upon the way individuals value the various aspects of the situation. Thus, in a product, one may focus on convenience, whereas another may focus on price, and a third may focus on nutrition, etc.) These mind-sets emerge by a statistical analysis of the results, clustering, which looks at the pattern of coefficients, and puts the respondents into a small set of mutually exclusive and exhaustive groups, mind-sets [17]. The coefficients show how the respondent weights the different pieces of information to drive a rating. Thus, clustering the individuals on the basis of the pattern of their 16 coefficients for the specific product of vegetable muffin reveal new, presumably more coherent subgroups. The individuals in a mind-set are presumed to show the same pattern, again for the specific product being developed. Mind Genomics works at the level of the very specific and does not requiring an armory of hypothetical constructs to move from general psychographic segmentation to the mind-sets pertaining to a vegetable muffin. Traditional psychographic segmentation misses the link from the general to thea particular [18].

Table 3 suggests that with our small sample of 25 respondents two clusters emerge. These are the two mind-sets. The two mind-sets show equal, moderate acceptance of the basic idea of the vegetable. Mind-Set 1 cannot be easily appealed to. Mind-Set 2, however, shows strong reactions to health and sustainability, Mind-Set 2 seems to be more coherent in what they like. They may not like the product more, but they give a sense of being more coherent, and possibly easier to reach. Thus Mind-Set 2 is the logical target to satisfy.

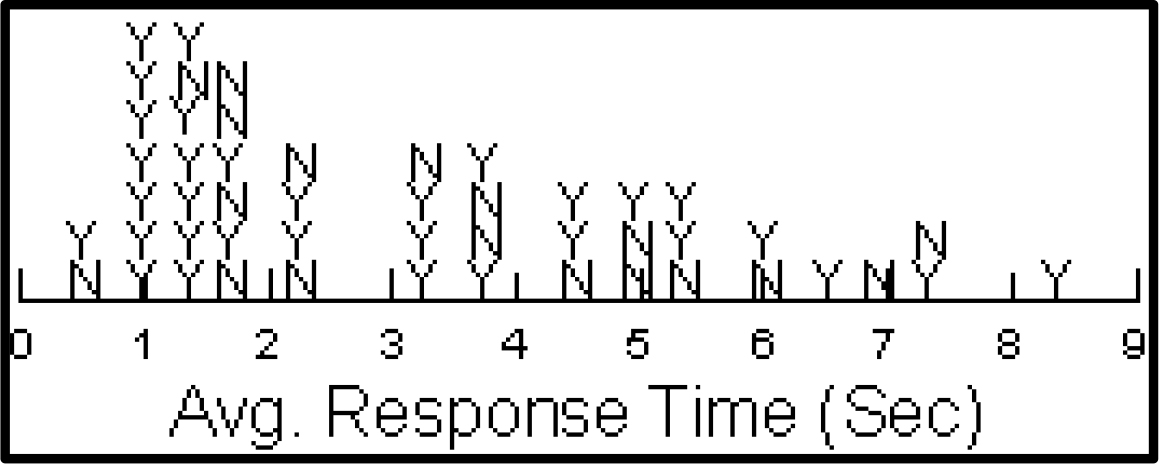
What Engages the Reader – Analysis of Response Times

Beyond the ratings one can get an idea of what messages engage the reader, and what messages the reader simply discards, passing over the message. Typically, the process of reading and deciding happens quickly, within a few seconds. It is virtually impossible for the respondent to ‘know’ how much time is spend engaged in reading. Yet, the systematic variation of the combinations coupled with a measure of overall response times enables the researcher to estimate how many tenths of seconds of one’s response time can be allocated to each of the elements or messages in the vignette.

The approach to understand response times follows that used to relate the presence/absence of the 16 elements to the ratings (e.g., Top 3, Top 2 or Top 1 rating.) The key differences are:

  1. The first vignette evaluated by each respondent is removed from the analysis. Other studies, as well as this, suggest that the respondents ‘learn’ what to do when rating the first vignette. Their response time may be artificially longer, but they are unaccustomed to the study. Respondents become accustomed quite quickly, so by the second vignette they are virtually ‘up to speed’ on what to do. The analysis removed this first vignette, leaving 23 vignettes evaluated by each respondent.
  2. All vignettes with response times exceed 9 seconds are removed. This precautionary action ensured that the remaining data reflected situations wherein the respondent was actually reading the vignette, whether paying attention to the messages or not.
  3. The result of the steps 1 and 2 above generated a data set comprising 534 observations, rather than the original 600.
  4. The model linking response time (seconds) to the presence/absence of the elements was estimated using OLS regression. The model is the same as the linear equation estimated for the rating of interest, except that there is no additive constant. The equation is expressed as: Response Time = k1(A1) + k2(A2)…k16(D4)
  5. The coefficients give a sense of the number of seconds spend by a typical respondent in the subgroup to ‘read’ the element in the vignette.
  6. Table 4 presents the coefficients for the different response times, for each element, by each key subgroup.

Table 4. Response times, defined as the linkage between the number of seconds estimated to be spent ‘reading’ each of the 16 different elements.

Total

Male

Female

Younger

Older

Foodie

Mind-Set 1

Mind-Set 2

Average Response Time

0.9

1.0

0.8

0.6

1.2

0.8

0.8

1.0

B3

Global and adventurous eating

1.4

1.5

1.5

0.8

1.9

1.4

0.9

2.1

C1

Lovingly created vegetable baked snacks

1.2

1.4

0.8

0.9

1.7

1.1

0.8

1.7

B2

Think healthy, think muffin

1.1

1.2

1.0

0.8

1.4

1.0

0.8

1.4

B4

Vegetables for all ages

1.1

0.9

1.5

0.6

1.6

1.1

0.7

1.6

C3

Healthy as delicious for every eating occasion

1.0

1.2

0.8

0.3

1.9

0.4

0.8

1.3

B1

Delicious to eat and good for your body

1.0

1.1

1.0

0.5

1.5

0.9

0.6

1.4

D3

Customized in four flavors: cauliflower, chocolate pomegranate, carrot morning glory, garden vegetable

1.0

0.9

1.0

0.8

1.3

0.7

0.9

1.2

D2

Made from the ingredients found in your own kitchen

0.9

0.8

0.9

1.1

0.7

1.1

0.6

1.3

C2

A delicious way to great health

0.9

0.8

0.9

0.8

1.1

0.8

1.1

0.5

C4

Convenient on-the-go snack

0.8

0.7

1.0

0.7

1.0

0.6

0.9

0.7

A4

Vegetables prevent health problems

0.8

1.0

0.4

0.7

0.7

1.0

1.1

0.3

D1

Real food created by mom and real baker

0.8

0.9

0.6

0.8

0.9

0.6

0.7

1.1

D4

This is gluten-free and all-natural

0.7

0.8

0.5

0.5

1.2

0.6

0.8

0.9

A1

Sustainable, better for you and better for the earth

0.7

0.8

0.6

0.4

1.0

0.9

0.8

0.6

A3

Vegetables are very healthful for you

0.6

0.6

0.6

0.1

0.9

0.6

0.7

0.4

A2

Vegetables are delicious

0.4

0.7

0.1

0.1

0.7

0.4

0.5

0.3

The results from this small-scale study are again enlightening.

  1. On average, the typical time for an element is 0.9 seconds
  2. Men and women spend about equal time reading the elements (1.0 seconds for males, 0.8 seconds for females.)
  3. Older respondents spend longer time, on average, than do younger respondents (1.2 seconds versus 0.6 seconds.)
  4. Foodies spend an average amount of time, overall, reading the elements as do the two mind-sets.
  5. The elements differ dramatically in their ability to engage. For example, ‘Global and adventurous eating’ takes up 1.4 seconds on average, and among older respondents takes up 1.9 seconds, and among Mind-Set2 takes up 2.1 seconds. In contrast’ ‘Vegetables are delicious’ and ‘Vegetables are healthful for you’ appear to be glossed over by every but males and older respondents.
  6. Engagement does not predict interest, however. Just because a message engages and takes longer to read does not mean that the message will drive acceptance. For example, the two messages driving strong responses among Mind-Set2 (Vegetables prevent health problems; Sustainable, better for you and better for the earth) are not engaging in terms of time spent.
  7. In the development of stronger ideas from new products, engagement, perhaps time spent in focus groups, may not be an automatic indicator that the idea will be motivating.

Finding Mind Sets

One of the key benefits of Mind Genomics is its ability to uncover new-to-the world mind-sets, groups of people with similar ways of looking at the world. Traditionally, the notion of segmentation, dividing people, has implied collecting the data from hundreds, and now thousands of respondents, based upon either questionnaires, or more frequently now, purchase behavior recorded on the web, or in a loyalty program. From that often-expensive enterprise comes a way to identify people, either by asking them a set of questions or by observing their behavior patterns and assigning them to a segment.

We deal here with 25 respondents, for a limited product, muffin, at the very early conceptual stages. Despite that, we see that there are two mind-sets, at least in this very early study. How then do we find people in Mind-Set2, our potential group? People don’t wear signs on their foreheads announcing the mind-set to which they belong, and even if they did, we can always come up with new-to-the-world products which have no history on which to create segments, clusters. Table 5 shows that the two mind-sets distribute across gender, age, and even self-defined food preferences (here ‘Foodie.’) The answer is NOT more respondents, although that might be the reflex response. Instead of 25 respondents, we could opt for 2500 respondents, but we are likely to get similar distributions. Another way of thinking about the problem is needed. Rather, the answer is a way to identify people as members of the appropriate mind-set, either in the development of the new product, sampling of the new product in stores, or mass advertising, respectively.

Table 5. Distribution of the two mind-sets in the population of 25 respondents.


Total

Mind-Set 1

Mind-Set 2

(Target)

Total

25

15

10

Male

13

8

5

Female

12

7

5

Young

13

8

5

Old

12

7

5

Foodie

15

10

5

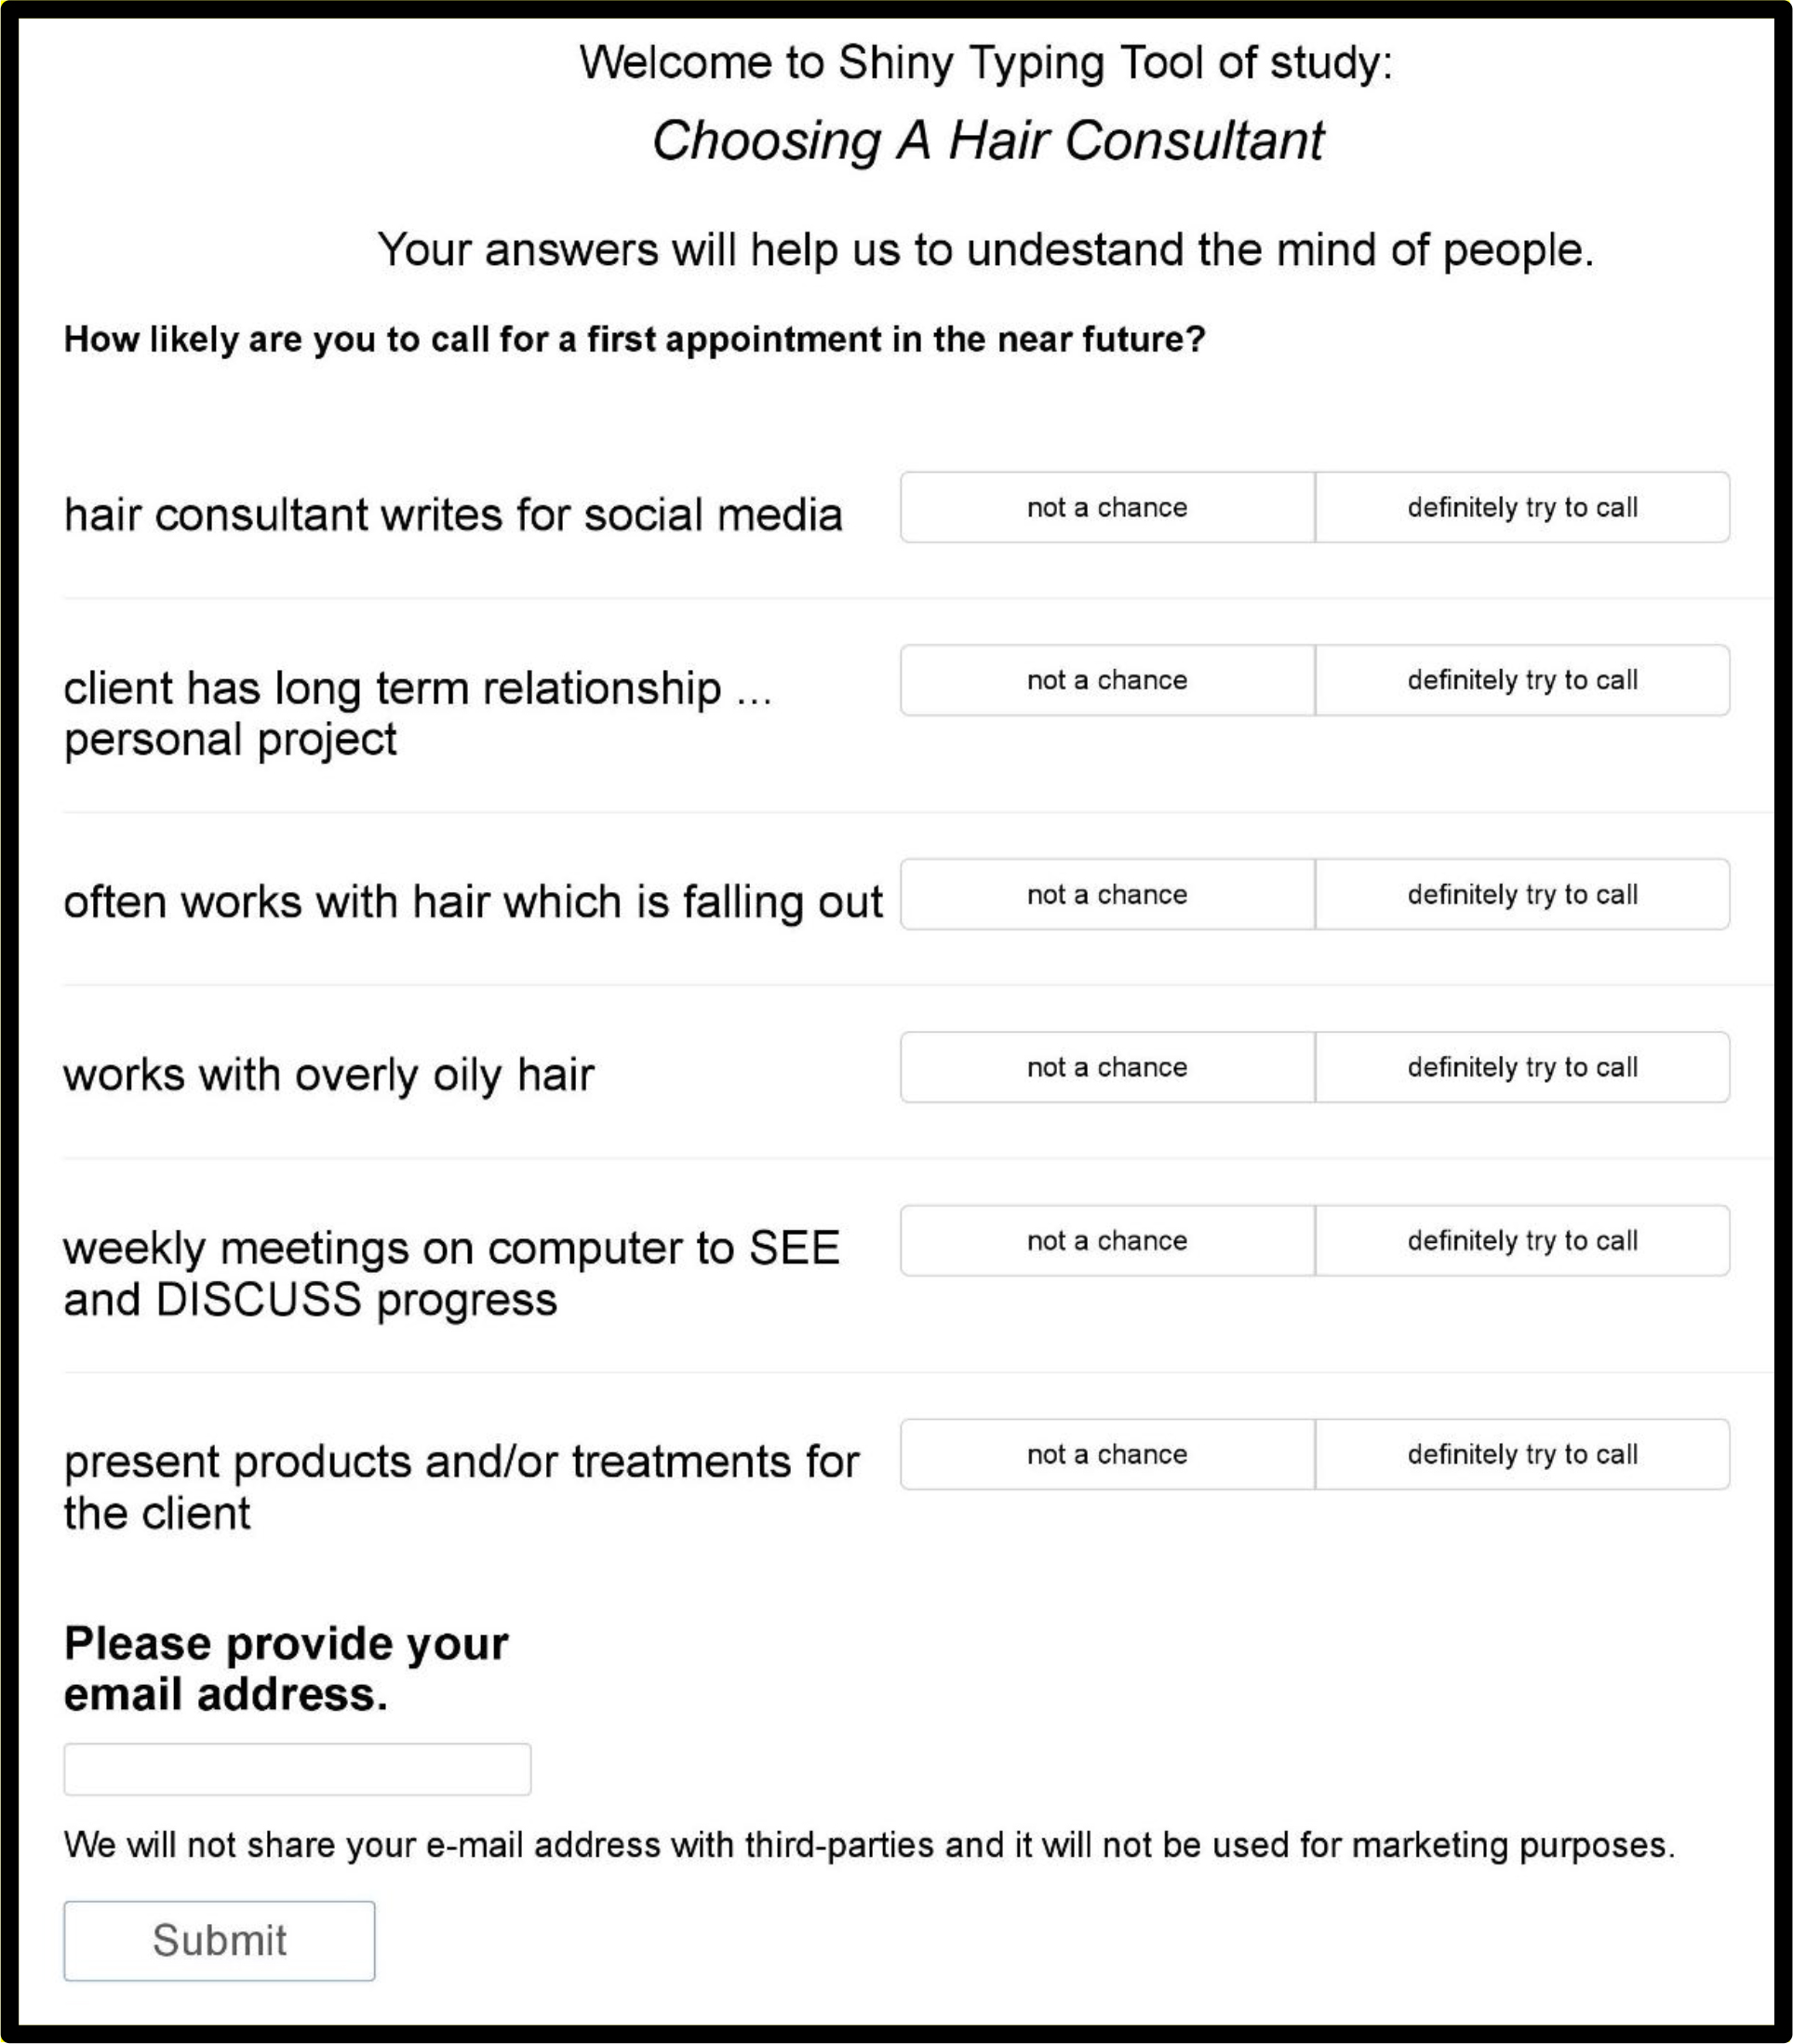
The best way to find new mind-sets, in an efficient manner, matching the speed and cost of the basic study, creates simple PVI, personal viewpoint identifier. We know the mind-sets from the study, and we know how the different mind-sets react to the elements. We can create a set of six questions, with two possible answers to each, such that the pattern of the answers (all 64 patterns) will suggest that the person completing the PVI will be a member of Mind-Set2 (the target for development and marketing), or Mind-Set1 (not the target.)

Figure 2 shows the PVI created for this small study. As of this writing (June, 2019) the PVI resides at http://162.243.165.37:3838/TT36/

Mind Genomics-021 - NRFSJ Journal_F2

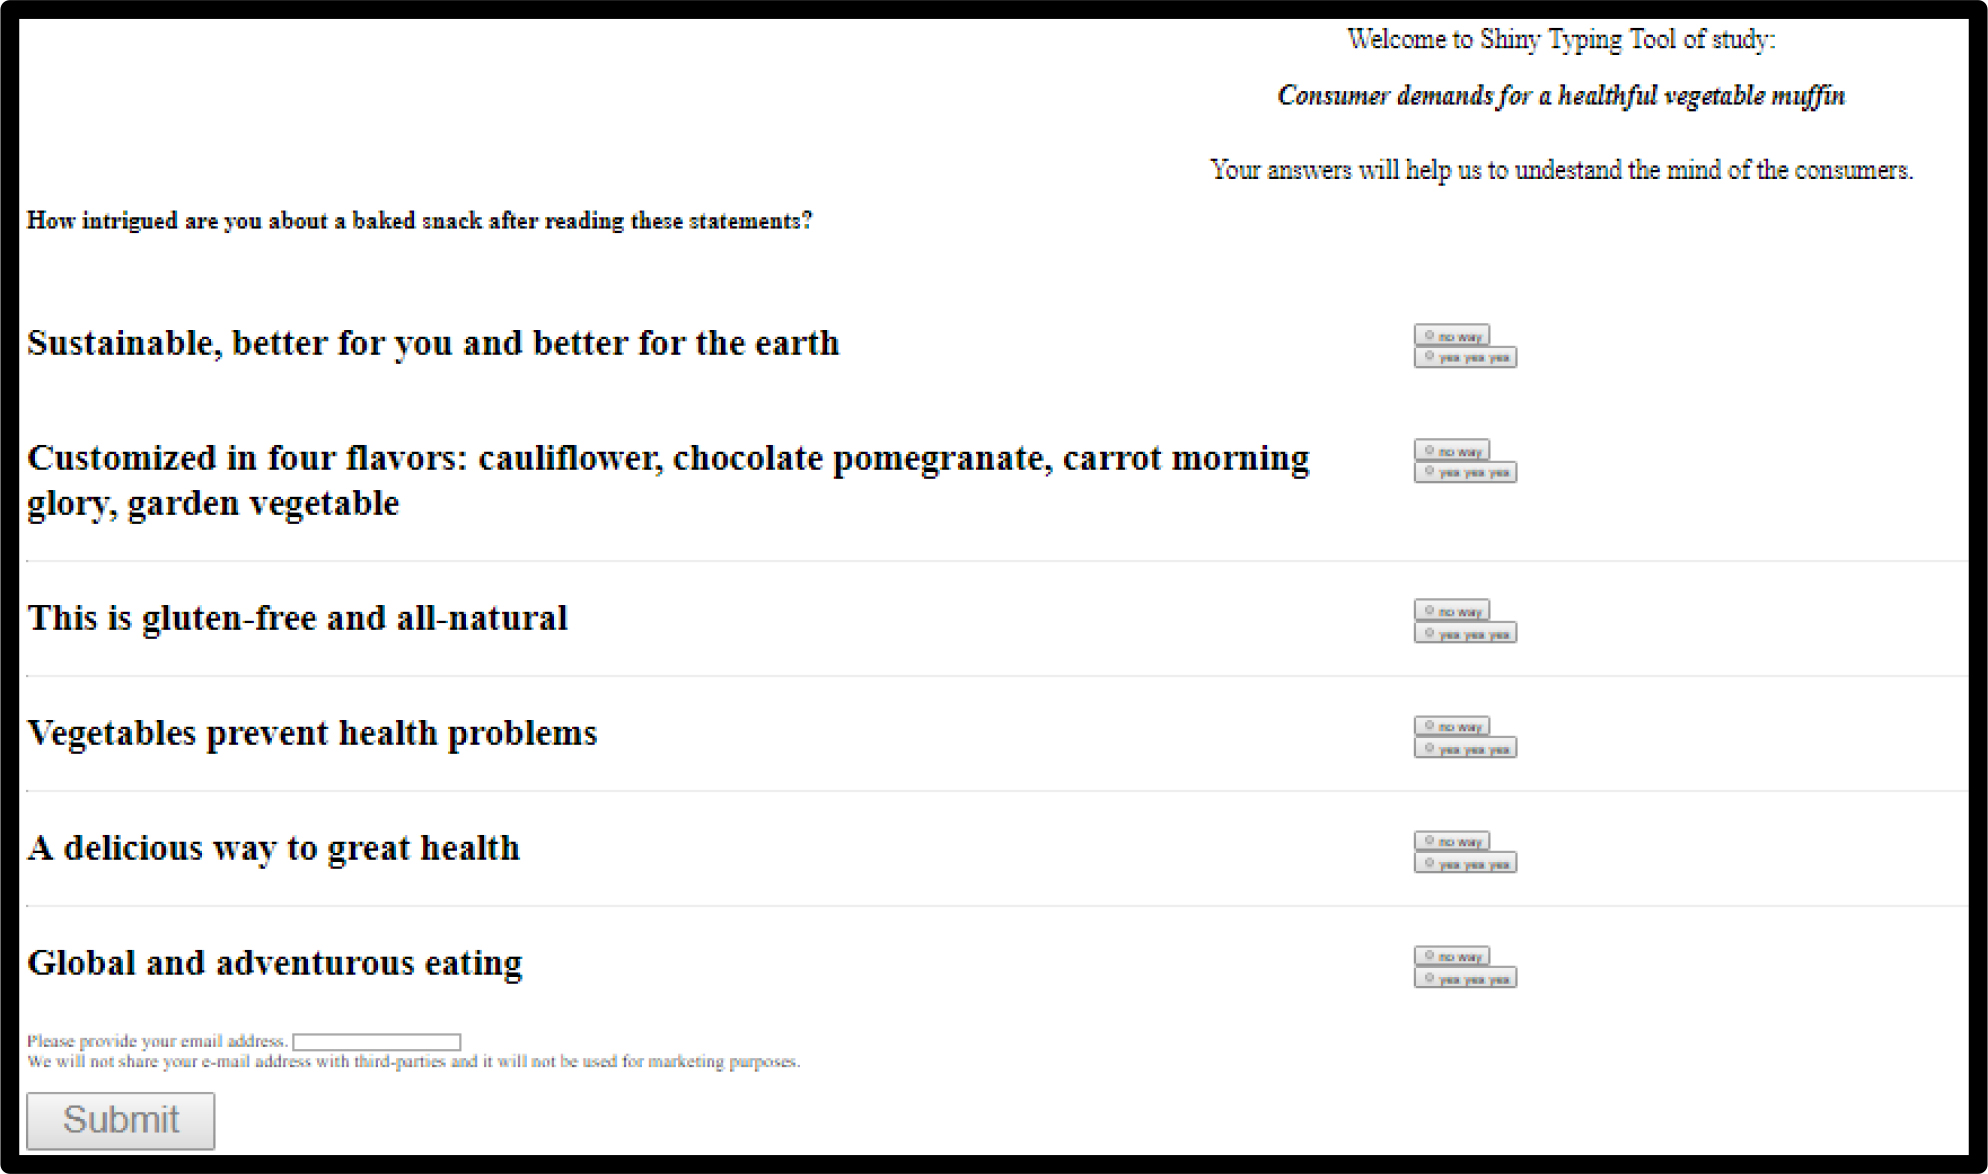
Figure 2. The Personal Viewpoint Identifier (PVI) for the vegetable muffin, showing the six questions. The pattern of answers assigns the respondent to Mind-Set1 or Mind-Set 2.

It is worth reiterating that the spirit of the project is to identify a potential product opportunity. This paper shows the possibility of using powerful techniques to understand product opportunities and people, not at the end of development where the decisions have been made and the costs of failure are high, but rather at the very beginning of the development project, where the structured approach provides the beginning of a roadmap. One could imagine using the PVI to identify those likely to be in Mind-Set2, and then working with to define the appropriate product features, and most effective advertising messages.

Discussion and Conclusion

The origin of this study was from a discussion about the best way to create a new idea in a product category.

Traditional methods included ideation (e.g., brainstorming), promise testing, concept testing, concept optimization, along with very expensive product/concept tests, and even predictions of market share such as BASES [19,20].

The foregoing methods are long, cumbersome, expensive, and ultimately oriented to the clerical and purchasing function. What started out as a method to create ideas for new products has ended up being a choke on ideas, such as the vaunted methods of Stage Gate [2], and the standardized practices of past and current giants such as General Foods, Kraft Foods, Procter & Gamble, and so forth. These steps have been codified into best practices, with appropriate activities, norms, and so forth, until s create a climate of fear and risk aversion, preventing the corporation from actually coming up with new products. The ‘process becomes the product, the product itself almost forgotten as the process takes over, perhaps analogous to the way the parasite subvert the biological processes of its host.’

In recent years, beginning about 20years ago, there has been a movement away from these large-scale, risk reduction processes, towards so-called agile development [21–23].

There is still the ever-present fear of failure in corporations, counterbalanced by the often totally ‘seat of the pants’ efforts by entrepreneurs who have abandoned or who cannot afford such best practices in the formulation of that idea. The method here, fast, inexpensive, powerful, based on an APP, and done in 2–4 hours at low cost, scalable, and iterative if necessary, presents a new vision of what could be accomplished when thinking, rather than process, is given a ‘technical tool for creative thought’ (personal communication from Anthony Oettinger, March, 1965, to Howard Moskowitz.) The approach relies upon what Kahneman [24] has called ‘System 1,’ the intuitive, rapid, almost automatic system by which we make most of our daily decisions. As a historical aside, it is worth noting that the approach, developed originally by author Moskowitz, comes from some thoughts in originating in the 1960’s, when influenced by Oettinger’s vision, and Kahneman’s through the latter’s research partner, the late Amos Tversky.

Acknowledgment

Attila Gere thanks the support of the Premium Postdoctoral Researcher Program of the Hungarian Academy of Sciences.

References

  1. Cooper RG (1979) the dimensions of industrial new product success and failure. Journal of marketing 43: 93–103.
  2. Cooper RG (1990) Stage-gate systems: a new tool for managing new products. Business horizons 33: 44–54.
  3. Cooper, Robert G (2016) Agile–Stage-Gate Hybrids: The Next Stage for Product Development Blending Agile and Stage-Gate methods can provide flexibility, speed, and improved communication in new-product development. Research-Technology Management 59: 21–29.
  4. Dora M, Van Goubergen D, Kumar M, Molnar A, Gellynck X (2014) Application of lean practices in small and medium-sized food enterprises. British Food Journal 116: 125–141.
  5. Herstatt C and Von Hippel E (1992) From experience: Developing new product concepts via the lead user method: A case study in a “low-tech” field. Journal of product innovation management 9: 213–221.
  6. Thomke S, Reinertsen D (1998) Agile product development: Managing development flexibility in uncertain environments. California management review 41: 8–30.
  7. Moskowitz HR (2012) ‘Mind genomics’: The experimental inductive science of the ordinary, and its application to aspects of food and feeding. Physiology & Behavior 107: 606–613.
  8. Moskowitz HR, Gofman A (2007) Selling blue elephants: How to make great products that people want before they even know they want them. Pearson Education.
  9. Moskowitz HR, Gofman A, Beckley J and Ashman H (2006) Founding a new science: Mind genomics. Journal of sensory studies 21: 266–307.
  10. Luce RD, Tukey, JW (1964) Simultaneous conjoint measurement: A new type of fundamental measurement. Journal of mathematical psychology 1: 1–27.
  11. Box GE, Hunter WG, Hunter JS (1978) Statistics for experimenters. New York, John Wiley.
  12. Green PE and Rao VR (1971) Conjoint measurement for quantifying judgmental data. Journal of marketing research 8: 355–363.
  13. Green PE, Srinivasan V (1990) Conjoint analysis in marketing: new developments with implications for research and practice. The journal of marketing 54: 3–19.
  14. Moskowitz HR, Gofman A, Itty B, Katz R, Manchaiah M, Ma Z (2001) Rapid, inexpensive, actionable concept generation and optimization: the use and promise of self-authoring conjoint analysis for the food service industry. Food Service Technology 1: 149–167.
  15. Gofman A, Moskowitz H (2010) Isomorphic permuted experimental designs and their application in conjoint analysis. Journal of Sensory Studies 25: 127–145.
  16. Moskowitz H, Gofman A, I novation Inc (2003) System and method for content optimization. U.S. Patent 6,662,215.
  17. Dubes R, Jain AK (1980) Clustering methodologies in exploratory data analysis. Advances in Computers, 19, 113–238.
  18. Wells WD ed., 2011. Life Style and Psychographics, Chapter 13: Life Style and Psychographics: Definitions, Uses, and Problems. Marketing Classics Press.
  19. Hanssens DM (2016) what is known about the long-term impact of advertising. In Accountable Marketing (pp. 120–137). Routledge.
  20. Rawlinson JG (2017) Creative thinking and brainstorming. Routledge.
  21. Kessler EH, Chakrabarti AK (1999) Speeding up the pace of new product development.” Journal of Product Innovation Management 16: 231–247.
  22. Lehtinen U, Torkko M (2005) The lean concept in the food industry: A case study of contract a manufacturer. Journal of Food Distribution Research 36: 57.
  23. Zarei M, Fakhrzad MB, Paghaleh MJ (2011) Food supply chain leanness using a developed QFD model. Journal of food engineering 102: 25–33.
  24. Kahneman D and Egan P (2011) Thinking fast and slow. New York: Farrar, Straus and Giroux.

Choosing a Hair Consultant: A Mind Genomics Exploration in the Realm of Beauty

Abstract

We present an approach to understanding how to create a consulting business for a personal service, in this case hair beauty. The approach uses experimentation, in the form of systematically varied ideas (Mind Genomics.) The strategyis to expose respondents to combinations of services, identify which particular ideas in the combination ‘drive’ positive reactions, and then focus on those ideas in communication. Rather than asking respondents, Mind Genomics works with combinations, presented rapidly, forcing the response to be intuitive, rather than considered. Mind Genomics reveals new-to-the-world groups of consumers, mind-sets, who respond to different messages in communications, and identifies individuals with these mind-sets through a PVI, personal viewpoint identifier.

Introduction

The business of beauty, ‘hope in a bottle’ as some have called it, continues to grow. The desire to be beautiful to others, seemingly built-in to our condition as human beings, continues to drive business growth as the economies of the world improve, these economies moving into the 21st century, and expanding beyond subsistence to better living, and even to living at the ‘high end,’. The rise of wealthy multi-national companies, specializing in the creation of personal ‘beauty’ in all forms, for all parts of the body, attests to ineradicable desire of people to look attractive.

Macro-economic studies of the growth of the beauty industry can go just so far, and no further. The expertise of marketing and market researchers, replete with their knowledge about the industry, the solution providers (e.g., salons, products) and the customers, provide a lot of information and indeed with the Internet a torrential, ever-increasing amount each day. Whether one reads the newspapers, listens in on social media, or works in salons and stores, one cannot escape the world of beauty, massive, dynamic, growing. The industry reports, the stock market, the newspaper and other sources of ads and promotions attest to the dynamism.

What then about the individual, however? We mean here the consumer who buys the beauty product or service. What can we learn about them, information beyond the conventional information of ‘who they are’, and ‘why they buy?’ We don’t mean the standard information available from trend studies, from so-called Big Data, or even from focus groups convened to learn how to sell a product or service. Rather, we mean here the mind of the individual, when dealing with a product in the world of beauty.

Sadly, in the world of science there is relatively little research devoted to the way people make ordinary decisions. There are, of course, studies of entire categories and verticals, but these studies tend to be cross-sectional, in the spirit of a macro-economic analysis, such as what are people in general thinking, what are people, in general, buying, and so forth. The science which emerges from these studies tends to be strongly driven by theory, by mathematical models, and replete with generalities about human behavior gleaned from the analysis. In contrast, there is very little science of ‘every day’ experience. We know that people experience daily life, and make decisions, one decision after another. But what can we learn about the structure of these decisions? Can we create a science of daily life, almost a science of the mind as the mind or the person confronts the very ordinary, quotidian situations, which make up day to day living?

There are, of course, academic studies, although far fewer than one might guess, especially in the world of beauty. Studies of beauty as they pertain to daily life tend not to be the topic of science, although when one searches hard enough, there are many papers, most about beauty in the culture rather than beauty and specifically hair as a topic of science, from the person’s point of view [1–5]. There is, of course, a literature on beauty from the point of view of science, although this information tends to be clinical, even though it deals with an emotionally important topic [6,7] The real and often riveting information about one’s experience with beauty, decision-making, and actions comes from the popular press, from news articles, and stories to interest lay readers, who find utterly fascinating these stories about beauty and its many facets [8–12].

Mind Genomics as an organizing principle

In the world of products, services, and marketing, professionals are realizing that it is increasingly impossible to make judgments about business tactics without the necessary evidence. In previous decades the beauty business as well as the perfume business were dominated by peoples who we would call ‘business titans’ when running a large corporation, or superb professionals when designing products, especially perfumes. The cosmetic industry was spared some of the cult of personality because it had to deal with product functionality as well as product image. Nonetheless, the cult of personality left a legacy of relatively little knowledge about the mind of the customer. Compared to the world of food, the world of cosmetics and beauty is lacking in depth knowledge of customers, and is still heir to some of the forces of charismatic personalities.

Author Moskowitz has developed a new approach to understanding the consumer, not so much based on conventional research such as focus groups, surveys, or tracking studies, as based on the world-view of experimental psychology. The approach is morphing into an emerging science called Mind Genomics, which is executed as a survey but in fact is an experiment to probe the mind of the customer[13–16].

A good analogy for Mind Genomics, elaborated below, is ‘the MRI of the mind.’ The intellectual history of Mind Genomics can be traced to the pioneering work of psychologists and statisticians [17], as expanded by Green and his associates at the Wharton School of Business, The University of Pennsylvania [18,19].

The fundamentals of Mind Genomics are simple, elaborated in the four steps below:

  1. EXPERIMENT: Approach the topic as an experiment, present test ideas (message) in combinations (vignettes), acquire ratings, and deconstruct the ratings to the contribution of the individual ideas. The statistics involved are subsumed under the rubric of experimental design [20].
  2. MIND-SETS: Identify different mind-sets, defined as arrays of ideas which focus on different aspects of the topic. The statistics involved are subsumed under the rubric of clustering, which places people or other objects into non-overlapping groups, based upon the pattern of features [21,22].
  3. ASSIGNMENT OF NEW PEOPLE TO MIND-SETS: Assign new people to a specific mind-set, based upon a short test. The approach is an algorithm developed by author Gere, and called the PVI, the personal viewpoint identifier
  4. SEND THE ‘RIGHT MESSAGE’ TO THE ‘RIGHT PERSON’ AT THE ‘RIGHT TIME.’ Present each person with the appropriate messages, defined as those messages which appeal to the mind-set [23].

Doing the Mind Genomics study

During the past 15 years the Mind Genomics protocol for research has become increasingly standardized in terms of the research choreography. The standardization enables the researcher to set up the study quickly, in a matter of hours, executed the study, and have results back in a matter of three-four hours, with the data analyzed. The rapid design, implementation, and analysis, has occurred because the Mind Genomics process has been ‘templated’. We present the research template here, a template that has been followed for many dozens of studies.

  1. Define the topic. For this study the topic is ‘what is important in one’s choice of a beauty hair consultant from the point of view of an ordinary individual?’ For the best results, the scope of the topic should be limited to a specific and well-defined topic, a topic which can be expressed in a single sentence. Most researchers need practice in order to define the topic in a succinct, operationally meaningful way, a way whose description can produce a word picture in the mind of an individual not familiar with the topic.
  2. Define a set of questions which tell a story. These questions (or silos) are never shown directly to the respondents in the Mind Genomics study. Rather, the questions are used to elicit answers (elements), these answers in turn shown to respondents in various combinations, as described below. It is worth noting that the most difficult part of the Mind Genomics study comes in this second step. Many researchers have a very hard time thinking in this structured, story-telling fashion. The discipline required to ask the series of related questions comes with practice, and in some ways the Mind Genomics process ‘re-wires’ the mind of the respondent. Table 1 presents the four questions, and the four answers for each question.
  3. Combine these answers into short, easy to read combinations, so that the respondent can quickly read and evaluate. Figure 1 (left panel) shows an example of a vignette as the respondent will see it, with the view being the smartphone. The same vignette can be configured for a tablet or a personal computer, as shown in Figure 1 (right panel.)

Table 1. The raw material for the Mind Genomics study, comprising four questions which ‘tell a story’ and four answers to each question. HBC = Hair Beauty Consultant

Question 1 –What does the HBC do?

A1

often works with hair which is falling out

A2

works with overly oily hair

A3

gives real professional advice

A4

works with people who are not able solve their hair problem

Question 2 – Why would you want THIS particular HBC

B1

hair consultant is known by friends

B2

hair consultant writes for social media

B3

beauty salons often recommend

B4

hair consultant gives courses for new hair professionals

Question 3 –What does the HBC deliver?

C1

thorough discussion after examination

C2

present alternative best 2 or 3 solutions

C3

present products and/or treatments for the client

C4

present products for the clients

Question 4 –How do the client and HBC interact

D1

client has long term relationship … personal project

D2

client has project and monthly visits

D3

client gets reduced salon prices as part of treatment

D4

weekly meetings on computer to SEE and DISCUSS progress

Mind Genomics-020 - Choosing A Hair Consultant A Mind Genomics Exploration in the Realm of Beauty - AWHC Journal_F1

Figure 1. Examples of a vignette, as it appears on the screen of a smartphone (left), and the same vignette as it appears on the screen of a tablet or personal computer (right)

The vignette shown in Figure 1 contains no connectives. Rather, the elements are placed on the page, left-justified, one element following another, the elements on separate lins Often, those who will use the research findings feel that it is impossible for the consumer respondent to rate the combination because the elements seem to have been thrown together haphazardly. Most of the experience of researchers working in the evaluation of combinations of ideas has been focused on getting the stimulus, the vignette, ‘just right,’ connectives and all, with the vignette appearing as a paragraph. That paragraph format, so rational and acceptable to many, becomes, in fact, quite onerous to read after the respondent has read and rated 3–4 of these paragraphs.

Mind Genomics works within a different world view, focusing on presenting messages as they are presented in the real world, unconnected, almost ‘thrown’ at the respondent. It is the job of the respondent to make a judgment as in real life. The structure is difficult to discern, so that in the end, most of the respondents simply ‘give up,’ and assign ratings according to their intuition, System 1 in the words of Nobel Laureate Daniel Kahneman [24].

Despite the apparent randomness of the combinations, nothing could be further from the truth. The reality is that the vignettes, the test combinations, are crafted through an underlying experimental design which prescribes the precise set of 24 combinations to make, so that each element appears equally often, all 16 elements appear in a statistically independent fashion, each vignette comprises 2–4 elements and at most one answer from each question (i.e, at most one element from each silo). A permutation scheme ensures that each respondent evaluates different combinations. That is, the combinations tested by one respondent are different from the combinations tested by any other respondent. The permutation scheme is discussed by Gofman&Moskowitz [25], based upon a patent [26].

Table 2 presents data from the first eight vignettes from a respondent, along with the preparation of the design and data for analysis by OLS (ordinary least-squares) regression. The respondent’s ID number is 7. The Mind Genomics system does not record WHO the respondent IS, but records the date of birth and the gender. Thus, it is possible to use age and gender as stratifying variables. The respondent in this study was also asked about the concern with their hair. Two of the four responses were either not concerned or only mildly concerned with their hair. Respondents choosing one of these two answers were put into the group stating that there was little or no concern. The remaining respondents chose answers reflecting modest or strong concern, and were put into the second group, who are concerned with their hair.

Table 2. Experimental design underlying the vignettes

Panelist

7

Gender

Female

Age

65

Hair Conc

Yes

Mind Set#

3

Vig1

Vig2

Vig3

Vig4

Vig5

Vig6

Vig7

Vig8

Design

Question A

3

4

4

4

2

0

1

3

Question B

0

2

3

4

2

2

3

4

Question C

3

4

1

2

0

0

2

1

Question D

2

4

2

0

3

1

1

1

Binary Recode

A1

0

0

0

0

0

0

1

0

A2

0

0

0

0

1

0

0

0

A3

1

0

0

0

0

0

0

1

A4

0

1

1

1

0

0

0

0

B1

0

0

0

0

0

0

0

0

B2

0

1

0

0

1

1

0

0

B3

0

0

1

0

0

0

1

0

B4

0

0

0

1

0

0

0

1

C1

0

0

1

0

0

0

0

1

C2

0

0

0

1

0

0

1

0

C3

1

0

0

0

0

0

0

0

C4

0

1

0

0

0

0

0

0

D1

0

0

0

0

0

1

1

1

D2

1

0

1

0

0

0

0

0

D3

0

0

0

0

1

0

0

0

D4

0

1

0

0

0

0

0

0

Response Data

Rating

7

6

6

6

6

5

7

6

Top 3 (6–9 → 100; rest → 0)

100

0

0

0

0

0

100

0

Bot 3 (1–3 → 100; rest → 0)

0

0

0

0

0

0

0

0

Response Time (Seconds)

5.4

7.2

9

6.2

3.9

6.8

8.6

5.9

The basic information we have about the respondent is that she is a 65-year-old female who states that she is concerned with her hair. Furthermore, as we will see later in the paper, the respondent falls into Mind-Set #3, based upon the pattern of her responses. The assignment of respondents to one of a set of complementary, mutually-exclusive and exhaustive mind-sets for this particular topic of hair care consulting provides yet a fourth way to define WHO the respondent is, this time based upon how the respondent thinks about hair beauty consultants.

Below the respondent specifications are listed the identification code for the test elements which appeared in vignettes 1–8, respectively. Each vignette has at most one element from each silo, or one answer from each question, but in reality there are vignettes entirely lackingan answer to one question (e.g., vignette 1 lacks an answer to Question B), and vignettes entirely lacking an answer to two questions (e.g., vignette 6 lacks an answer to both Question A and Question C, respectively.) Respondents have no problem evaluating vignettes which are incomplete, since respondents ‘graze’ for information, rather than slavishly read the vignette word by word.

As the experimental design is laid out, most computer programs have a difficult time analyzing the data. The experimental design is not intrinsically numeric, but rather descriptive. It is important to transform the data to a form that the statistics program can use. One very straightforward way to prepare the data for analysis recodes the experimental design to 0’s (when an element is absent from a vignette), or 1’s (when an element is present.)

Table 2 further shows the recoding of the design from four rows to 16 rows. Each row corresponds to one of the 16 elements. There are 16 rows, labelled A1 to D4, to represent each of the 16 answers or elements in a vignette. Each column, in turn, corresponds to one of the eight vignettes. The cells show the coding of a specific vignette and a specific element. When the cell has a ‘1’, the vignette contains that element. When the cell has a ‘0,’ the vignette lacks that element. Looking down at the composition of one vignette, we see at most four ‘1’s and the rest ‘0’s, which tells the computer program and the researcher that the vignette has no more than four elements, and tells the program which specific four (or three or two) elements are present in the vignette.

Below the binary recording are the response data, comprising the actual rating (1–9), the binary transform for positive responses (7–9 → 100, 1–6 → 0), the binary transform for negative responses (1–3 → 100; 4–9 → 0), and the response time in sections. The binary transform is used in the spirit of consumer research, which continues to present data to the end-user as binary, NO vs YES. The specific division of the 9-point scale into the two asymmetric halves, 1–6 versus 7–9 was done following the standard research protocol used in Mind Genomics studies since the late 1980’s, 30+ years ago.

The arrangement of the data in the form shown in Table 2 allows the computer program to process the data in a numeric form, creating a ‘model’ or equation. The model or equation shows how the presence/absence of the elements in a vignette ‘drive’ the response. The creation of these models, the interpretation of their meaning, and the application of the results to practical issues will be the topic of the rest of this paper.

Results

How do individual respondents rate the vignettes?

Each respondent rated 24 different vignettes. We have two transformation or recodings of the same data, a positive recoding for liking, and a negative recoding for disliking. The transformation of the vignettes tells us whether, for the particular vignette the respondent ‘likes’ the vignette (positive recoding: ratings 7–9 → 100), whether the respondent dislikes the vignette (negative recoding: ratings 1–3 → 100) or whether respondent is indifferent (neither like nor dislike).

The average transformed rating for each respondent shows the proportions of positive versus negative average responses. A respondent who liked every one of the 24 vignettes would have a value of 100 across the 24 vignettes for the transformation of ‘like’. That respondent would have all 0’s for the recoding for dislike. Thus the average of the positive recodes for an individual tells us the degree to which the individual ‘likes’ everything. The average of the negative recodes for the same individual tells us the degree to which the individual ‘dislike’ everything.

When we plot the average likes (abscissa, X axis) versus the average dislikes (ordinate, Y axis), with one point for each respondent,
Figure 2 shows us that most of the respondents cluster either at the bottom of the graph (like most of the vignettes, dislike none or a few), or cluster at the left side of the graph (*dislike most of the vignettes, like none or a few). Respondents are polarized. They either like or dislike what they read. There are only a few respondents who show indifferent responses. These would be in the middle of the graph.

Mind Genomics-020 - Choosing A Hair Consultant A Mind Genomics Exploration in the Realm of Beauty - AWHC Journal_F2

Figure 2. Scatterplot, showing the distribution of positive and negative averages regarding the rating of the 24 vignettes, after the binary transform. Each letter corresponds to a respondent. Y = respondent says concerned with hair; N = respondent says not concerned with hair.

When we classify the respondents by their self-stated concern with hair, we can represent them by N (not interested) or Y (interested). Figure 2 suggests that those who say that they are concerned with their hair tend to be more positive, on average, and those who say that they are not concerned with their hair tend to be more negative, both with respect to rating the vignettes.

Creating a model by OLS, ordinary least-square regression

The essence of Mind Genomics is to understand the specific ‘drivers’ of responses, which in our case becomes the specific messages driving a respondent to say: ‘I am interested in a beauty consultant.’ The rating scale conveys that interest, doing so for the different vignettes that were created. The notion of exposing respondents to different combinations comes from the world of human experience, where the most typical situation confronting a person is a set of features or items in an environment, and the reaction of the person to that combination. It is often impossible for a person to identify the particular features of the combination confronting the person responsible for the subsequent action taken by the person.

When the researcher combines the different elements or messages into a combination using experimental, the above-mentioned vignette, the issue identifying the ‘driving’ element is made simpler. Various statistical techniques falling into the general statistical system called ‘regression’ relate the independent variables, those features driving the response, to the dependent variable, the nature of the response itself. There is simply a need to ensure that the predictor variables of interest are ‘statistically independent,’ and not strongly linked with each other. Regression disentangles the response to the mixture into the contributions of the components of the mixtures, in our cases the messages

We use OLS (ordinary least-squares) regression to relate the presence/absence of the 16 elements to the rating, in our case defined as the 0/100 after binary transformation. Table 2 showed us the way the data are formatted. We know the combination, and we measure the response. For then regression analysis whose results are shown in Table 3, we combined the data from all respondents who are members of the class, ‘class’ or ‘group’ defined as total, as gender, as age, or as self-defined concern with one’s hair.

Table 3. Performance of the elements by total panel and key self-defined subgroups

Coefficients of the model relating the presence/absence of elements to ‘Interested’ (Top2 (4 and 5 on 5-point scale of interested))

Total

Male

Female

Age 18–29x

Age 30–49x

Age 50+x

Concern YES

Concern NO

Base size

Additive constant

25

21

28

-19

25

50

17

39

B2

hair consultant writes for social media

6

10

2

15

4

5

0

16

B4

hair consultant gives courses for new hair professionals

3

4

1

6

-1

8

-2

10

D1

client has long term relationship … personal project

3

0

7

12

1

1

3

3

A2

works with overly oily hair

2

-3

8

5

-2

9

6

-4

D4

weekly meetings on computer to SEE and DISCUSS progress

1

-5

7

12

-1

-2

1

-1

D2

client has project and monthly visits

1

0

2

9

2

-3

3

-3

C2

present alternative best 2 or 3 solutions

0

3

-3

22

-3

-2

-3

6

C3

present products and/or treatments for the client

0

4

-4

13

-5

2

-3

5

B1

hair consultant is known by friends

0

-1

2

7

-4

3

-3

4

A1

often works with hair which is falling out

0

-3

3

2

-1

1

5

-6

C1

thorough discussion after examination

-1

-2

-1

22

-5

-5

1

-3

B3

beauty salons often recommend

-2

-1

-2

11

-4

-3

-5

3

C4

present products for the clients

-2

0

-5

13

-6

-4

-4

2

D3

client gets reduced salon prices as part of treatment

-2

-3

1

9

-4

0

-2

-1

A3

gives real professional advice

-3

-4

-2

6

-5

-4

-2

-4

A4

works with people who are not able solve their hair problem

-3

-5

0

7

-7

-1

-1

-6

Table 3 shows the key information emerging from the regression analyses. We interpret the data in the following way:

  1. The additive constant. This value is the estimated percent of responses to the vignette that would be 100 (viz., originally 4–5) in the absence of elements. The reader will at once realize that all vignettes comprised as many as four elements, as few as two elements, and never one or no elements, respectively. Thus, the additive constant is a baseline value, purely an estimated parameter.
  2. The additive constant can be interpreted as a baseline of acceptance, when we look at the binary transformed data. It is the estimated percent of responses that would be 4–5 on a 5-point scale in the absence of elements. When our goal is to achieve a high total score, beginning with a high additive constant means that the basic feeling towards the product or the service is strong, and the element do not have to do much work. With a low additive constant, the opposite is the case, and the elements must do ‘all the work.’ The additive constant need not be a positive number. The mathematics behind the additive constant and the individual element-linked coefficients, regression analysis, does not set limits on the additive constant
  3. The additive constants range dramatically, from a high of 50 for respondents ages 50+ (older respondents are basically interested in a hair consultant), to a low of -19, virtually 0 for respondents ages 18–29 (younger respondents are basically uninterested in a hair consultant.)
  4. Surprisingly, those who say that they are concerned about their hair are less interested in the hair beauty consultant (additive constant = 17), versus those who say that they not concerned about their hair (additive constant = 39).
  5. The data suggest that it will be the elements which make the difference.
  6. To make reading the data easier, we have shaded all elements which achieve a coefficient of 8 or higher in any subgroup. Studies using Mind Genomics suggest that the statistical value significance is around 8 or so, using the principles of inferential statistics. Observations by author Moskowitz using these data in many studies further suggest that when the coefficient is 8 or higher, the element performs well in other applications, such as advertising.
  7. The total panel shows no elements which drive interest. Although this finding may be disconcerting to many, since research is presumed to show opportunities, the reality is that most of the messages studied by Mind Genomics simply do not persuade, do not drive people to try the product, use the service. Even though a message may have been used for years does not make the message by definition ‘sacred,’ and an accepted part of one’s marketing and sales portfolio.
  8. Dividing respondents by ender shows similar additive constants, but only one strong element, that element appealing to males: B2 – hair consultant writes for social media
  9. Dividing respondents by age shows an exceptional number of messages appealing to the younger respondent, age 18–29

present alternative best 2 or 3 solutions
thorough discussion after examination
hair consultant writes for social media
present products and/or treatments for the client
present products for the clients
client has long term relationship … personal project
weekly meetings on computer to SEE and DISCUSS progress
beauty salons often recommend
client has project and monthly visits
client gets reduced salon prices as part of treatment

The older respondents (age 50+) show only two very strong elements
works with overly oily hair
hair consultant gives courses for new hair professionals

Those who say that they are not concerned with their hair
hair consultant writes for social media
hair consultant gives courses for new hair professionals

Difference mind-sets searching for hair care

The premise of Mind Genomics is that in any topic area where human decisions are made on the basis of exterior information, there exist different groups of ideas which ‘travel together.’ These ideas are called mind-sets. They are embodied in an individual who is said to ‘hold’ a specific mind-set, but they are not the individual. They are cohesive sets of ideas. We only discover these ideas, however, through experimentation. We need people to help us reveal these mind-sets.

The mind-sets are discovered by a simple statistical method called ‘clustering,’ which puts together different things (e.g. ideas) based upon the similarity of their patterns. Clustering does not necessarily reveal fundamental, basic ideas, although it may. Rather, clustering is a heuristic, designed to create smaller, non-overlapping groups from a large, perhaps inchoate group of items a group without seeming commonalities.

Clustering comes in many variations. With each variation of the clustering method emerges a different set of clusters, or in our case, mind-sets. The fact that there is not a perfect set of fundamental groups should not be a cause for upset. All clustering attempts to do is to find approximately different groups, so that these groups can be treated in a more appropriate way for themselves. Rather than assuming all people to be identical in what they want, or to assume that each person is totally unique, making personalization almost unachievable, clustering finds approximations to different grounds, which can be then studied separately to see the messages to which they respond.

Mind-set segmentation in Mind Genomics enjoys the benefit of segmenting a population on the basis of the precise words that will be used to send them offers. That is, instead of segmenting or clustering the population on the basis of some factors which clearly divide them, and then looking for the messages appropriate for each segment, Mind Genomics segments the people on the messages that are relevant to the topic. The segmentation is more crystallized by Mind Genomics because the segments are created on precisely the topic which is being explored.

The mechanics of clustering for these data follow the now-standard process for Mind Genomics studies. We begin by computing a ‘distance’ between every pair of respondents, that distance computed by a simple formula: D = (1 – Pearson Correlation). The Pearson Correlation coefficient tells us the degree of linear relation between two variables. When two variables are perfectly related to each other in a positive sense, the Pearson Correlation is +1 so the variable D becomes 0. This makes intuitive sense. The two variables behave identically. When two variables are perfectly correlated, but moving in opposite directions, the Pearson Correlation is –1, so the variable D becomes 2.

The clustering algorithm works with these distances, to put the different respondents into either two or three non-overlapping clusters or mind-sets. The process attempts to make the set of distances D values, have as great a value for the distances between clusters or mind-sets, and at the same time have a small value for the distances between members within a cluster.

Table 4 shows the coefficients for the total panel, for the two complementary Mind-Sets when we extract two clusters, and the three complementary Mind-Sets when we extract three clusters. We do not know which group of Mind-Sets to choose. Thus far, the process has been strictly mathematical, working with the values of the abovementioned variable ‘D’ or distance between upon the Pearson Correlation.

Table 4. Performance of the elements by total panel, two emergent mind-sets and three emergent mind-sets.


Total

Mind-Set 2A

Mind-Set 2B

Mind-Set 3C

Mind-Set 3D

Mind-Set 3E


Additive constant

25

15

35

27

33

15

Mind-Set C1 – Not really interested in anything, not a prospect for a hair beauty consultant

Mind-Set C2 – Want a hair consultant who is clearly an expert, and ‘knows’ people and products

B2

hair consultant writes for social media

6

2

10

3

11

3

C3

present products and/or treatments for the client

0

-1

1

-5

7

-6

B4

hair consultant gives courses for new hair professionals

3

0

6

-1

6

3

Mind-Set C3 – Want a hair beauty consult who is involved in a long-term relation with client

D1

client has long term relationship … personal project

3

6

0

-1

-2

11

A2

works with overly oily hair

2

6

-2

-7

2

10

D4

weekly meetings on computer to SEE and DISCUSS progress

1

6

-5

-6

-4

10

D2

client has project and monthly visits

1

4

-3

0

-2

6

B1

hair consultant is known by friends

0

-1

1

-3

0

3

A1

often works with hair which is falling out

0

5

-4

4

-5

3

D3

client gets reduced salon prices as part of treatment

-2

0

-3

-3

-5

3

C1

thorough discussion after examination

-1

5

-7

-2

-3

1

C2

present alternative best 2 or 3 solutions

0

1

0

-1

3

-2

B3

beauty salons often recommend

-2

-2

-2

-1

-1

-2

A4

works with people who are not able solve their hair problem

-3

-1

-3

-6

1

-3

A3

gives real professional advice

-3

-2

-3

-7

0

-3

C4

present products for the clients

-2

0

-4

-5

1

-4

We employ two criteria to add judgment to the process:

  1. Parsimony. When clustering, the better solution should be the smaller solution, but still one that can be interpreted immediately, because it makes sense. In our study we have extracted both two and three Mind-Sets. We do not know which of these two we will select. Both are parsimonious.
  2. Interpretability. The clusters or Mind-Sets should ‘tell a story,’ and an obvious one. When we look at Table 4, we see that there are few strong performing elements when we extract two Mind-Sets by clustering. In contrast, when we extract three Mind-Sets, we find three interpretable groups:

Mind-Set C1 – Not really interested in anything, not a prospect for a hair beauty consultant

Mind-Set C2 – Want a hair consultant who is clearly an expert, and ‘knows’ people and products

Mind-Set C3 – Want a hair beauty consult who is involved in a long-term relation with client

Finding these respondents in the population

How one finds these Mind-Sets in the population has challenged researchers for a number of years, ever since the issue of applying the data to commercial and social uses has arisen. Decades ago, the market researcher William Wells introduced the idea of psychographic segmentation [23], suggesting that people could be divided by their minds and values. This led to lifestyle segmentation, based upon the way a person lives, and afterwards to behavioral segmentation, especially when shopping on the web. All of these segmentations work, dividing the people, but not identifying what to say for the specific situations of one’s life, the daily micro-worlds in which we live. Mind Genomics does so, but faces the same problem as all other segmentations based upon how people think.

An analysis of who the respondents are by age, gender, and interest in caring for one’s hair suggests that these Mind-Sets are spread through the population in a way that cannot be predicted easily from knowing WHO the respondent is, or CONCERN that the respondent has about her or his hair. Thus, we are left with a powerful finding about the mind of the prospective client for hair beauty consulting, yet the frustration of knowing that although these prospects exist, they cannot easily be identified. In fact, they not even know that they are prospective clients.

Author Gere has developed the PVI, the personal viewpoint identifier, which allows a respondent to answer six questions based upon the 16 answers shown in Table 1. Figure 3 shows the six questions, and the two possible answers from each question. The pattern of answers from a single is used in conjunction with the table of coefficients (Table 4). There are 64 possible patterns of responses, when the question has two possible answers. The 64 patterns are mapped to membership in one of the three Mind-Sets. Once the person has completed the PVI, in 30 seconds or faster, the person’s mind-set can be discovered, least with less guessing than before. Figure 4 shows the feedback for each mind-set. This feedback can either be given to the respondent and/or stored by the researcher/consultant for future efforts with this particular individual. The actual link to the PVI for this study as of this writing (June, 2019) can be found at: http: //162.243.165.37: 3838/TT33/

Mind Genomics-020 - Choosing A Hair Consultant A Mind Genomics Exploration in the Realm of Beauty - AWHC Journal_F3

Figure 3. The PVI for the Hair Beauty Consultant

Mind Genomics-020 - Choosing A Hair Consultant A Mind Genomics Exploration in the Realm of Beauty - AWHC Journal_F4

Figure 4. The feedback from the VPI. Each mind-set has its own feedback, sent either to the beauty consultant and/or the client.

Beyond what interests to what engages – Response time

The foregoing sections reveal the dramatic differences among respondents in the degree to which specific messaging appeals to them. Another dimension of important is engagement, the degree to which a specific message engages attention by being read.

The Mind Genomics system measures the response time for each vignette, doing so to the nearest tenth of a second. Since the experiment is conducted on the Web, without any supervision, occasionally (about 10% of the time) the response time is exceedingly long, last 10 seconds or longer, a time that other studies have shown to be exceptionally long. For all response times exceeding 9.0 seconds, we truncated the response time to 9.0 seconds.

Figure 5 shows the average response times across the 24 vignettes for each respondent. The respondent either one who defines herself/himself as concerned about hair (Y) or not concerned about hair (N). Our ingoing hypothesis was that those respondents who say that they are concerned about hair would spend, on average a longer time reading the vignette. We reject the hypothesis. The response times are similarly distributed, so any difference in average across all respondents would be minor at best.

Mind Genomics-020 - Choosing A Hair Consultant A Mind Genomics Exploration in the Realm of Beauty - AWHC Journal_F5

Figure 5. Average response times across the 24 vignettes. Each letter corresponds to a respondent, who self-defines as either concerned about their hair (Y) or not concerned about their hair (N).

The degree to which the individual elements can engage may also be estimated using regression analysis. The ingoing experimental design is known for each respondent, as is the response time in seconds. We can create a simple model relating the presence/absence of the 16 elements to the response time. The model is written without an additive constant, under the assumption that in the absence of elements the response time would be 0 seconds. The equation is expressed asResponse Time = k1(A1) + k2(A2) … K16(D4)

Table 5 shows the coefficients for the response time models. The models were estimated from all the data relevant for the key subgroup. That is, the only data used to estimate the model for males are the data from males. Similarly, the only data used to estimate the model for Mind-Set 3E are respondents in Mind-Set 3E.

Table 5. Engagement – The estimated response times attributed to each message or element.


Total

Male

Female

Age 16 to 29

Age 30 to 49

Age 50 Plus

Concern YES

Concern NO

Mind-Set 3C Not Interested

Mind-Set 3D An expert

Mind-Set 3E Personally involved

C2

present alternative best 2 or 3 solutions

1.3

1.3

1.2

-0.1

1.5

1.6

1.5

0.8

1.0

1.6

1.2

D3

client gets reduced salon prices as part of treatment

1.2

1.1

1.4

0.9

0.8

2.1

0.9

1.6

1.0

1.4

1.2

B4

hair consultant gives courses for new hair professionals

1.1

0.8

1.5

1.3

0.9

1.5

1.2

1.1

1.3

0.7

1.4

D4

weekly meetings on computer to SEE and DISCUSS progress

1.1

1.2

1.1

0.6

0.8

2.1

1.1

1.0

1.1

1.3

1.1

A4

works with people who are not able solve their hair problem

1.1

0.9

1.3

-0.1

1.2

1.8

0.9

1.5

1.2

0.9

1.1

C1

thorough discussion after examination

1.1

0.5

1.6

0.1

0.8

2.2

1.1

0.9

1.0

1.1

1.1

B3

beauty salons often recommend

1.1

1.1

1.0

1.6

0.9

1.1

1.0

1.2

0.6

1.3

1.1

B2

hair consultant writes for social media

1.0

1.0

1.2

0.7

0.9

1.5

1.2

0.9

0.9

0.8

1.4

B1

hair consultant is known by friends

1.0

1.0

1.1

0.7

1.0

1.5

1.2

0.8

0.6

0.9

1.4

C3

present products and/or treatments for the client

1.0

1.1

0.9

-0.4

1.1

1.7

1.0

1.1

1.2

1.1

0.8

C4

present products for the clients

1.0

1.0

0.9

0.3

1.2

1.0

1.0

1.0

1.1

0.7

1.2

D2

client has project and monthly visits

0.9

0.9

0.9

0.6

0.5

1.7

0.7

1.2

0.5

0.9

1.2

D1

client has long term relationship – personal project

0.8

0.8

1.0

0.1

0.6

1.6

0.7

1.0

0.8

0.8

0.9

A3

gives real professional advice

0.6

0.6

0.6

-0.1

0.4

1.1

0.4

0.9

0.4

0.6

0.6

A1

often works with hair which is falling out

0.4

0.3

0.6

-0.1

0.4

0.6

0.1

1.0

0.3

0.5

0.5

A2

works with overly oily hair

0.3

0.4

0.1

0.3

0.2

0.4

-0.1

1.0

0.1

0.6

0.0

Table 5 suggests some two simple rules of thumb:

Rule 1 – To engage (although not necessarily to persuade) talk about the process, painting a word-picture of what the client gets as an individual

present alternative best 2 or 3 solutions
client gets reduced salon prices as part of treatment
hair consultant gives courses for new hair professionals

Rule 2 – To not engage, be general, and talk about the problem being solved

gives real professional advice
often works with hair which is falling out
works with overly oily hair

Discussion

The results of this study give a sense of the complexities of daily life. Rather than attempting to introduce a new ‘theory’ of consumer behavior (top down thinking) using a mundane issue such as choosing a hair beauty consultant to confirm or falsify the tenets of such a ‘theory,’ Mind Genomics moves in an orthogonal direction, to ‘map’ the mind. There is no theory, for which the topic of beauty consultant can affirm or falsify. Rather, there is the important effort to be a ‘cartographer’ of the mind, to understand the nature of what confronts people in the every-day, and then construct a science of this ‘ordinariness.’ As these data suggest, the ‘ordinary’ is quite far from simple. There are different mind-sets to be uncovered, different messages which engage versus which are skipped over, and so forth. Indeed, the every-day is far from mundane, but rather presents an entirely new world for science to explore, a world where the discipline of science can fruitfully inform the daily rhythm of life.

Three directions using these results

Our efforts to understand the mind of the consumer when choosing a hair beauty consultant move us in three different directions.

  1. The decision criteria of everyday. The study revealed two major segments with diverse interests. One is interested in the topic, in the expertise, and probably in the facts. The other is interested in a personal relation. We might move beyond the specifics of hair care consulting, and ask whether this type of division, expertise-respecting vs relationship-seeking, characterize other types of subjects, beyond hair care. Could the experiment with Mind Genomics have uncovered a general division of the mind? And, following the proposition that there are these two main mind-sets, does a person ALWAYS fall into one mind-set or the other, or is the membership labile, a function of the topic, and who the person IS at the moment of the study.
  2. Applying science for practical benefit. In many disciplines, the mere thought that the data could be used for practical decision-making means that the data are not appropriate for science. Mind Genomics in general, and the results from this study in particular, enable the user to conduct business and daily life in a more efficient manner. Knowing what specific messages to give to a person based upon the person’s mind-set, AND having a way to assign a person to a mind-set, are extremely important for today’s world, for commerce. Increasingly, people are feeling that they don’t want commercial organizations to ‘track their behavior,’ because they feel that such tracking violates the ingredient. Indeed, recent developments in privacy have led to the adoption of a major privacy initiative [27], designed to avoid gathering and using too much data about a person. Fortunately, the only information one needs of a private nature comes from the momentary interaction of a person (identity masked) and the attitudinal questions from the PVI. That data need not even be stored, but simply used at the instant of transaction in order to give a sense of the mind of the prospect to a company
  3. Creating a data warehouse for knowledge of beauty. The metaphor of Mind Genomics is that for each aspect of experience there are different ways to respond to that aspects, different features about the aspect, and of course, different messages. The objective of a Mind Genomics study is to ‘map’ these ways, to reveal the science of every-day. In recent years author Moskowitz and colleagues have suggested that another opportunity may be to create large-scale databases, of many studies within the same topic, here beauty. The studies are straightforward to design and to execute. The world of beauty itself may comprise dozens of different topics, each of which generates its own Mind Genomics study, and in turn each Mind Genomics study uncovers the mind-sets, and is finished off by the PVI, personal viewpoint identifier, for that topic. What might be the arc of knowledge if instead of one PVI completed by a person, 20 or more PVI’s were to be completed, for the wide arc of beauty. Each person would, in fact, generate a vector of some 20 different mind-sets to which a person might belong, based on the patterns of the individual’s separate PVI’s. Such a vector of PVI’s could form the basis of a deep understanding of the mind of people in a life-relevant area (beauty), with the membership patterns of hundreds of thousands of individuals established through a set of PVI’s correlated with biological factors, social factors, and one’s own intellectual/personality factors. Such is the promise of a Mind Genomics, the science of the everyday, with a simple demonstration here in this paper for a simple, but relevant topic to daily life, one’s hair.

Acknowledgment

Attila Gere thanks the support of the Premium Postdoctoral Researcher Program of the Hungarian Academy of Sciences.

References

  1. Chrisler JC (2007) Body image issues of women over 50. In Women Over 50: 6–25. Springer, Boston, MA.
  2. Chrisler JC and Ghiz L (1993) Body image issues of older women. Women & Therapy 14: 67–75.
  3. Gillen MM and Dunaev J (2017) Body appreciation, interest in cosmetic enhancements, and need for uniqueness among US college students. Body image 22: 136–143.
  4. Kasardo, Ashley E, Maureen C. McHugh (2015) “From fat shaming to size acceptance: Challenging the medical management of fat women.” The wrong prescription for women: How medicine and media create a “need” for treatments, drugs, and surgery, 179–201.
  5. Rhode DL ( 2009) The Injustice of Appearance. Stanford Law Review 1033–1101.
  6. Saltzberg E, Chrisler J, Disch E (2006) Beauty is the beast: Psychological effects of the pursuit of the perfect female body. Moral Issues in Global Perspective: Volume 2: Human Diversity and Equality 2: 142.
  7. Trüeb RM, Tobin D. eds. (2010) Aging hair. Springer Science & Business Media.
  8. Gillespie CH (2013) Down to the roots: A qualitative analysis of the psychological impacts of messages black women receive regarding their hair. Southern Illinois University at Carbondale.
  9. Linnan LA, Ferguson YO (2007) Beauty salons: a promising health promotion setting for reaching and promoting health among African American women. Health Education & Behavior 34: 517–530.
  10. Xu G, Feiner S (2007) Meinü Jingji/ China’s beauty economy: Buying looks, shifting value, and changing place. Feminist Economics 13: 307–323.
  11. Yan Y, Bissell K (2014) The globalization of beauty: How is ideal beauty influenced by globally published fashion and beauty magazines?. Journal of Intercultural Communication Research 43: 194–214.
  12. Yang J (2011) Nennu and shunu: Gender, body politics, and the beauty economy in China. Signs: Journal of Women in Culture and Society 36: 333–357.
  13. Moskowitz HR, Gofman A, Itty B, Katz R, Manchaiah M et al (2001) Rapid, inexpensive, actionable concept generation and optimization: the use and promise of self-authoring conjoint analysis for the food service industry. Food Service Technology 1: 149–167.
  14. Moskowitz HR (2012) ‘Mind genomics’: The experimental inductive science of the ordinary, and its application to aspects of food and feeding. Physiology & Behavior 107: 606–613.
  15. Moskowitz HR, Gofman A, Beckley J, Ashman H (2006) Founding a new science: Mind genomics. Journal of sensory studies 21: 266–307.
  16. Moskowitz HR, Gofman A, (2007) Selling blue elephants: How to make great products that people want before they even know they want them. Pearson Education.
  17. Luce RD, Tukey JW (1964) Simultaneous conjoint measurement: A new type of fundamental measurement. Journal of mathematical psychology 1: 1–27.
  18. Green PE, Rao VR (1971) Conjoint measurement for quantifying judgmental data. Journal of marketing research 8: 355–363.
  19. Green PE, Srinivasan V (1990) Conjoint analysis in marketing: new developments with implications for research and practice. The journal of marketing 54: 3–19.
  20. Box GE, Hunter WG, Hunter JS (1978) Statistics for experimenters, New York, John Wiley
  21. Dubes R, Jain AK (1980) Clustering methodologies in exploratory data analysis. Advances in Computers 19: 113–238.
  22. Zemel R, Gere A, Papajorgji P, Zemel G, Moskowitz H (2018) Uncovering consumer mindsets regarding raw beverages. In Food and Nutrition Sciences 9: 259–267.
  23. Wells WD ed. (2011) Life Style and Psychographics, Chapter 13: Life Style and Psychographics: Definitions, Uses, and Problems. Marketing Classics Press.
  24. Kahneman D, Egan P (2011) Thinking, fast and slow. New York: Farrar, Straus and Giroux.
  25. Gofman A, Moskowitz H (2010) Isomorphic permuted experimental designs and their application in conjoint analysis. Journal of Sensory Studies 25: 127–145.
  26. Moskowitz H, Gofman A, I novation Inc (2003) System and method for content optimization. U.S. Patent 6: 215,662.
  27. GDPR (General Data Protection Regulation), 2018, Wikipedia: https://en.wikipedia.org/wiki/General_Data_Protection_Regulation
  28. Moskowitz HR (2014) 14 Mind genomics→ and texture: the experimental science of everyday life. In” Food Texture Design and Optimization (Dar, Y.L. and Light, J.M. eds.,) John Wiley.
  29. Moskowitz HR, Porretta, Sebastiano, Silcher, Matthias (2005) Concept Research in Food Product Design and Development. Hoboken, New Jersey: Wiley-Blackwell Publishing. 612pp
  30. Van Kleef E, Van Trijp HC, Luning P (2005) Consumer research in the early stages of new product development: a critical review of methods and techniques. Food quality and preference 16: 181–201.

Microarray Testing For Symmetrical Intrauterine Growth Retardation

Abstract

Background: Intrauterine growth restriction (IUGR) is the most common risk factor associated with perinatal mortality after excluding congenital anomalies 1. IUGR refers to a fetus that has failed to achieve its genetically determined growth potential and affects up to 7–10% of pregnancies 2. Fetal growth restriction is associated with an increase in perinatal mortality and morbidity. This is because of a high incidence of intrauterine fetal demise, intrapartum fetal morbidity, and operative deliveries. Neonates affected by IUGR suffer from respiratory difficulties, polycythemia, hypoglycemia, intraventricular hemorrhage, and hypothermia 3,4,5.

Objective: 1. Primary objectives: to evaluate the results of Microarray in symmetrical IUGR babies. 2.Secondary objectives: to compare between microarray positive babies and negative babies regarding: gestation age, weight, Apgar score, need and indications for NICU admission as well as length of NICU of stay.

Result: Between Jan 2016 and December 2017 total 10,695 babis were born. Among that 578 babis were IUGR (501 asymmetric and 77 symmetric IUGR). Total 71 babies were taken in our analysis after excluding 3 down syndrome and 3 babies part of multiple pregnancy. Microarray test had positive findings in 14/71 (19.7%). There were copy number changes of unknown significance in 8/71 (11.2%)

Conclusion: Most of the microarray test results were copy number changes of unknown significane which is comparitvely much higher than reported prevalence. Microarray positive IUGR had comparable NICU admissions to negative result group but their duration of stay, initial lower apgar scores and thrombocytopenia was significantly higher. This may be because, even copy number changes has unknown significane, they may have some clinical effect which is not known till now and may need further studies and long term follow up for those cases.

Keywords

Intrauterine growth restriction (IUGR), Chromosomal microarray analysis (CMA), Neonatal intensive care unit (NICU)

Abbreviations and Acronyms: Intrauterine growth restriction (IUGR), Chromosomal microarray analysis (CMA), Copy-number variants (CNVs), Toxoplasmosis, rubella, cytomegalovirus, rubella (TORCH), Neonatal intensive care unit (NICU), variant of uncertain significance (VUS).

Introduction

Intrauterine growth restriction (IUGR) is the most common risk factor associated with perinatal mortality after excluding congenital anomalies [1]. IUGR refers to a fetus that has failed to achieve its genetically determined growth potential and affects up to 7–10% of pregnancies [2]. Fetal growth restriction is associated with an increase in perinatal mortality and morbidity. This is because of a high incidence of intrauterine fetal demise, intrapartum fetal morbidity, and operative deliveries. Neonates affected by IUGR suffer from respiratory difficulties, polycythemia, hypoglycemia, intraventricular hemorrhage, and hypothermia [3–5].

Intrauterine growth restriction (IUGR) can be either symmetric or asymmetric. Symmetric IUGR is characterized by a similar and proportionate reduction in all auxological parameters, including weight, length, and cranial and abdominal circumference. Early gestational growth retardation would be expected to affect the fetus in a symmetric manner, and thus may have permanent neurologic consequences for the infant. Causes include chromosomal disorders, including trisomy 13, 21 and 18 and some rare genetic syndromes, such as Cornelia de Lange and Silver Russell syndromes and early congenital infections (rubella, cytomegalovirus, rubella, toxoplasmosis) [6]. Early-onset forms of IUGR represent more severe conditions and more links with perinatal mortalities [7].

Asymmetric IUGR is characterized by a greater reduction in body weight, when compared to the length and more commonly due to extrinsic influences that affect the fetus later in gestation, such as preeclampsia, chronic hypertension, and uterine anomalies. Karyotyping is an important investigation for symmetric IURG for chromosomal disorders particularly for babies with abnormal features. Chromosomal microarray analysis (CMA) is a high resolution, whole-genome screening technique that can identify most of the chromosomal imbalances as well as smaller submicroscopic deletions and duplications that are referred to as copy-number variants (CNVs) and has quicker turnaround time than a karyotype [8–10]. As microarray has a higher diagnostic yield than conventional karyotype, in our institute we are doing microarray instead of a conventional karyotype for all symmetrical IUGR.

Objectives

  1. Primary objectives: to evaluate the results of Microarray in symmetrical IUGR babies.
  2. Secondary objectives: to compare microarray positive babies and negative babies regarding: gestation age, weight, Apgar score, need and indications for NICU admission as well as the length of NICU of stay.

Study Methodology

This is a retrospective study of symmetrical IUGR babies regarding their microarray results. Babies were considered symmetric IUGR if their growth parameter is less than 10 centiles of gestation age and sex. Symmetrical IUGR babies (as per growth curves) born in Al Wakra hospital, Qatar between Jan 2016 and December 2017 were included in this study. Exclusion criteria were Down syndrome babies, Multiple pregnancies and TORCH+ cases.

Required maternal and neonatal data were extracted from the electronic patient records (Cerner) and entered into the data collection sheet. Maternal data included: age, parity, history of abortions, family history, gestational age, mode of delivery, instrumental use for delivery, meconium stained liquor and fetal deceleration. Newborn data included: weight, sex, Apgar score at 5 minutes, need of resuscitation, cord pH, dysmorphic features or malformations, need for NICU admission, the reason of admission, duration of NICU stay and lab parameters as TORCH, microarray result, leukocyte count, platelet count, ultrasound and ECHO.

Data collection was started after approval from the institutional review board and ethical committee. For data analysis, SPSS 18 was used. Statistical test was applied as appropriate. P value was taken as significant if less than 0.05.

Microarray test method

The test was done by cytogenetic and molecular cytogenetic laboratory, Doha, Qatar. Genome-wide oligonucleotide array-based comparative genomic hybridization (aCGH) analysis was performed with the use of Human Genome CGH Microarray kit (OGT). The array contains ~40,000–180,000 DNA oligonucleotide probes spaced approximately 30–37kb apart genome-wide. The probe sequences and locations were from the human genome build (hg19). The purpose of this experiment was to identify any copy number changes (aneuploidy, gain/loss) associated with a chromosomal abnormality. Interpreted as per the database of Genomic Variants (projects.tcag.ca/variation).

Result

Between Jan 2016 and December 2017 total 10,695 babis babies were born. Among that 578 babis babies were IUGR (501 asymmetric and 77 symmetric IUGR). Total 71 babies were taken in our analysis after excluding 3 down syndrome and 3 babies part of multiple pregnancies. Microarray test had positive findings in 14/71 (19.7%). There were copy number changes of unknown significance in 8/71 (11.2%). In (Table 1) findings are presented. It was abnormal in 2/71 cases (2.8%), one 22q11.2 Deletion syndrome consistent with DiGeorge syndrome had left absent kidney but normal ECHO finding and another one trisomy 18 had atrial septal defect and ventricular septal defect. The latter died on day 18 of life.

Table 1. microarray test result findings in 14 positive cases. Interpreted as per the database of Genomic Variants (projects.tcag.ca/variation).

CASE

RESULT

MOLECULAR CHANGE

CHANGE

1

Likely Benign Familial Copy Number Change

arr [hg19] 7q31.1(110,217,966–110, 692,136)X1 mat

loss of the long arm of chromosome7 within cytogenetic band 7q31. The deleted segment is ~474-kb kilobases (kb) in size.

2

familial benign copy number change of unknown significance

arr[hg19] Xq11.2(63,481,708–64,416,909)X3

gain of ~935-kb of the long arm of chromosome X, within cytogenetic band Xq11. duplicated region contains OMIM gene ZC4H2, heterozygous deletion, and loss of mutation in this gene are reported in males with Wieacker-Wolff syndrome.

3

copy number change of unknown biological significance

arr [hg19]7q21.22 (88,419,362–89,016,837)X3, arr [hg19]13q21.33(71,030,914–71,903,305)

two copy number changes, one is a gain of ~ 1.7 Megabase (Mb) in the long arm of chromosome 7 at cytogenetic band 7q21.2 and the second is a loss of ~872 kilobases (kb) in the long arm of chromosome 13 at cytogenetic band 13q21. No OMIM genes reported in these regions.

4

Abnormal

arr [hg19] 22q11.1q11.2(17,364,612–19,835,391)x1

loss of the long arm of chromosome 22 involving the 22q11.2 is known as Velocardiofacial syndrome and DiGeorge syndrome (OMIM #192430)

5

copy number change of unknown significance

arr (hg19)18q12.1(25,278,479–26,575,519)X4

gain of the long arm of chromosome 18 involving cytogenetic bands 18q12. The duplicated region is ~1.3 Mb in size and includes the CDH2 gene. This gene belongs to cadherin gene family encode proteins that mediate calcium-ion-dependent adhesion.

6

Likely benign copy number change

arr [hg19] 15q13.1(29,818,374–30,297,008)X3

gain of the long arm of chromosome 15 within cytogenetic band 15q13.1. The duplicated segment is ~478 kilobases (kb) in size and there is no reported OMIM gene in this region.

7

Familial copy number change of unknown clinical significance

arr [hg19] 2p16.3(50,790,968–50,996,447)X1 pat

loss in the short arm of chromosome 2 within cytogenetic band 2p16.3.  The size of the deleted segment is ~205 kilobases (kb), which causes partial deletion of the NRXN1 gene Heterozygous partial deletions, as well as other mutations and disruptions, of NRXN1 have been reported in association with susceptibility for neurocognitive disabilities, such as autism spectrum disorders (ASDs)

8

copy number change of unknown significance

arr [hg19] 22q11.1(17,666,611–17,809,359)X1

deletion of ~142-kb within cytogenetic band 22q11.1. The loss causes partial deletion of the CECR1 gene. Mutations in this gene have been reported in Polyarteritis nodosa, childhood-onset, an autosomal recessive condition

9

copy number change of unknown significance

arr [hg19] 7q35(146,079,234–146,570,064)x3

duplication of ~491-kb within cytogenetic band 7q35. The copy number change causes partial duplication CNTNAP2 gene. Disruption of this gene in chromosomal rearrangements has been reported in children with autism. Homozygous mutations in this gene have been reported in children with seizures

10

Copy number change of unknown clinical significance

arr [hg19] 11q13.4(73,688,299–73,783,214)X3

gain of ~94-kb of the long arm of chromosome 11, within cytogenetic band 11q13. This copy number change causes partial duplication of the OFD14 gene, suspected to be associated with Orofaciodigital syndrome XIV, an autosomal recessive condition

11

Copy number change of unknown significance

arr [hg19] 3p26(2,213,357–2,277,767)X1

a ~64 kilobases deletion of the short arm of chromosome 3 within cytogenetic band 3p26, which causes partial deletion of the CNTN4 gene. Disruption of this gene have been reported in patients with physical features of 3p deletion syndrome

12

Copy number change of unknown clinical significance

arr [hg19] 6q14.3q15(86,371,996–88,176,951)X3

gain of ~1.8-Megabases (Mb) in the long arm of chromosome 6 around cytogenetic band 6q14 and q15. The duplicated segment contains multiple genes including GJB7, HTR1E etc

13

Abnormal

arr [hg19]18(1–48129895)X3

an extra copy of chromosome 18, known as Edwards syndrome.

14

copy number change of unknown significance

arr [hg19]11q25(133,662,374–134,373,630)X3

terminal duplication of ~711-kb of the terminal region of chromosome 11. The duplicated segment includes OMIM gene JAM3.

We had compared maternal outcome in microarray positive result group with negative result group in respect of parity, abortion, mother age, gestation age, delivery mode, instrument used for delivery, meconium stained liquor or fetal deceleration. Findings were not significantly different between groups. see (Table 2).

Table 2.

Microarray Test done
Total = 71

Positive result
Number 14  (19.7%)

Negative result
Number  57  (80.2%)

Ods Ratio with CI 95% /
MD with CI 95%

P value

Parity                                     Number (%)

Nulliparous  6  (43%),

multipara     8  (57%)

Nulliparous 30  (52%),

multipara    27   (48%)

1.78  (0.45 to 4.81)

0.512

Abortion                                Number (%)

4  (28.5%)

16  (28%)

1.02  (0.28 to 3.74)

0.97

Mother age (year)                  mean±SD

27.79   ±5.7                  range 19–36

29.72   ±4.7                   range 20–41

-1.9  (-4.8 to 0.99)

0.192

Gestation age (weeks)           mean±SD

37.07   ±1.9                   range 33–40

36.98   ±1.5                   range 33–40

0.08  (-0.86 to 1.04)

0.852

Delivery mode                       Number (%)

Vaginal      8  (57%),

caesarian  6  (43%)

Vaginal     25  (44%),

caesarian  32  (56%)

1.7  (0.52 to 5.55)

0.372

Instrument use                       Number (%)

1  (7.1%)

5  (8.7%)

0.844

Meconium                              Number (%)

1  (7.1%)

7  (12.2%)

0.54  (0.06 to 4.8)

0.586

Deceleration                          Number (%)

2  (14.2%)

15 (26.3%)

0.46  (0.93 to 2.33)

0.345

Sex                                         Number (%)

Male     4  (28.5%)

female 10  (71.5%)

Male      25   (43.8%)

female   32   (56.2%)

0.51 (0.14 to 1.82)

0.297

Weight (gram)                        mean±SD

2044  ±409

2121  ±332

-77  (-130 to 248)

0.461

Apgar at 5 min                       mean±SD

9.4   ±1.15

  9.9   ±0.34

-0.48  (-0.83 to -0.13)

0.008

Resuscitation                         Number (%)

2  (14.2%)

3  (5.2%)

3   (0.45 to 19.5)

0.237

Cord pH                                 mean

7.313

7.03

0.28  (-0.66 to 1.2)

0.107

NICU admission                    Number (%)

7  (50%)

31  (54.3%)

0.83  (0.26 to 2.7)

0.768

NICU stay (days)                   mean±SD

18.14   ±10.6

8  ±6.28

10.1 (4.04 to 16.2)

0.019

TORCH negative                   Number (%)

14 (100%)

55 (100%, in 2 cases not done)

WBC   1000/cmm                  mean±SD

10.36   ±4.2                     (done in 8 cases)

12.62 ±5.7                          (done in 42 cases)

-2.2  (-6.5 to 2.05)

0.244

Platelet 100000/cmm             mean±SD

148  ±83                        (done in 8 cases)

221  ±99                         (done in 42 cases)

-73.1  (-146 to 0.1)

0.045

Platelet <150 x 106               Number (%)

             <100 x 106

4/8  50%                        (done in 8 cases)

3/4  75%

8/42  19%                      (done in 42 cases)

3/8    37%

CI – Conficane interval, MD – Mean difference, WBC – white blood cells

When compared some neonatal outcomes between the same two groups as sex, birth weight, the need of resuscitation, cord ph., NICU admissions, findings were not significant either. See Table 2. However apgar score at 5 minutes was statistically significant P 0.008 but clinically not significant mean 9.4/ 9.9. Duration of NICU stay was significantly high in microarray result positive group P 0.019, mean duration of stay ±SD 18.14 ±10.6 / 8 ±6.28 day. Among blood counts, platelets were significantly low in microarray positive result group P 0.045, mean ±SD 148 ±83 / 221±99. TORCH was done in 69/71 case and it was negative in all.

Ultrasound (brain ultrasound done in 13 cases and abdomen ultrasound in 13 cases) and ECHO done in 6 cases as clinically indicated; findings are presented in (Table 3).

Table 3. Ultrasound and ECHO result in microarray positive and negative result cases.

ULTRASOUND

                                                     Brain                                     Abdomen

microarray

Positive cases

Normal 4

Flare 1

Normal 3

Absent one kidney 1

Negative cases

Normal  7

Flare 1

Normal  7

Abnormal 0

ECHO

microarray

Positive cases

(done in 2 cases)

Normal 1 ,   VSD &PDA 1

Negative cases   (done in 4 cases)

Normal 2,    ASD 1, VSD 1,

Discussion

Neonates affected with Intrauterine growth restriction (IUGR) not only have high prenatal and postnatal complication but also at high risk of cerebral palsy, developmental delay and behavioral dysfunction 4,5. Increasing evidence points to a link between IUGR and adult metabolic syndrome [11, 12].

As in early-onset symmetric IUGR one cause is chromosomal disorder. So, karyotyping is one investigation particularly if a baby is found with abnormal features. As Chromosomal microarray analysis (CMA) is a high resolution, whole-genome screening technique that can identify most of the chromosomal imbalances detected by conventional cytogenetic analysis, as well as smaller submicroscopic deletions and duplications and can be performed on uncultured DNA samples [10]. With accumulating experience during the last decade and data demonstrating improved detection of chromosomal abnormalities compared to conventional karyotyping, CMA is proving to be a valuable diagnostic tool in the prenatal setting [8,9]. Some recommend using CMA for genetic analysis when fetal structural anomalies and/or stillbirth need to be evaluated and to replace the need for fetal karyotype in these cases [10]. But CMA analysis will not detect balanced alterations (reciprocal translocation, inversions, Robertsonian translocations, and balanced insertions).

In our study, chromosomal changes were detected by microarray test in 19.7% (14/71) of symmetric IUGR babies and mostly copy number changes of unknown significance. In two cases it was abnormal 2.8% (2/71), one going with DiGeorge syndrome and another one trisomy 18. The latter died in the neonatal period. We did not find any study in IUGR babies to compare our result. In one study CMV was used as prenatal test for clinical indications as abnormal findings on fetal ultrasound, positive Down syndrome screening or maternal anxiety concerning advanced maternal age, family history of genetic disorder or previous child with anomalies; detected 20% (44/220) clinically significant copy number variants (CNV), of which 21 were common aneuploidies and 23 had other chromosomal imbalances [9]. In another study to see utility of chromosomal microarray in predicting neonatal outcomes in the setting of fetal malformations, they found that nineteen (26.8%) had pathogenic CNV and of these, there were 6 neonatal deaths (31.6%) compared to 8 of 49 (16.3%) in normal CMA cases (p . 0.16) [13]. In another study done on the utility of chromosomal microarray in anomalous fetuses, Abnormal CMA was not associated with increased odds of perinatal death in this cohort and fetal; such fetuses are at high risk of perinatal death irrespective of CMA result [14].

CMA technique does not require dividing cells, in contrast to conventional karyotyping, which requires cell culture, so has quicker turnaround time. CMA has a greater resolution than conventional karyotyping, allowing for the detection of much smaller, submicroscopic deletions, and duplications typically down to a 50- to 100-kb level [15]. The disadvantage of CMA is that it looks for genomic imbalance and is not able to detect totally balanced chromosomal rearrangements, such as translocations or inversions. Also, CMA does not provide information about the chromosomal mechanism of a genetic imbalance ie change is trisomy or an unbalanced Robertsonian translocation which sometimes need to be confirmed by a karyotype. [15,16] Another disadvantage of CMA is the inability to precisely interpret the clinical significance of a previously unreported CNV or to accurately predict the phenotype of some CNVs that are associated with variable outcomes 10. CNVs are characterized as benign, clinically significant (ie, pathogenic), and as a variant of uncertain significance (VUS). The overall prevalence of VUS is approximately 1–2% [17,18,19]. In our study it was in 11.2% symmetric IUGR babies which is much higher than reported prevalence. There is no study in IUGR babies to compare our result.

When comparing microarray positive cases with microarray negative cases, most findings were not significant except the duration of NICU stay and platelet count (Table 2). NICU admission was high among IUGR babies about 50% but comparable in both groups. In one study the overall admission rate was 7.2 per 100 births [20]. Leukopenia and thrombocytopenia are known in IURG. In our study thrombocytopenia was present in 24% (12/50) cases. Among microarray positive group it was in 50% (4/8) babies and in 75% of them (3/4) count was less than 100 x 106. Among microarray negative, thrombocytopenia was in 19% (8/42) and in 37% of them (3/8) count was less than 100 x 106. Platelet count is more significantly low in microarray test positive group 148/221 x 106 cmm P= 0.045. In our study TORCH was negative in all cases. One case with 22q11.2 Deletion syndrome had absent one kidney but normal cardiac anatomy. One case with trisomy 18 had atrial septal defect and ventricular septal defect.

Conclusion

Most of the microarray test results were copy number changes of unknown significance which is comparitively much higher than reported prevalence. Microarray positive IUGR had comparable NICU admissions to negative result group but their duration of stay, initial lower Apgar scores and thrombocytopenia was significantly higher. This may be because even copy number changes have unknown significance, they may have some clinical effect which is not known till now and may need further studies and long term followup for those cases.

This study has been Approved by Medical Research Center Hamad Medical Corporation  # MRC-01-18-006

References

  1. Demirci O, Selçuk S, Kumru P, Asoğlu MR, Mahmutoğlu D, et al. (2015) Maternal and fetal risk factors affecting perinatal mortality in early and late fetal growth restriction. Taiwan J Obstet Gynecol 54: 700–704. [crossref]
  2. Bernstein IM, Horbar JD, Badger GJ, Ohlsson A, Golan A (2000) Morbidity and mortality among very-low-birth-weight neonates with intrauterine growth restriction. The Vermont Oxford Network. Am J Obstet Gynecol 182: 198–206. [crossref]
  3. Brar HS, Rutherford SE (1988) “Classification of intrauterine growth retardation,”. Seminars in Perinatology 12: 2–10.
  4. Bernstein I, Gabbe SG, Reed KL (2002) Intrauterine growth restriction,” in Obstetrics: Normal and Problem Pregnancies. Gabbe SG et al. (Eds.) Churchill Livingstone, New York, NY, USA, Pg No: 869.
  5. Soothill PW, Nicolaides KH, Campbell S (1987) Prenatal asphyxia, hyperlacticaemia, hypoglycaemia, and erythroblastosis in growth retarded fetuses. British Medical Journal 294: 1051–1053.
  6. Nikkila A, Kallen B, Marsal K (2007) Fetal growth and congenital malformations. Ultrasound Obstet Gynecol 29: 289–295.
  7. Baschat AA, Cosmi E, Bilardo CM, Wolf H, Berg C, et al. (2007) Predictors of neonatal outcome in early-onset placental dysfunction. Obstet Gynecol 109: 253e61.
  8. Zhu H, Lin S, Huang L (2016) Application of chromosomal microarray analysis in prenatal diagnosis of fetal growth restriction. Prenat Diagn 36: 686.
  9. Kan AS, Lau ET, Tang WF, Chan SS, Ding SC, et al. (2014) Whole-Genome Array CGH Evaluation for Replacing Prenatal Karyotyping in Hong Kong. PLoS ONE 9: 87988.
  10. Lorraine Dugoff, Norton ME, Kuller JA (2016) The use of chromosomal microarray for prenatal diagnosis. Am J Obstet Gynecol 215: 2–9.
  11. Barker DJ, Bull AR, Osmond C, Simmonds SJ (1990) Fetal and placental size and risk of hypertension in adult life. BMJ 301: 259–262. [crossref]
  12. Barker DJ, Winter PD, Osmond C, Margetts B, Simmonds SJ (1989) Weight in infancy and death from ischaemic heart disease. Lancet 2: 577–580. [crossref]
  13. Jacqueline Parchem, Teresa Sparks, Kristen Gosnell, Mary Norton (2015) The utility of chromosomal microarray in predicting neonatal outcomes in the setting of fetal malformations. American Journal of Obstetrics & Gynecology 212:  174–175.
  14. Parchem JG, Sparks TN, Gosnell K, Norton ME (2018) Utility of chromosomal microarray in anomalous fetuses. Prenatal Diagnosis 38: 140–147.
  15. Fruhman G, Van den Veyver IB (2010) Applications of array comparative genomic hybridization in obstetrics. Obstet Gynecol Clin North Am 37: 71–85.
  16. South ST, Lee C, Lamb AN, Higgins AW, Kearney HM (2013) Working Group for the American College of Medical Genetics and Genomics Laboratory Quality Assurance Committee. ACMG Standards and Guidelines for constitutional cytogenomic microarray analysis, including postnatal and prenatal applications: revision 2013. Genet Med 15: 901–909.
  17. Wapner RJ, Martin CL, Levy B, Ballif BC, Eng CM, et al. (2012) Chromosomal microarray versus karyotyping for prenatal diagnosis. N Engl J Med 367: 2175–2184. [crossref]
  18. Hillman SC, McMullan DJ, Hall G (2013) Use of prenatal chromosomal microarray: prospective cohort study and systematic review and metaanalysis. Ultrasound Obstet Gynecol 41: 610–620.
  19. Shaffer LG, Dabell MP, Fisher AJ, Coppinger J, Bandholz AM, et al. (2012) Experience with microarray-based comparative genomic hybridization for prenatal diagnosis in over 5000 pregnancies. Prenat Diagn 32: 976–985. [crossref]
  20. Harrison WN, Wasserman JR, Goodman DC (2018) Regional Variation in Neonatal Intensive Care Admissions and the Relationship to Bed Supply. J Pediatr 192: 73–79.

The Associations of Reactive Oxygen Metabolites and Biological Antioxidant Potentials with Related Factors in Healthy Youth

Abstract

To investigate the statuses of the relationships between exercise, dietary habits, sleep, and serum biomarkers, such as reactive oxygen metabolites (ROM) and biological antioxidant potentials (BAP), we conducted a questionnaire survey and collected urine and blood samples from high school students and university athletes. Using the ROM and BAP values, the Oxidative stress-Antioxidant capacity Ratio (OAR) which reflects the antioxidant capability was calculated. Although differences among the subgroups, such as gender, schools, and exercise habits etc., were observed, the levels of both ROM and BAP were low, reflecting good psychosomatic statuses. The significant positive association between these two markers was indicated. The univariate analysis indicated that the ROM value was significantly inversely associated with the consumption of ‘pork’, ‘chicken’, and ‘beef’, while the OAR correlations to these three foods were significantly positive. The multivariate analysis revealed that ‘female’ as compared with ‘male’ had a significantly increased ROM level, whereas ‘soybean’ (P < 0.001) decreased it. Similarly, the BAP levels of ‘female’ and ‘soybean’ were significant decreased. In addition, in terms of OAR, ‘soybean’ was significantly increased, while ‘female’ was significantly decreased. The present findings should be considered in the future through carefully designed epidemiological studies. In particular, comparisons between the present results and those obtained from another population sample, such as elderly citizens, should be considered.

Keywords

Adolescents, Biological Antioxidant Potentials, Lifestyle, Reactive Oxygen Metabolites

Introduction

As accumulating evidence has indicated, oxidative stress is caused by an imbalance between oxidants and antioxidants [1]. Increased oxidative stress plays an important role in the progression of chronic diseases, and aging. As reported in previous studies [2, 3], strong links have been found between oxidative stress and various factors, such as cigarette smoking, alcohol drinking, and aging. Therefore, measuring oxidative stress levels may be useful not only for the prediction of chronic disease propensity, but also for early health promotion and administration. Particularly, from the viewpoint of health promotion, studies using biomarkers for children and infants should be performed, to accumulate beneficial evidence for individual and group health promotion. In infants, measuring oxidative stress or antioxidant capacity was conducted not only in unhealthy subjects with diabetes [4–6], hypercholesterolemia [7], atopic dermatitis [8], and Helicobacter pylori infection [9], but also in healthy subjects [10–14]. However, almost all of these findings [4–13] were based on small groups. Investigations using biomarkers based on epidemiological concepts among larger groups of infants are required.

The BAP and ROM tests have been developed for measuring reactive oxygen metabolites (ROM) and biological antioxidant potentials (BAP) in blood. The main component of ROM is hydroperoxide [15, 16], which causes cell death and tissue damage [17, 18]. In spite of its oxidant power, the hydroperoxide level in blood can be determined accurately, and it is comparatively stable in comparison with the parent free radicals [19]. The BAP test measures the capacity of blood to convert an Fe3+ reagent to Fe2+ [20, 21]. These tests are conducted using the Free Radical Analytical System 4 (FRAS4; Diacron, Grosseto, Italy) [15, 16, 22]. Although the amount of time required to test both ROM and BAP is remarkably shorter (approximately 15 min/sample), as compared with other serum oxidative markers, these ROM and BAP tests are reportedly sensitive [20]. Several studies about the ROM and BAP tests for adults [15–20] have been conducted.

However, as far as we know, little is also known about the levels of ROM and BAP in youths or adolescents, or about related factors. Therefore, further investigations using ROM and BAP are necessary for a comparatively large sample of infants, to consider whether these two markers reflect the actual statuses of the oxidative stress level and the antioxidant capacity, or how these are influenced by related factors. Consequently, we collected blood from healthy young students and asked them to complete a questionnaire survey, to consider the actual statuses of oxidative stress and antioxidant capacity by means of measuring the ROM and BAP values, and related factors. Essentially, the purposes of the present study are to consider (1) the levels of ROM and BAP among adolescents and youths, (2) the differences in the ROM and BAP levels among subgroups with different characteristics, and (3) the relationships of ROM and BAP with various related factors.

Material and Methods

Ethical procedure, blood collection and questionnaire survey

In this study, 329 high school students (193 males and 136 females) and 41 university students (33 males and 8 females) participated (total 370 subjects). The university students are members of a track and field athletics club, and they train in either sprint or jump events almost daily. Incidentally, the present university students include candidates for the next Olympic Games. The 329 high school students were classified according to whether or not the students participate in an extra-curricular sports activity, and we decided on the following three subgroups: ordinary high school students group (OS: 50 males and 63 females), high school athletes group (HA: 143 males and 73 females), and university athletes group (UA: 33 males and 8 females) (Table1).

The study protocol was approved by the Ethics Committee of the Faculty of Education and Culture, University of Miyazaki (No. 001), along with the Declaration of Helsinki (Edinburgh, October 2000). The participants provided written informed consent before the study. All subjects were in good health status at the time of blood collection. Venous blood samples (approximately 7cc) were collected from participants through venipuncture of the median cubital vein, by an experienced physician and registered nurses. At the same time, each individual’s information on school, age, sex, height, weight (for BMI), and lifestyle was obtained from the questionnaire. With regard to lifestyle items, self-estimations of exercise and dietary habits were expressed on a three point scale as follows: “not or rarely”, “moderately”, “almost regularly”.

Measurements of ROM and BAP

To estimate the levels of both oxidative stress and antioxidant capacity, the ROM and BAP tests using the FRAS4 were conducted. In general, a venous blood sample from the fingertip is utilized for the ROM and BAP tests by using FRAS4. However, a blood sample from the fingertip is exposed to the outside air, and although the two tests using FRAS4 are cheap and reportedly accurate [23], we were concerned that the effect of the oxidation of blood samples may lead to some bias. Therefore, we used a fresh serum sample, without exposure to the outside air, for the ROM and BAP tests. We obtained fresh serum samples by centrifuging the blood at 3,000 r.p.m. for 10 minutes, immediately (within 10 minutes) after the blood was collected. The obtained serum samples were stored at –20°C until assayed. In addition, these serum samples were analyzed within 3 days after drawing the blood, to ensure the freshness of the serum.

According to the manufacturer’s recommendations, a 10μL serum sample and 1 mL of solution buffer (R2 reagent of kit, pH 4.8) were mixed in a cuvette, and 10μL of the chromogenic substrate (R1 reagent) was added to the cuvette. After mixing and centrifugation for 60 seconds, the cuvette was incubated in a thermostatic block for 5 minutes at 37°C. The absorbance at 505 nm was then recorded. The measurement values are represented by Carratelli units (U.CARR), where 1 U.CARR corresponds to 0.8 mg/L H2O2. To determine the BAP levels, 50μL of the R2 reagent (ferric chloride) was added to the cuvette containing the R1 reagent (thiocyanate derivative), and the absorbance was measured to obtain the reagent blank value. A 10μL portion of the serum sample was then added to the cuvette. After an incubation for 5 minutes at 37°C, the absorbance at 505 nm was recorded. The BAP levels were expressed as μmol/L. The manufacturer’s (Diacron) standards stated that the desirable range of ROM levels is 250–300 U.CARR [15, 22], and that sufficient BAP levels are higher than 2,200 μmol/L [20, 21].

Statistics

Fundamentally, the statistical analyses in present study were conducted for each sex and each group, and were compared between male and female or among subgroups, respectively. The mean values and standard deviations of ROM and BAP were calculated. Moreover, we determined the Oxidative stress-Antioxidant capacity ratio (OAR), using the ROM and BAP values, in order to clarify each characteristic of the subgroups. Regarding this OAR analysis, Sharma et al. [24] reported that the composite reactive oxygen species (ROS)-total antioxidant capacity (TAC) score is a novel measure of oxidative stress and is superior to ROS or TAC alone, in discriminating between fertile and infertile men. In ruminant medicine, the information on oxidative stress is more accurate when using combined ROM and BAP data than when using them separately [25, 26]. The OAR was calculated as follows: BAP / ROM / divided by the geometrical mean of BAP / ROM. Since the total mean of the OAR value corresponds to 1.0, the OAR value for each group may be interpreted as follows: values higher than 1.0 indicate high antioxidant ability, whereas those less than 1.0 show low antioxidant ability.

The height, body weight, BMI, and sleep duration were also analyzed as continuous variables. Therefore, the gender or subgroup differences for these variables were detected by a t-test or a one-way analysis of variance (ANOVA). In addition to the ANOVA analysis, multiple comparisons among the subgroups were conducted with Scheffe’s test. The following 16 items were analyzed as categorical variables: ‘aerobic exercise’, ‘anaerobic exercise’, ‘strength training’, ‘soybean intake’, ‘potato intake’, ‘seaweed intake’, ‘bean curd intake’, ‘fruit intake’, ‘pork intake’, ‘chicken intake’, ‘beef intake’, ‘light-colored vegetable intake’, ‘green or yellow colored vegetable intake’, ‘salty confectionery intake’, ‘chocolate-like sweets intake’, and ‘soft drink intake’. Since comparative analyses for these 16 items require nonparametric tests, the subgroup differences were extracted by a Kruskal-Wallis test. The relationships between ROM, BAP, and OAR with related factors were analyzed with partial correlation coefficients, except for the effects of gender difference. Moreover, a multiple regression analysis with a stepwise procedure was conducted to reveal the significant factors for ROM, BAP, and OAR, as dependent variables. Since the distributions of these three markers were skewed, the log-transformed values of ROM, BAP, and OAR, which showed normal distributions, were used in the stepwise multiple regression analysis. All data were analyzed using the SPSS software, version 14.0 (SPSS Japan Inc., Tokyo, Japan).

Results

The profiles, physical characteristics, and sleeping durations in each group are outlined in Table 1. As the statistical results, the ANOVA test indicated that the height, weight, and BMI values of the male subjects were higher in UA than in HS and HA (P < 0.05~0.01). According to the t-test, the BMI values in HA and UA were higher in males than in females (P < 0.01 and P < 0.05). In addition, the sleeping durations in HA were greater in males than in females (P < 0.001).

The ROM (U.CARR) level for the total subjects was 249.28 ± 51.46. A 4.61-fold interindividual variation was found (min = 99, max = 456). Similarly, the BAP level (μmol/L) was 2,478.36 ± 276.59, with a 1.92-fold interindividual variation (min = 1,684, max = 3,231). The OAR level was 1.00 ± 0.23 (min = 0.48, max = 2.61, interindividual variation = 5.44-fold). The mean values (SD) of ROM, BAP, and OAR by gender or groups are shown in Table 1. The ANOVA test revealed that the ROM levels in male subjects were significantly different across the three groups (P < 0.01). Similarly, the BAP levels in both male and female subjects were significantly different among the three groups (P < 0.001 and P < 0.05). For the OAR results, the male value was significant higher than the female value (P < 0.001). Additionally, a significant positive association was observed between the ROM level and the BAP level in the entire sample (P < 0.05).

Table 1. Subjects’ characteristics, reactive oxygen metabolites (ROS), biological antioxidant potentials (BAP), and oxidative stress-antioxidant capacity ratio (OAR) among HS group, HA group, and UA group.

ASMHS 2019- - Kazuyoshi _Japan_F1

Note 1: High school student group, high school athletes, and university athletes are shown as HS, HA, and UA, respectively.

Note 2: t-test was applied to detect gender difference in each group, showing t values and asterisk.

Note 3: ANOVA was applied to detect the subgroup difference in each gender, showing F values and asterisk.

Statistical significance levels are as follows : * P < 0.05 ** P < 0.01 ***P < 0.001

(Table 2) shows the response patterns of the 16 categories of lifestyle items in each group. The Kruskal-Wallis test revealed that the frequencies of ‘anaerobic exercise’, ‘aerobic exercise’, ‘strength training’, ‘soybean’, ‘potato’, and ‘seaweed’ were remarkable higher in the UA group than in the other groups (P < 0.001 for all). Conversely, ‘pork’ and‘light-colored vegetable’ were lower in the UA group as compared with the other two groups (P < 0.05 and P < 0.01).

Table 2. Distributions (%) of lifestyle factors in high school students (HSS), high school athletes (HSA), and university athletes (UA)

ASMHS 2019- - Kazuyoshi _Japan_F2

Note: Kruskal-Warris test was conducted in order to detect statistical differences among sub-groups, shown as X score and asterisks. .Statistical significance levels are as follows: * P < 0.05 ** P<0.01 ***P<0.001

(Table 3) shows the associations between the three markers and related factors. For the continuous and nominal variables, the items significantly related to the ROM level were ‘age’(r = –0.21, P < 0.001), ‘height’(r = –0.23, P < 0.001), ‘gender’ (r = 0.18, P < 0.001), ‘school’ (r = –0.19, P < 0.001), and ‘subgroup’ (r = –0.14, P < 0.01). The items related to the BAP level were ‘age’(r = –0.26, P < 0.001), ‘gender’ (r = –0.11, P < 0.05), ‘school’(r = –0.21, P < 0.001) and ‘extracurricular sports activity’ (r = –0.10, P < 0.05). The OAR level was significantly correlated to ‘height’(r = 0.17, P < 0.01), ‘weight’ (r = 0.11, P < 0.05), ‘gender’ (r = –0.23, P < 0.001), ‘subgroup’ (r = 0.13, P < 0.001), and ‘extracurricular sports activity’ (r = 0.12, P < 0.01).

Table 3. Associations of BAP, ROM, and OAR with related factors.

ASMHS 2019- - Kazuyoshi _Japan_F3

a) Pearson’s correlation coefficient was applied.

b) Spearman’s correlation coefficient was applied.

c) Partial correlation coefficient without the influences of gender and school, were applied.

Statistical significance levels are as follows: * P<0.05 ** P<0.01 *** P<0.001

Additionally, to detect the authentic correlation between these markers and the lifestyle factors, we collectively conducted a partial correlations analysis for the entire sample, with the elimination of the influences of gender and school differences Table 3. The ROM level was significantly inversely correlated to ‘soybean’(r = –0.13, P < 0.05), ‘pork’(r = –0.11, P < 0.05), ‘chicken’ (r = –0.12, P < 0.05), and ‘beef’(r = –0.13, P < 0.05), whereas the BAP level was not significantly related to all lifestyle items. The OAR level was significant associated with ‘soybean’(r = 0.14, P < 0.05), ‘pork’ (r = 0.10, P < 0.05), ‘chicken’ (r = 0.13, P < 0.05), and ‘beef’(r = –0.12, P < 0.05).

The results of the multiple regression analyses of BAP, ROM, and OAR by the stepwise method are shown in (Table 4). Due to the significant correlations between ‘BMI’ and ‘weight’ (r = 0.85, P < 0.001), or ‘extracurricular sports activity’ and ‘subgroup’ (r = 0.86, P < 0.001), the‘weight’and ‘subgroup’ items were not included in the analysis, in order to avoid collinearity. Accordingly, the following 23 items were used the in analysis as the independent variables: ‘age’, ‘height’, ‘BMI’, ‘sleep duration’, ‘gender (male = 0, female = 1)’, ‘school (high school = 0, university = 1)’, ‘extracurricular sports activity (not attend = 0, attend = 1)’, as well as the 16 lifestyle items. As the results, the ROM level of‘gender’ (P < 0.001) was significantly increased, whereas ‘soybean’ (P < 0.001) decreased it. These two independent factors obtained from the multiple regression analysis explain 11% of the entire variation. Similarly, ‘gender’ (P < 0.01) and ‘soybean’ (P < 0.001) had significantly decreased BAP levels, with only 3% variance explained. Finally, the OAR value of ‘soybean’ (P < 0.01) was significantly increased, while that of ‘gender’ (P < 0.01) was significant decreased, explaining 10% of the total variance.

Table 4. Stepwise multiple regression of log BAP, log ROM, and log OAR, against related factors

ASMHS 2019- - Kazuyoshi _Japan_F4

a) Log transformed BAP, ROM, OAR

b) Gender (male=0, female=1)

c) Partial r indicates partial regression coefficient.

Statistical significance levels are as follows : * P<0.05 ** P<0.01 ***P<0.001

Discussion

Levels of ROM, BAP, and OAR

We obtained fine ROM and BAP results that reflected the good status without gender or subgroup distinction among the present subjects. The ROM level in present subjects was remarkably lower than those in senior subjects [27–31], hemodialyzed patients [1], chronic obstructive pulmonary disease (COPD) patients [32, 33], asthma patients [34], periodontitis patients [35, 36], atherosclerosis patients [37], and obstructive sleep apnea patients [38]. Meanwhile, the present BAP level for all present subjects was slightly higher than those of healthy adults [32, 39]. As stated by Olinski [40], oxidative stress and oxidative DNA damage are probably contributing factors in aging. Specifically, the ROM level was positively associated with age [19, 39], whereas the BAP level was inversely correlated with age [19]. These previous findings support our present results, which indicated lower levels of both ROM and BAP.

A significant positive correlation between ROM and BAP was observed. This result is consistant with that in healthy middle-aged subjects [31]. As described by Halliwell [41], the production of reactive species in healthy aerobes is generally balanced with the antioxidant defense systems. The antioxidant level may change in proportion to the oxidative stress status. Therefore, our findings may be supported by Halliwell’s conclusions [41]. Based on the proportional association of ROM with BAP, the obtained OAR level may indicate that the antioxidant capacity was higher in males than in females, or in exercised subjects than in non-exercised subjects. For healthy adolescents or youth, the OAR level may be considered as a useful marker for investigating the actual association between oxidative stress, antioxidant capacity, and related factors, such as lifestyle.

Factors related to ROM, BAP, and OAR levels

The distributions of the various exercise statuses and the dietary intake were analyzed for the present subjects (Table 2). The frequencies of 3 items, composed of daily exercise, the consumption of 3 or more healthy foods, and the vegetable intake were remarkably higher in the UA group than in the HA or OA groups, irrespective of gender. These results are considered to be meaningful information, reflecting the characteristics of each subgroup. The Pearson’s and Spearman’s correlation analyses indicated that the ROM, BAP, and OAR levels were significantly associated with several demographic and physical factors. The characteristics of these results were explained as follows: daily exercising subjects or male subjects have lower values of ROM and BAP, and higher values of OAR.

With regard to the influences of exercise on ROM, the level reportedly demonstrated a reverse correlation with the handgrip strength [28]. Additionally, the ROM values in the present university subjects containing Olympic candidates were lower, and equivalent to those of elite woman volleyball athletes in Serbia [42]. Various studies have observed an adaptation in the body’s antioxidant defense system as a result of aerobic exercise [43,44] and anaerobic exercise [45,46]. Therefore, the ROM, BAP, and OAR levels among healthy youth, such as the present subjects, may be associated with substantial aerobic/anaerobic abilities, rather than exercise frequencies as mere practice. On the other hand, a significant association between the ROM level and high-sensitivity C-reactive protein, as an inflammatory marker, was reported [47]. Therefore, the ROM level may increase due to muscle injury from exercise. Acute exercise can stimulate an increase in reactive oxygen/nitrogen species (RONS) and subsequent oxidative stress [48]. The ROM level in elite athletes fluctuated between before and after the training period [42]. Moreover, other oxidative stress markers, such as malondialdehyde (MDA) and lipidhydroperoxides (LOOP), were reported as independent variables to the ROM level as a dependent variable [42]. Considering these previous findings, the validity or reliability of our findings should be confirmed according to an appropriately designed study that can reveal the type, duration, and intensity of exercise, as well as the associations with other oxidative stress markers.

The partial correlation analysis revealed that the ROM level was inversely and significantly correlated with the consumption of ‘soybean’, ‘pork’, ‘chicken’, and ‘beef’. Conversely, the OAR level was significantly and positively associated with those 4 variables. Among them, the ‘pork’, ‘chicken’, and ‘beef’consumption levels were significantly related to ROM and OAR, which was unexpected. For instance, the ROM level in people who generally have a high calorie dietary intake (meat, butter, oil, etc.) and scarcely consume vegetable or fruits, was striking higher than that in another people with a healthier dietary intake [28, 49]. However, the oxidative stress level was reportedly correlated with imidazole dipeptides, anserine and carnosine, found in various meats, as an antioxidant [50]. These are widely distributed in vertebrate organisms and are particularly abundant in skeletal muscle [50], and especially in chicken breast. However, their concentrations reportedly vary widely with species and muscle types, and are found in greater concentrations in muscle high in white fibers, with chicken white muscle fibers containing over five-fold more anserine and carnosine than the red fibers [51].

Therefore, the validity and reliability of the present results must be confirmed, using an improved questionnaire to investigate the types, parts, and preparation methods of the consumed meats.

As for ‘soybean’, the stepwise multiple regression analysis also revealed that increases of ROM and OAR, and a decrease of BAP were predicted, due to the increased amount of ‘soybean’consumed. As reported by Wijeratne et al. [52], the effects of the soy isoflavones genistein and daidzein on antioxidant enzymes were dependent upon the compound and its concentration. In addition, DNA damage is significantly inversely correlated to the plasma isoflavone concentrations, among healthy young subjects [53]. Similarly, for young subjects, the positive effects of soy protein consumption on the plasma total antioxidant status were observed [54]. Based on these previous findings, we should confirm the validity and reliability of the present BAP results, using other blood antioxidant markers, simultaneously. Similarly, the difference of‘gender’ was significantly related to the ROM, BAP, and OAR levels, not only in part of the univariate analyses, but also in the multivariate analysis. These results were in inverse proportion to previous findings [48, 55–57], which indicated significant lower levels of MDA in women than in men. These results may be due in part to the higher estrogen concentration [48], which is known to possess antioxidant properties. As one of the reasons, we could consider the fact that the present subjects were very healthy adolescents or youths. In the future, to reveal the gender differences between ROM, BAP, and OAR, we will conduct the same type of investigation with samples from adolescent-aged subjects and middle-aged and elderly subjects.

In premenopausal females, the measurements of oxidative stress were considered to potentially fluctuate during the menstrual cycle. As stated by Wactawski-Wende et al. [58], the human menstrual cycle includes cycle-related changes in estrogen and other endogenous hormone concentrations that may impact oxidative stress levels. Therefore, we should consider the influences of the menstrual cycle on the oxidative ROM, BAP, and OAR levels.

Future issues

Lastly, we must describe that the current study suffers from several possible problems and limitations. First, the interpretation of the present results is limited because of the questionnaire design. For instance, Table 2 indicated high “moderate” quantities for almost all of the foods/meals. The answer frame consisted of a three-point scale for our lifestyle factors items , allowing some ambiguity in the interpretation of these results. In the future, in order to explain the present findings, a questionnaire using a five- or more anchor point scale may be required. Second, the height and weight data were not based on measurements on the blood sampling day. Particularly, the weight data were obtained according to self-measurement at home on the morning of the blood collection. Therefore, their values may have some uncertainly, and may not necessarily provide completely accurate data for the BMI. Third, factors that may influence the serum marker data, such as the time of venous blood collection or the elapsed time after a meal or exercise, were not investigated in detail. From the limitations and problems described above, the present findings should be extended through a more precisely designed epidemiological study. In particular, a comparison between the present results and those obtained with another population sample, such as elderly subjects, should be considered.

Acknowledgment

This work was supported in part by a Grant-in-Aid for Scientific Research from the Ministry of Education, Culture, Sports, Science, and Technology of Japan (15K12702). We wish to thank the principals, the vice-principals, of Fukuoka Prefectural Nakama High School, Fukuoka Prefectural Hokuchiku High School, and Fukuoka Prefectural Wakamatsu High School for their support of this work. Especially among them, we are very grateful to two teachers, Mr. Hisao Wakizoe, and Mr. Kunihiro Shiraki.

References

  1. Nakayama K, Terawaki H, Nakayama M, Iwabuchi M, Sato T, Ito S (2007) Reduction of serum antioxidative capacity during hemodialysis. Clin Exp Nephrol 11: 218–224.
  2. Irie M, Tamae K, Iwamoto-Tanaka N, Kasai H (2005) Occupational and lifestyle factors and urinary 8-hydroxydeoxyguanosine. Cancer Sci 96: 600–606.
  3. Tamae K, Kawai K, Yamasaki S, Kawanami K, Ikeda M, et al (2009) Effect of age, smoking and other lifestyle factors on urinary 7-methylguanine and 8-hydroxydeoxyguanosine. Cancer Sci 100: 715–721.
  4. Hata I, Kaji M, Hirano S, Shigematsu Y, Tsukahara H, Mayumi M (2006) Urinary oxidative stress markers in young patients with type 1 diabetes. Pediatr Int 48: 58–61.
  5. Woo J, Yeo NH, Shin KO, Lee HJ, Yoo J, Kang S (2010) Antioxidant enzyme activities and DNA damage in children with type 1 diabetes mellitus after 12 weeks of exercise. Acta Paediatr 99: 1263–1268.
  6. Tsukahara H, Sekine K, Uchiyama M, Kawakami H, Hata I, et al (2003) Formation of advanced glycosylation end products and oxidative stress in young patients with type 1 diabetes. Pediatr Res 54: 419–424.
  7. Martino F, Pignatelli P, Martino E, Morrone F, Carnevale R, et al (2007) Early increase of oxidative stress and soluble CD40L in children with hypercholesterolemia. J Am Coll Cardiol 49: 1974–1981.
  8. Omata N, Tsukahara H, Ito S, Ohshima Y, Yasutomi M, et al (2001) Increased oxidative stress in childhood atopic dermatitis. Life Sci 69: 223–228.
  9. Shimizu T, Lee T, Shoji H, Kudo T, Satoh Y, Yamashiro Y (2003) Urinary 8-hydroxydeoxyguanosine excretion in children before and after therapy for eradication of Helicobacter pylori infection. Acta Paediatr 92: 1026–1028.
  10. Drury JA1, Jeffers G, Cooke RW (1998) Urinary 8-hydroxydeoxyguanosine in infants and children. Free Radic Res 28: 423–428. [crossref]
  11. Fukuda M, Yamauchi H, Yamamoto H, Aminaka M, Murakami H, et al (2008) The evaluation of oxidative DNA damage in children with brain damage using 8-hydroxydeoxyguanosine levels. Brain and Development 30: 131–136.
  12. Stewart RJ, Askew EW, McDonald CM, Metos J, Jackson WD, et al (2002) Antioxidant status of young children: response to an antioxidant supplement. J Am Diet Assoc 102: 1652–1657.
  13. Tamura S, Tsukahara H, Ueno M, Maeda M, Kawakami H, et al (2006) Evaluation of a urinary multi-parameter biomarker set for oxidative stress in children, adolescents and young adults. Free Radic Res 40: 1198–1205.
  14. Kelishadi R, Sharifi M, Khosravi A, Adeli K (2007) Relationship Between C-Reactive Protein and Atherosclerotic Risk Factors and Oxidative Stress Markers Among Young Persons 10–18 Years Old. Clin Chem 53: 456–464.
  15. Trotti R, Carratelli M, Barbieri M et al (2001) Oxidative stress and a thrombophilic condition in alcoholics without severe liver disease. Haematologica 86: 85–91.
  16. Dani C, Martelli E, Bertini G, Pezzati M, Filippi L, et al (2003) Plasma bilirubin level and oxidative stress in preterm infants. Arch Dis Child Fetal Neonatal Ed 88: 119–123.
  17. Yagi K, Ohkawa H, Onishi N, Yamashita M, Nakashima T (1981) Lesion of aortic intima caused by intravenous administration of linoleic acid hydroperoxide. J Appl Biochem 3: 58–65.
  18. Carratelli M, Porcaro L, Ruscica M, De Simone E, Bertelli AAE, et al (2001) Reactive oxygen metabolites and prooxidant status in children with Down’s syndrome. Int J Clin Pharmacol Res 21: 79–84.
  19. Komatsu F, Kudoh H, Kagawa Y (2007) Evaluation of oxidative stress and effectiveness of low-dose glucocorticoid therapy on exacerbation of chronic obstructive pulmonary disease. J Gerontology 62: 459–464.
  20. Gerardi G, Usberti M, Martini G, Albertini A, Sugherini L, et al (2002) Plasma total antioxidant capacity in hemodialyzed patients and its relationships to other biomarkers of oxidative stress and lipid peroxidation. Clin Chem Lab Med 40:104–110.
  21. Ippolito S, Caruso R, Nobembrino C et al (2002) Dislipidemia and oxidative stress. Ital J Biochem 51: 129.
  22. Cesarone MR, Belcaro G, Carratelli M, Cornelli U, De Sanctis MT, et al. (1999) A simple test to monitor oxidative stress. Int Angiol 18: 127–130. [crossref]
  23. Celi P, Sullivan M, Evans D (2010) The stability of the reactive oxygen metabolites (d-ROMs) and biological antioxidant potential (BAP) tests on stored horse blood. Vet J 183: 217–218.
  24. Sharma RK, Pasqualotto FF, Nelson DR, Thomas AJ Jr., Agarwal A (1999) The reactive oxygen species-total antioxidant capacity score is a new measure of oxidative stress to predict male infertility. Hum Reprod 14: 2801–2807.
  25. Pedernera M, Celi P, García SC, Salvin HE, Barchia I, and Fulkerson WJ (2010) Effect of diet, energy balance and milk production on oxidative stress in early-lactating dairy cows grazing pasture. Vet J 186: 352–357.
  26. Celi P (2011) Biomarkers of oxidative stress in ruminant medicine. Immunopharmacol Immunotoxicol 33: 233–240.
  27. Komatsu F, Kagawa Y, Kawabata T, Kaneko Y, Ishiguro K (2009) Relationship of dietary habits and obesity to oxidative stress in Palauan people: compared with Japanese and Mongolian people. Curr Aging Sci 2: 214–22.
  28. Komatsu F, Kagawa Y, Kawabata T, Kaneko Y, Purvee B, et al (2008) Dietary habits of Mongolian people, and their influence on lifestyle-related diseases and early aging. Curr Aging Sci 2: 84–100.
  29. Hirose H, Kawabe H, Komiya N, Saito I (2009) Relations between serum reactive oxygen metabolites (ROMs) and various inflammatory and metabolic parameters in a Japanese population. J Atheroscler Thromb 16: 77–82.
  30. Kamezaki F, Yamashita K, Kubara T, Suzuki Y, Tanaka S, et al (2008) Derivatives of reactive oxygen metabolites correlates with high-sensitivity C-reactive protein. J Atheroscler Thromb 15: 206–212.
  31. Fukui T, Yamauchi K, Maruyama M, Yasuda T, et al (2011) Significance of measuring oxidative stress in lifestyle-related diseases from the viewpoint of correlation between d-ROMs and BAP in Japanese subjects. Hypertens Res 34: 1041–1045.
  32. Komatsu F, Kudoh H, Kagawa Y (2007) Evaluation of oxidative stress and effectiveness of low-dose glucocorticoid therapy on exacerbation of chronic obstructive pulmonary disease. J Gerontology 62A: 459–464.
  33. Markoulis N, Gourgoulianis KI, Moulas A, Gerogianni E, Molyvdas AP (2006) Reactive oxygen metabolites as an index of chronic obstructive pulmonary disease severity. Panminerva Med 48: 209–213.
  34. Suzuki S, Matsukura S, Takeuchi H, Kawaguchi M, Ieki K, et al. (2008) Increase in reactive oxygen metabolite level in acute exacerbations of asthma. Int Arch Allergy Immunol 146: 67–72.
  35. Tamaki N, Tomofuji T, Ekuni D, Yamanaka R, Yamamoto T, Morita M (2009) Short-term effects of non-surgical periodontal treatment on plasma level of reactive oxygen metabolites in patients with chronic periodontitis. J Periodontol 80: 901–906.
  36. Tamaki N, Tomofuji T, Maruyama T, Ekuni D, Yamanaka R, et al (2008) Takeuchi R, Yamamoto T. Relationship between periodontal condition and plasma reactive oxygen metabolites in patients in the maintenance phase of periodontal treatment. J Periodontol 79: 2136–2142.
  37. Sakane N, Fujiwara S, Sano Y, Domichi M, Tsuzaki K, et al. (2008) Matsuoka Y, Hamada T, Saiga K, Kotani K. Oxidative stress, inflammation, and atherosclerotic changes in retinal arteries in the Japanese population; Results from the mima study. Endocrine Journal 55: 485–488.
  38. Christou K, Markoulis N, Mouslas AN, Pastaka C, Gourgoulianis KI (2003) Reactive oxygen metabolites (ROMs) as an index of oxidative stress in obstructive sleep apnea patients. Sleep and Breathing 7: 105–110.
  39. Komatsu F, Kagawa Y, Ishiguro K, Kawabata T, Purvee B, et al (2009) The association of very high hair manganese accumulation and high oxidative stress in Mongolian people. Curr Aging Sci 2: 28–42.
  40. Olinski R, Siomek A, Rozalski R, Gackowski D, Foksinski M, et al (2007) Oxidative damage to DNA and antioxidant status in aging and age-related diseases. Acta Biochim Pol 54: 11–26.
  41. Halliwell B (2007) Biochemistry of oxidative stress. Biochemical Society Transactions 35: 1147–1150.
  42. Martinović J, Dopsaj V, Kotur-Stevuljević J, Dopsaj M, Vujović A, et al. (2011) Oxidative stress biomarker monitoring in elite women volleyball athletes during a 6-week training period. J Strength Cond Res 25: 1360–1367. [crossref]
  43. Elosua R, Molina L, Fito M, et al. (2003) Response of oxidative stress biomarkers to a 16-week aerobic physical activity program, and to acute physical activity, in healthy young men and women. Atherosclerosis 167: 327–334.
  44. Knez WL, Coombes JS, Jenkins DG (2006) Ultra-endurance exercise and oxidative damage: Implications for cardiovascular health. Sports Med 36: 429–141.
  45. Bloomer RJ, Goldfarb AH (2004) Anaerobic exercise and oxidative stress: a review. Can J Appl Physiol 29: 245–263. [crossref]
  46. Radak Z, Taylor AW, Ohno H, Goto S (2001) Adaptation to exercise-induced oxidative stress: from muscle to brain. Exerc Immunol Rev 7: 90–107. [crossref]
  47. Kamezaki F, Yamashita K, Kubara T, Suzuki Y, Tanaka S, et al. (2008) Derivatives of reactive oxygen metabolites correlates with high-sensitivity C-reactive protein. J Atheroscler Thromb 15: 206–212.
  48.  Bloomer RJ, Fisher-Wellman KH (2008) Blood oxidative stress biomarkers: influence of sex, exercise training status, and dietary intake. Gend Med 5: 218–228. [crossref]
  49. Komatsu F, Kagawa Y, Sakuma M, Kawabata T, Kaneko Y, et al. (2006) Investigation of oxidative stress and dietary habits in Mongolian people, compared to Japanese people. Nutr Metab 7: 3–21.
  50. Gil-Agustí M, Esteve-Romero J, Carda-Broch S (2008) Anserine and carnosine determination in meat samples by pure micellar liquid chromatography. J Chromatogr A 1189: 444–450. [crossref]
  51. Chan KM, Decker EA (1994) Endogenous skeletal muscle antioxidants. Crit Rev Food Sci Nutr 34: 403–426.
  52. Wijeratne SS, Cuppett SL (2007) Soy isoflavones protect the intestine from lipid hydroperoxide mediated oxidative damage. J Agric Food Chem 55: 9811–9816.
  53. Erba D, Casiraghi MC, Martinez-Conesa C, Goi G, Massaccesi L (2012) Isoflavone supplementation reduces DNA oxidative damage and increases O-ß-N-acetyl-D-glucosaminidase activity in healthy women. Nutr Res 32: 233–240.
  54. Bazzoli DL, Hill S, DiSilvestro RA (2002) Soy protein antioxidant actions in active, young adult women. Nut Res 7: 807–815.
  55. Nielsen F, Mikkelsen BB, Nielsen JB, et al. (1997) Plasma malondialdehyde as biomarker for oxidative stress: Reference interval and effects of life-style factors. Clin Chem 43: 1209–1214.
  56. Asami S, Hirano T, Yamaguchi R, et al. (1998) Effects of forced and spontaneous exercise on 8-hydroxydeoxyguanosine levels in rat organs. Biochem Biophys Res Commun 243: 678–682.
  57. Ide T, Tsutsui H, Ohashi N, et al. (2002) Greater oxidative stress in healthy young men compared with premenopausal women. Arterioscler Thromb Vasc Biol 22: 438–442.
  58. Wactawski-Wende J, Schisterman EF, Hovey KM, Howards PP, Browne RW, et al. (2009) BioCycle Study Group. BioCycle study: design of the longitudinal study of the oxidative stress and hormone variation during the menstrual cycle. Paediatr Perinat Epidemiol 23: 171–84.

Level of Awareness about Emergency Contraception among Primary Health Care Centers Physicians in Prince Sultan Military Medical City, Riyadh, Saudi Arabia, 2019

Introduction

Unintended pregnancy (both unplanned and unwanted) is a frequent public health problem worldwide [1,2]. It is estimated that in the Middle East and North Africa (MENA) region, one in four pregnancies is unintended. It is leading to unsafe abortions and jeopardizing the health and wellbeing of women and their families [3,4]. Dramatically, the World Health Organization (WHO) estimated that one woman dies every eight minutes due to unsafe abortion in developing countries [5]. Emergency contraception (EC) plays a vital role in preventing unintended pregnancy on 98% of occasions if applied correctly. Consequently, it helps to reduce unintended childbearing and unsafe abortion, which are major problems affecting maternal health [6]. The knowledge about back-up support and use of emergency contraception (EC) is the most important factor to prevent unplanned or mistimed pregnancies. EC is a type of contraception which is indicated after unprotected intercourse, following sexual abuse, misuse, or nonuse of contraception [7]. It includes the use of Emergency sexual Contraceptive Pills (ESCP), and/or the insertion of Intrauterine Device (IUD) [8]. Emergency contraception pills (ECPs) are also known as ‘the morning after pill’, ‘interception’, ‘post-coital contraception’ or ‘vacation pill’. ECPs include the use of a high dose of combined oral contraceptive pills (COCs) containing Ethinyl estradiol and levonorgestrel (the Yuzpe regimen) or the use of a high dose of Progestin-Only Pills (POPs) containing levonorgestrel. ECPs are effective only if used within 72 hours after unprotected sex. The effectiveness of ECP is 75% in the case of COCs and 85% in the case of POPs. ECPs can prevent pregnancy by delaying or inhibiting ovulation, prevent implantation, fertilization or transport of the sperm or ovum. ECPs do not interrupt or abort an established pregnancy. Once implantation has occurred, ECPs are not any more effective. Thus, ECPs do not cause any form of abortion or bring about menstrual bleeding [9–11]. Insertion of the intrauterine device (IUD) within seven days of unprotected intercourse has been reported as a highly successful method of post-coital emergency contraception. It prevents fertilization through the effect of Cu ions on sperm function and prevents endometrial receptivity [12,13]. Over the past years, contraceptives are available and well known in the Arab region [14]. However, emergency contraception is not widely known, and it not very commonly used. Most of the international studies focused on women’s attitudes towards and barriers to EC use [15,16].) Only a few studies have been conducted in developing countries, especially the Muslim world [17,18]. The first step towards understanding the use of EC is assessing local physicians’ knowledge of the methods and willingness to prescribe them. Based on this, we conducted this study to assess the knowledge, attitudes, and practice of primary health care centers physicians towards EC use.

Literature Review

In a study published from Egypt in 2012, by Shaaban et al., it was found that specialists’ knowledge was significantly high regarding the three most commonly used methods of EC: combined oral contraceptive method, progesterone-only pills (plan B) method and IUCD. The results of this study showed that only 39.5% of obstetrics and gynecology specialists and 24.0% of GPs/family physicians’ specialists and GPs/family physicians had a favorable attitude toward EC. 39.5% of specialists and 26.6% of GPs/family physicians reported ever prescribing EC. The combined oral contraceptive method was the most commonly prescribed method by specialists at 31.5%and GPs/family physicians at 27.0%. Age and years of experience significantly affected the three outcome measures [19].

In a teaching hospital in Karachi, Pakistan 2009, Abdulghani et al. reported that majority (71%) of the Family Physicians, including faculty physician, residents, and medical officers were familiar with emergency contraception, while 42% were not sure about the mechanism. Barriers to EC use were identified as religious/ethical reasons, liability, teratogenicity, and inexperience. Overall attitudes regarding emergency contraception were positive [20]. Another study conducted in 2005 by Sahin et al., in Maternal–Child Health/Family Planning Centers located in the European region of Istanbul, it showed that 82.9% of the family-planning providers including physicians, nurses and midwives were aware of emergency contraception correct description, time of administration and correct dosage of different method. 60% of them had accurately described the intrauterine device as emergency contraception. Most participants reported positive attitudes towards the need and use of Emergency contraception [21].

A study published in Saudi Arabia titled “One other side Emergency contraception: Awareness, attitudes, and barriers of Saudi Arabian Women” by Karim et al., conducted among 242 women showed that only 6.2% of the participants had some knowledge of EC and only two of them had ever used it. Health care professionals were the least reported source of EC information (6.6%, 1/15). The majority (73.3%) had a negative attitude toward EC being available over-the-counter without a prescription. The most common barriers to EC use were concerns about possible health effects. Only two women (13.3%) considered religious belief as a major hindrance to EC use. This study revealed that Health care professionals were the least reported source of information, which is a cause for concern. The major barriers identified for this were concerns of women about the possible side effects of EC and its health consequences. The authors in this study recommended that health care professionals should be encouraged to provide appropriate counseling services related to reproductive health in their consultations tailored to the country-level characteristics, in light of the social norms and religious values [22]. Another study from Saudi Arabia aimed to determine the knowledge, attitude, and practice of EC among Saudi women of childbearing age. This study included 370 women, with a mean age of 32.3 ± 6.3 years. Of these, 31.6% knew how to prevent pregnancy after unprotected sex, and 62 knew about EC, 67.7% thought EC should be widely advertised, and 48.4% thought it should be made available even without a prescription. Almost 76% said that they were not shy to ask for EC, and 59.7% claimed that both partners should decide about the use of EC. The most common reason for not using EC was medical concerns. The authors in this study concluded that among Saudi women, knowledge, awareness, and EC use remain low, although a positive attitude for future EC use exists [23].

In Iran, there is a study that reported EC knowledge and attitude scores of 69.4 ± 11.8 and 70.1 ± 12.8, respectively among health care providers. The providers’ knowledge score was good only in 35%, but the vast majority (95.7%) had positive attitudes [24].

Aims and Objectives

In this study, we aimed to assess the Knowledge, attitude, and practice of health care centers physicians about the commonly used types of emergency contraception (EC) methods.

Methods

This was a descriptive cross-sectional study that has been conducted in 11 Primary Health Care Centers in Prince Sultan Military Medical City, which is in Riyadh at the center of Saudi Arabia. The study population included Primary Health Care Physicians who worked at Prince Sultan Military Medical City, Irrespective of nationality, gender, age or type of education.

The sample size was calculated by using the equation:

AWHC-19-139- Najla Mohammed Aodh_ Saudi Arabia_F1

With considering a confidence level of 95 and a confidence interval of 5, the total population approximately 182. The sample size was 110, and by adding 10% of non-response or missing data, it ended with a sample size of 121. Data were collected by two methods: self-administered questionnaire and online Google form. The study was conducted during the period from February to March 2019 by using the random sampling technique. The questionnaire was developed by the researcher and supervisor after reviewing the previous similar researches. The questionnaire consists of five parts; the first part includes questions regarding personal data and occupation history (age, gender, marital status, nationality, job position, and the number of years in practice). The second, third, and fourth parts include questions about emergency contraception knowledge, practice, and attitude; respectively. The fifth part includes perceived barriers.

The questionnaire was reviewed for validation by three expert consultants in Family Medicine. A pilot study was done among 20 primary healthcare physicians to assess the understanding of questions and feasibility of the questionnaire. The knowledge questions were scored 1 for a correct answer and 0 for an incorrect answer for each question, and the total knowledge was converted to a percentage score where it was considered satisfactory if > or =70% and unsatisfactory if <70%. For attitude questions; they were scored on a scale from 1 to 5; where strongly disagree was scored 5 and strongly agree was scored 1. The total score was converted to a percentage score where it was considered positive if > or =70% and negative if <70%.

Statistical Analysis

SPSS statistical package for the social sciences software, version 25 was used for the statistical analysis. All categorical variables were expressed as frequencies and percentage and continuous variables were expressed as mean and standard deviation (SD). Appropriate statistics were used for categorical and continuous data, by chi-square and student t-Test. To study the relation between knowledge, attitude, and practice, and also to analyze the relationship between knowledge, attitude and practice of EC with demographic characteristics and occupational history of physicians (e.g.; age, gender, nationality, number of years in practice and area covered by physicians). A p-value of < 0.05 was considered statistically significant.

Results

(Table 1) Slightly more than half (51.2%) of the sample were males, and around half (43.8%) were in the age group of 20–29. Around three quarters (76%) of the sample were Saudi, and (14%) were Egyptians. The majority (66.1%) were married and around a quarter (26%) of the sample were junior residents, while 21.5% were senior registrar, and 19.8% were senior residents. The highest percent (77.7%) had national highest qualification while 13.2% had international, but not Western qualification and only 9.1% had Western qualification. More than half of the sample (54.5%) had 0–5 years of experience, while around the third (28.1%) had 6–10 years. Around half of the sample (43%) had 6–7 sessions per week, while 39.7% had 8–10 sessions, and only 17.4% had 0–5 sessions. More than 94% of the sample mostly cover the General Clinic GB, while 58.7% mostly cover the General Clinic GW. Data is shown in table one.

Table 1. Demographic characteristics and occupational history of the studied physicians (n = 121).

Items

No.

%

Age(years):

20–29.

53

43.8

30–39.

44

36.4

40–49.

13

10.7

>=50.

11

9.1

Gender:

Male.

62

51.2

Female.

59

48.8

Nationality:

Saudi.

92

76.0

Egyptian.

17

14.0

Sudanese.

8

6.6

Bengalis, Pakistan, Jordanian, Syrian.

4

3.4

Marital status:

Single.

39

32.2

Married.

80

66.1

Widow.

2

1.7

Position in the medical profession:

Consultant.

11

9.1

Senior registrar.

26

21.5

Registrar.

22

18.2

Senior house officer.

6

5.0

Senior resident.

24

19.8

Junior resident.

32

26.4

Highest qualification achieved in:

National.

94

77.7

International, but not Western.

16

13.2

Western.

11

9.1

Years of experience:

0–5.

66

54.5

6–10.

34

28.1

11–20.

12

9.9

>20.

9

7.4

The number of sessions per week:

0–5.

21

17.4

6–7.

52

43.0

8–10.

48

39.7

The area covers most of the times:

General booked Clinic (GB).

114

94.2

General walk-in Clinic (GW).

71

58.7

Chronic Disease Clinic (CDC).

36

29.8

Antenatal Clinic (ANC).

36

29.8

Well Women Clinic (WWC).

11

9.1

Variable:

Mean

Standard deviation (SD)

Age:

33.60

9.08

Year of experience:

7.19

7.64

(Table 2) Nearly all (97.5%) of the studied sample heard about EC. The EC method most heard about was the Levonorgestrel method (plan B method) and the IUCD copper method with 84.3% followed by the Levonorgestrel method (split method) with 72.7% while the method least heard about was Ulipristal method with 28.1% of the participants. Data is shown in table two.

Table 2. Hear about emergency contraception and its methods among the studied sample (n = 121).

Hear about:

Yes.

No.

No.

%.

No.

%.

Emergency contraception.

118

97.5

3

2.5

Yuzpe method.

81

66.9

40

33.1

Levonorgestrel method (plan B method).

102

84.3

19

15.7

Levonorgestrel method (split method).

88

72.7

33

27.3

Ulipristal method.

34

28.1

87

71.9

IUCD copper method.

102

84.3

19

15.7

(Table 3) The most available EC method was the IUCD copper method with 60.3%, while the least available method was the Ulipristal method with only 5%. More than half of the sample was not sure about the availability of all methods. Data is shown in table three.

Table 3. Availability of emergency contraception methods.

Availability of emergency contraception methods:

Yes

No

Not sure

No.

%

No.

%

No.

%

Yuzpe method.

23

19.0

24

19.8

71

58.7

Levonorgestrel method.

39

32.2

26

21.5

53

43.8

Ulipristal method.

6

5.0

32

26.4

80

66.1

IUCD copper method.

73

60.3

15

12.4

30

24.8

(Table 4) The highest scored reasons for EC indication were unprotected sexual intercourse by 90.9%, followed by Condom breakage by 83.5% of the participants. The Majority (77.7%) of the participated physicians know the correct time of initiating oral EC methods, and most of them have never been trained on the use and application of EC. Data is shown in table four.

Table 4. Knowledge about emergency contraception among the studied sample (n = 121).

Knowledge items:

Correct answer

Incorrect answer

No.

%

No.

%

Pregnancy test necessary before prescribing EC.

56

46.3

65

53.7

Per-vaginal (PV) examination necessary before prescribing EC.

80

66.1

41

33.9

The (EC) acts as an abortifacient.

96

79.3

25

20.7

Indications of EC:

Condom breakage.

101

83.5

20

16.5

Rape.

91

75.2

30

24.8

Missed contraceptive pills.

82

67.8

39

32.2

Unprotected sexual intercourse.

110

90.9

11

9.1

Unintended pregnancy.

36

29.8

85

70.2

Failure of contraceptive use.

43

35.5

78

64.5

The correct time for the initiation of oral EC methods.

94

77.7

27

22.3

Oral EC that has proven effective for late intake.

17

14.0

104

86.0

EC method that interferes with fertilization and prevents implantation.

74

61.2

47

38.8

EC use discourages regular contraceptive-use.

88

72.7

33

27.3

Have you been trained in the use of and application of EC?

23

19.0

98

81.0

(Table 5) The results of the current study revealed that more than two thirds (67.8%) of the studied sample had unsatisfactory Knowledge about EC, while only 32.2% (less than the third) had satisfactory knowledge. Data is shown in table five.

Table 5. Levels of Knowledge about emergency contraception among the studied sample (n = 121).

Levels of knowledge:

No.

%

Satisfactory.

39

32.2

Unsatisfactory.

82

67.8

(Table 6) As shown in table six, most (87.6%) of the studied sample had not prescribed EC before, while only 12.4% did so. All those who prescribed EC before have prescribed it rarely. More than half of the sample (53.7%) have never done so, while 28.1% were not sure, and only 18.2% prescribed EC.

Table 6. Practices regarding emergency contraception among the studied sample (n=121).

Practices regarding emergency contraception

Answers

No.

%

Have you ever prescribed an EC?

Yes.

15

12.4

No.

106

87.6

If you have prescribed it before, how often typically prescribed the method?

Rare.

15

100.0

Would you refer a case to a gynecologist for the prescription of EC?

Yes.

22

18.2

No.

65

53.7

Not sure.

34

28.1

(Table 7) As shown in table seven, the item with the highest positive attitude was “Are you interested in learning more about EC with 57.9% strongly agree, and 33.9% agree, followed by benefits of EC outweigh the risks with 31.4% strongly agree, and 57% agree. On the other hand, the item with the highest negative attitude was “are you satisfied with your current knowledge of EC” with only 1.7% strongly agree and 13.2% agree. Most of the studied sample (38% strongly agree, and 43% agree) are in favor of the use of EC, and only 19% were either strongly agree or agree that they are uncomfortable with prescribing EC for religious/ethical reasons.

Table 7. Attitude towards emergency contraception among the studied sample (n = 121).

Attitude items:

Strongly agree

Agree

Neutral

Disagree

Strongly disagree

No.

%

No.

%

No.

%

No.

%

No.

%

1.     The benefits of emergency contraception (EC) outweigh the risks.

38

31.4

69

57.0

13

10.7

1

0.8

0

0.0

2.     Emergency contraception (EC) appropriate for discussion at routine consultation.

25

20.7

38

31.4

35

28.9

22

18.2

1

0.8

3.     Are you satisfied with your current knowledge of emergency contraception?

2

1.7

16

13.2

42

34.7

39

32.2

22

18.2

4.     Are you interested in learning more about emergency contraception (EC)?

70

57.9

41

33.9

8

6.6

2

1.7

0

0.0

5.     Do you think emergency contraception (EC) should be more widely advertised?

26

21.5

49

40.5

41

33.9

3

2.5

2

1.7

6.     Do you feel uncomfortable prescribing emergency contraception (EC) for religious/ethical reasons?

9

7.4

14

11.6

38

31.4

35

28.9

25

20.7

7.     Are you concerned about legal liability when you prescribe emergency contraception (EC)?

14

11.6

35

28.9

37

30.6

28

23.1

7

5.8

8.     Are you with the use of emergency contraception (EC)?

46

38.0

52

43.0

20

16.5

3

2.5

0

0.0

(Table 8) Overall, most (67.8%) of the studied sample had a positive attitude towards EC, while only 32.2% (less than the third) showed a negative attitude, as shown in table eight.

Table 8. Levels of attitude among the studied sample (n = 121).

Levels of attitude:

No.

%

Positive

82

67.8

Negative

39

32.2

(Table 9) There was a statistically significant difference between health care providers’ knowledge and attitude towards EC with a p-value of 0.002. Among those with unsatisfactory knowledge level, 41.5% have a negative attitude towards EC, while 58.5% showed a positive attitude. For those with a satisfactory level of knowledge, the percent of negative attitude was only 12.8%, while the majority (87.2%) have a positive attitude. Data is shown in table nine.

Table 9. Relation between knowledge and attitude towards emergency contraception among the studied sample (n=121).

Levels of knowledge:

Levels of attitude:

Chi-square

p-value

Positive.

Negative.

No.

%

No.

%

Satisfactory.

34

87.2

5

12.8

9.92

0.002*

Unsatisfactory.

48

58.5

34

41.5

*significant at p-value <0.05

(Table 10) As shown in table ten, there was no statistically significant difference between health care providers’ knowledge and practice of EC with the p-value was 0.2. Among those with satisfactory knowledge level, the percent of prescribed EC was only 17.9%, while the majority (82.1%) have not prescribed EC. For those with unsatisfactory knowledge level, 9.8% prescribed EC while 90.2% have not prescribed EC.

Table 10. The relation between knowledge and practice of emergency contraception among the studied sample (n = 121).

Levels of knowledge:

The Practice of EC:

Chi-square:

p-value:

YES

NO

No.

%

No.

%

Satisfactory.

7

17.9

32

82.1

1.63

0.2

Unsatisfactory.

8

9.8

74

90.2

(Table 11) There was no statistically significant difference between health care providers’ practice of and attitude towards EC since the p-value was 0.09. Among those with a Positive attitude, the percent of prescribed EC was only 15.9%, while the majority (84.1%) have not prescribed EC. For those with a negative attitude, 5.1% prescribed EC while 94.9% have not prescribed EC. Data is shown in table eleven.

Table 11. The relation between practice of and attitude towards emergency contraception among the studied sample (n=121).

Attitude

The Practice of EC:

Chi-square:

p-value:

Yes

No

No.

%

No.

%

Positive.

13

15.9

69

84.1

2.8

0.09

Negative.

2

5.1

37

94.9

(Table 12) As shown in table twelve, there was no statistically significant difference in levels of EC Knowledge by gender, nationality, marital status, position in the medical profession, place of highest qualification achieved and area covered by physicians since the p-value was more than 0.05.

Table 12. Demographic characteristics and occupational history According to Knowledge of emergency contraception among the studied sample (n = 121).

Items:

Level of knowledge

P-value:

Satisfactory

Unsatisfactory

No.

%

No.

%

Gender:

Male.

20

32.3

42

67.7

0.99

Female.

19

32.2

40

67.8

Nationality:

Saudi.

27

29.3

65

70.7

0.227

Non-Saudi.

12

41.4

17

58.6

Marital status:

Single.

8

20.5

31

79.5

0.084

Married.

31

38.8

49

61.3

Widow.

0

0

2

100

Position in medical profession:

Consultant.

1

9.1

10

90.9

0.066

Senior registrar.

13

50.0

13

50.0

Registrar.

10

45.5

12

54.5

Senior house officer.

2

33.3

4

66.7

Senior resident.

6

25.0

18

75.0

Junior resident.

7

21.9

25

78.1

Highest qualification achieved in:

National.

28

29.8

66

70.2

0.518

International, but not Western.

7

43.8

9

56.3

Western.

4

36.4

7

63.6

The area covers most of the times:

General booked Clinic GB.

36

31.6

78

68.4

0.403

General walk-in Clinic GW.

23

32.4

48

67.6

0.562

Chronic Disease Clinic CDC.

21

33.3

24

66.7

0.513

Antenatal Clinic ANC.

6

31.6

13

68.4

0.588

Well Women Clinic WWC.

4

36.4

7

63.6

0.498

Age (years)
Mean+ stander deviation.

34.36+8.264

33.24+9.475

0.530

leftYears of experience
Mean+ stander deviation.

7.179+6.613

7.195+8.125

0.992

leftNumber of sessions per week
Mean+ stander deviation.

6.821+2.846

6.988+2.401

0.737

(Table 13) As shown in table thirteen, Statistically significant results were obtained between the practice of EC with nationality (chi-square=17.13), position in the medical profession (chi-square=14.34), highest qualification achieved (chi-square=7.72), and area of specialization; being the highest among Non-Saudis, registrars, those with Western high qualifications, covering general walk-in clinic GW (chi-square=8.48), Antenatal clinic ANC (chi-square=7.63), and Well Women Clinic WWC (chi-square=6.40) with p-values of <0.05. The percentage of primary health care physicians who prescribed emergency contraception was 15/121 (12.4%). The percentages of Non-Saudi physicians and Saudi physicians who prescribed EC were 34.5% and 5.4%; respectively.

Table 13. Demographic characteristics and occupational history According to the practice of emergency contraception among the studied sample (n = 121).

Items:

The Practice of EC:

P-value:

Yes

No

No.

%

No.

%

Gender:

Male.

4

6.5

58

93.5

0.990

Female.

11

18.6

48

81.4

Nationality:

Saudi.

5

5.4

87

94.6

0.000*

Non-Saudi.

10

34.5

19

65.5

Marital status:

Single.

1

2.6

38

97.4

0.059

Married.

14

17.5

66

82.5

Widow.

0

0

2

100

Position in medical profession:

Consultant.

3

27.3

8

72.7

0.014*

Senior registrar.

1

3.8

25

96.2

Registrar.

7

31.8

15

68.2

Senior house officer.

1

16.7

5

83.3

Senior resident.

1

4.2

23

95.8

Junior resident.

2

6.3

30

93.8

Highest qualification achieved in:

National.

8

8.5

86

91.5

0.021*

International, but not Western.

3

18.8

13

81.3

Western.

4

36.4

7

63.6

The area covers most of the times:

General booked Clinic GB.

15

13.2

99

86.8

0.305

General walk-in Clinic GW.

14

19.7

57

80.3

0.004*

Chronic Disease Clinic CDC.

7

19.4

29

80.6

0.140

Antenatal Clinic ANC.

6

31.6

13

68.4

0.014*

Well Women Clinic WWC.

4

36.4

7

63.6

0.030*

Age (years)
Mean+ stander deviation.

43.666+10.540

32.179+7.934

0.530

Years of experience
Mean+ stander deviation.

15.400+10.048

6.028+6.503

0.992

Number of sessions per week
Mean+ stander deviation.

8.200+2.144

6.754+2.551

0.737

*significant at p-value <0.05

(Table 14) There was no statistically significant difference between attitude towards EC by gender, nationality, marital status, position in the medical profession, highest qualification, area covered (general booked clinic GB and Chronic Disease Clinic CDC) age, years and number of sessions per week since all p-values were >0.05. In contrast, a statistically significant difference (p-value <0.05) has been found between attitude towards EC and General Clinic walk-in GW (chi-square=5.40), Antenatal Clinic ANC (chi-square=4.86), Well Women Clinic WWC (chi-square=5.75). The percentages of primary health care physicians with a positive attitude who were covering General walk-in Clinic GW, Antenatal Clinic ANC, Well Women Clinic WWC were 76.1%, 89.5 %, and 100% respectively. Physicians with a positive attitude had a borderline (t-test=1.91, P 0.052) statistically significant higher mean (±SD) of years of experience compared to those with a negative attitude at 8.09+8.279 vs. 5.28+5.730; respectively. Data is shown in table fourteen.

Table 14. Demographic characteristics and occupational history according to attitude towards emergency contraception among the studied sample (n = 121).

Items:

Level of attitude:

P value:

Positive.

Negative.

No.

%

No.

%

Gender:

Male.

37

59.7

25

40.3

0.065

Female.

45

76.3

14

23.7

Nationality:

Saudi.

60

65.2

32

34.8

0.367

Non-Saudi.

22

75.9

7

24.1

Marital status:

Single.

22

56.4

17

43.6

0.130

Married.

58

72.5

22

27.5

Widow.

2

100

0

0

Position in medical profession:

Consultant.

7

63.6

4

36.4

0.060

Senior registrar.

23

88.5

3

11.5

Registrar.

17

77.3

5

22.7

Senior house officer.

4

66.7

2

33.3

Senior resident.

12

50.0

12

50.0

Junior resident.

19

59.4

13

40.6

Highest qualification achieved in:

National.

63

67.0

31

33.0

0.782

International, but not Western.

12

75.0

4

25.0

Western.

7

63.6

4

36.4

The area covers most of the times:

General booked Clinic GB.

78

68.4

36

31.6

0.403

General walk-in Clinic GW.

54

76.1

17

23.9

0.017*

Chronic Disease Clinic CDC.

21

58.3

15

41.7

0.110

Antenatal Clinic ANC.

17

89.5

2

10.5

0.021*

Well Women Clinic WWC.

11

100

0

0

0.016*

Age (years)
Mean+ stander deviation.

34.52+9.399

31.67+8.154

0.106

Years of experience
Mean+ stander deviation.

8.09+8.279

5.28+5.730

0.052

Number of sessions per week
Mean+ stander deviation.

7.036+2.550

6.72+2.543

0.522

*significant at p-value <0.05

(Table 15) The results of the current study highlighted that 82.6% of physicians participated in the current study perceived lack of knowledge as the most important barrier of EC. Cultural issues came in second place with 64.5% while patients’ acceptance was next with 35.5% and side effects of methods with 22.3%. Only 1.7% perceived unavailability in pharmacies as a barrier. Data is shown in table fifteen. Although nearly all the studied sample (97.5%) heard about EC, the knowledge about EC was moderate, with total knowledge of 58.5% and less than one-third of the sample had a satisfactory knowledge level. Participated physicians mostly did not hear about some EC methods such as the Ulipristal method.

Table 15. Perceived barriers of emergency contraception among the studied sample (n = 121).

Perceived barriers of EC:

No.

%

Lack of knowledge

100

82.6

Patients acceptance

43

35.5

Cultural issues

78

64.5

Side effects of methods

27

22.3

Discussion

The results of the current study are in accordance with previous similar studies [25–28], which have shown clear gaps in knowledge regarding emergency contraception among healthcare providers, including physicians. This might have an effect on the provision of emergency contraception as they are involved in management, and incomplete knowledge could delay timely scheduling or administration. On the other hand, such findings were in contrast with what has been reported from Lagos [29], where a high degree of awareness of and a largely favorable disposition toward emergency contraceptives among health care providers was shown. The copper IUD, being the most available EC method according to physicians participated in the current study, is by far the most effective option for EC; since a review of 42 studies showed that the pregnancy rate after insertion of the copper IUD for EC is less than 0.1% [30].

Lack of training on the use and application of EC was reported by most of the physicians, which reflects the shortage of dependable information on EC in Saudi Arabia. This was also previously reported from a similar study from Vietnam [31]. It seems that the gaining of EC knowledge during pre- and in-service education of healthcare providers in Saudi Arabia is not served. Additionally, most of the participants reported that they were unsatisfied with their current knowledge of emergency contraception. Proper training is urgently needed to ensure that physicians are knowledgeable enough with different methods of EC to prescribe it when the situation warrants.

A higher knowledge about EC will build up health care professionals’ capacity to provide accurate and effective information on EC to prevent unplanned and unwanted pregnancies. Similar studies in Korea and America found a significantly higher knowledge of EC among participants who had received education and formal content on EC [32,33]. As per the results of the current study, EC still remains a mostly underutilized option in unplanned pregnancy prevention. The knowledge gap is almost the main reason for both the health care providers, which can negatively impact the prescribing habits and future promotion of EC, and this is in agreement with the Sharma C study [34]. In disagreement with the Gupta R et al. study from India [35], the highest proportion of primary care physicians in our study “disagree” on the point “didn’t feel uncomfortable prescribing EC on religious or ethical grounds”.

According to the United Nations Fund for Population Activities (UNFPA 2013), emergency contraception acts on disrupting ovulation and reduces pregnancy likelihood. It cannot prevent fertilized egg implantation, harm a developing embryo, or end a pregnancy. Additionally, according to the WHO, there is no risk on the fetus if a pregnant woman uses the EC. Based on this, performing a pregnancy test before prescribing these methods is not necessary [36]. However, only less than half (46.3%) of participants in the current study had correct knowledge in this regard, a percentage which is considered lower compared to a rate of 67% that was reported by the study of Abdulghani and colleagues in Pakistan [25], and a rate of 94% in an Iranian study [37].

Nonetheless, the majority (79.3%) of the physicians in this study wrongly agreed that EC is an abortifacient which is far higher than the findings of Lee et al. in America [38], and Delaram and Rafie in Iran [39]. These are alarming findings, given that women seeking to use EC depend on healthcare providers for information. This emphasizes the need to broaden and provide detailed education on EC in medical training schools. Moreover, it was worrying about finding that the physicians participated in the current study believed EC use discourage usual contraceptives use, which is against the literature that does not support the argument that EC use discourages the use of other methods of contraception [40].

Compared to a previous similar study from Iran which reported that 95.7% of the health care providers had a positive attitude toward EC, the current study showed that 67.8% of the respondents have a positive attitude towards EC [37]. More than half of the participants felt that emergency contraception was an appropriate topic to discuss at routine consultation, a finding which is in contrast to the Pakistani study, where more than half of the participants felt that EC was not an appropriate topic to discuss at routine consultation. The largest percentage of the participants in our study were not uncomfortable because of religious reasons, which is different from the findings of previous research [25,41,42].

Lower levels of EC prescription have been reported from studies from developing countries. In Nairobi, Kenya, 15% of family-planning service providers reported having prescribed EC [43], and 20% of primary healthcare workers EC in Turkey [44,45]. These rates are even considered high compared to what we found in our study, where the prescription rate was 12.4%.

To the best of our knowledge, this is the first study conducted among primary health care physicians in this regard. Previous studies conducted among Saudi women and came up with the findings that the knowledge, awareness, and use of EC among Saudi women was low; however, a positive attitude for future EC use exists [46,47]. Though it is a small study with small sample size, further larger studies, at regional levels, can identify geographic and demographic gaps in EC practices. It would also be recommended to examine the knowledge and practices of other healthcare providers, including nurses and midwives, who may offer education to patients and communities about emergency contraception.

Conclusion

This study showed clear gaps in emergency contraception (EC) knowledge among primary healthcare physicians. Although the vast majority of the participants heard about EC, their knowledge was moderate, and less than one third had a satisfactory knowledge level. Most of the participants showed a positive attitude towards learning more about EC and also showed that they are with the use of EC. Educational programs that enhance and promote physicians’ awareness of and attitude toward emergency contraception is highly recommended.

Recommendations

Educational efforts should be focused on training of healthcare providers to improve correct access of women and effective use of different emergency contraception methods. Such educational efforts should focus on providing specific knowledge, with particular attention to correct common misconceptions about the EC methods. Providers should be encouraged to inform all potential users about the methods and to prescribe it to clients who require it. Communication about emergency contraception would also provide opportunities for counseling on long-term contraceptive needs. Discussion about emergency contraception should be raised during routine health check-up visits of women. Besides the use of different educational methods to enhance awareness and attitudes of providers, barriers for using EC should be identified, and trials to eliminate them should be done. Future research should be directed at implementing interventions to enhance these types of discussions.

Ethical Considerations

Ethical approval of research conduction from the Research Ethics Committee, Medical Services Department for Armed Forces was approved on 7 MARCH 2018 project no: 1043. It was an amendment and has been approved by the Research Ethics Committee on 09 April 2019. The verbal consent was taken from each physician after explained to them the aim and objectives of the study. The study did not include treatment or intervention for participants. Confidentiality was maintained during data collection and usage.

References

  1. Yazdkhasti M, Pourreza A, Pirak A, Abdi F (2015) Unintended Pregnancy and Its Adverse Social and Economic Consequences on Health System: A Narrative Review Article. Iranian Journal of Public Health 44: 12–21.
  2. JUVENILES AT RISK (2016) International Journal of Social Impact 1: 17.
  3. Roudi-Fahimi F, Monem AA (2010) Unintended pregnancies in the Middle East and North Africa (Washington, DC: PRB, 2010). Available from: http://www.Igwg.Org/pdf10/unintended pregnancies.Pdf. Accessed on 14.01.2013.
  4. Dabash R, Roudi-Fahimi F (2014) Abortion in the Middle East and North Africa population reference bureau. Available from: http://www.Prb.Org/pdf08/menaabortion.Pdf. Accessed on 27 Nov. 2014.
  5. World health organization. Unsafe abortion (2003) Global and regional estimates of the incidence of unsafe abortion and associated mortality in 2003. 5th edn. Geneva: World Health Organization; 2007. http://whqlibdoc.Who.Int/publications/2007/9789241596121_eng.Pdf.
  6. World Health Organization: Contraception: Issues in adolescent health and development. Geneva: World Health Organization; 2004. http://whqlibdoc.who.int/publications/2004/9241591447.
  7. Neinstein LS, Gordon MC, Katzman KD, Rosen SD, Woods RE (2008) Adolescent health care: a practical guide. Philadelphia: Lippincott Williams and Wilkins; Pg No: 533–649.
  8. Aksu H, Kucuk M, Karaoz B, Ogurlu N (2010) Knowledge and attitude of health care providers working in primary health care units concerning emergency contraception. Gynecol Obstet Invest 70: 179–185.
  9. Szarewski A, Guillebaud J (2002) Contraception: a user’s guide. 3rd Edn. New York: Oxford University Press.
  10. Mohammed S, Hossain I, Khan ME, Rahman M, Sabastian MP (2005) Emergency contraceptive pills. South East Asia Regional training manual USAID, Population Council Frontiers; Pg No: 19–30.
  11. Gemzell-Danielsson K (2010) Mechanism of action of emergency contraception. Contraception 82: 404–409.
  12. Mangiaterra V, Pendse R, Mclure K, Rosen J (2008) Adolescent pregnancy. Department of making pregnancy safer (MPS). WHO MPS note 2008: 1.
  13. Gemzell-Danielsson Kristina, Berger Cecia. PGL, Lalit Kumar (2013) Emergency contraception- Mechanism of action. Contraception 87: 300–308.
  14. Shaaban OM, Fathalla MM, Shahin AY, Nasr A (2011) Emergency contraception in the context of marriage in Upper Egypt. Int J Gynecology Obstet 112: 195–199.
  15. Shoveller J, Chabot C, Soon JA, Levine M (2007) Identifying barriers to emergency contraception use among young women from various socio-cultural groups in British Columbia, Canada. Perspect Sex Reprod Health 39: 13–20.
  16. Abbott J, Feldhaus KM, Houry D, Lowenstein SR (2004) Emergency contraception: what do our patients know? Ann Emerg Med 43: 376–381. [crossref]
  17. Marafie N, Ball D, Abahussain E (2007) Awareness of hormonal emergency contraception among married women in a Kuwaiti family social network. EJOG Reprod Biol 130: 216–222.
  18. El-Sabaa HA, Ibrahim AF, Hasan WA (2013) Awareness and use of emergency contraception among women of childbearing age at the family care centers in Alexandria, Egypt. J Taibah Univ Med Sci 8: 167- 172.
  19. Abdulghani H, Karim S, Irfan F (2009) Emergency Contraception: Knowledge and Attitudes of Family Physicians of a Teaching Hospital, Karachi, Pakistan. Journal of health, population and nutrition 27: 339–344.
  20. Ibrahim Z, Ahmed M, Shaaban M (2013) Knowledge, attitude and practice of emergency contraception among health care providers in Ismailia, Egypt. Middle East Fertility Society Journal 18: 246–252.
  21. Bildircin M, Sahin N (2005) Knowledge, attitudes and practices regarding emergency contraception among family-planning providers in Turkey. he European Journal of Contraception and Reproductive Health Care 10: 151–156.
  22. Karim SI, Irfan F, Al-Rowais N, Al-Zahrani B, Qureshi R, et al. (2015) Emergency contraception: Awareness, attitudes and barriers of Saudi Arabian Women. Pak J Med Sci 31: 1500–1505.
  23. Knowledge and attitude about emergency contraception among Saudi women of childbearing age. – PubMed – NCBI [Internet]. [cited 2019 Aug 5].Available from:  https://www.ncbi.nlm.nih.gov/pubmed/30911479
  24. Mohammad-Alizadeh-Charandabi S, Farshbaf-Khalili A, Moeinpoor R (2012) Emergency Contraception: Providers’ Knowledge and Attitudes and Their Relationship with Users’ Knowledge and Attitudes at Public Health Centers/Posts of Tabriz. J Caring Sci 1: 53–59.
  25. Abdulghani HM, Karim SI, Irfan F (2009) Emergency Contraception: Knowledge and Attitudes of Family Physicians of a Teaching Hospital, Karachi, Pakistan. J Health Popul Nutr 27: 339–344.
  26. Adekunle AO, Arowojolu AO, Adedimeji AA, Okunlola MA (2000) Emergency contraception: survey of knowledge, attitudes and practice of health care professionals in Ibadan, Nigeria. J ObstetrGynaecol 20: 284–289.
  27. Sable MR, Schwartz LR, Kelly PJ, Lisbon E, Hall MA (2006) Using the theory of reasoned action to explain physician intention to prescribe emergency contraception. Prespect Sex Reprod Health 38: 20–27.
  28. Ebuehi OM, Ebuehi OA, Inem V (2006) Health care providers’ knowledge of, attitudes toward and provision of emergency contraceptives in Lagos, Nigeria. IntFami-lyPlannPerspect 32: 89–93.
  29. Ebuehi OM, Ebuehi OAT, Inem V (2006) Health care providers’ knowledge of, attitudes toward and provision of emergency contraceptives in Lagos, Nigeria. IntFam Plan Perspect 32: 89–93.
  30. Cleland K, Zhu H, Goldstuck N, et al. (2012) The efficacy of intrauterine devices for emergency contraception: A systematic review of 35 years of experience. Human Reproduction 27: 1994–2000.
  31. Ngoc N, Ellertson C, Surasrang Y, Thai Loc L (1997) Knowledge and Attitudes about Emergency Contraception among Health Workers in Ho Chi Minh City, Vietnam. International Family Planning Perspectives 23: 68.
  32. Kang HS1, Moneyham L (2008) Use of emergency contraceptive pills and condoms by college students: a survey. Int J Nurs Stud 45: 775–783. [crossref]
  33. Lee CJ, Ahonen K, Apling M, Bork C (2012) Emergency contraception knowledge among nurse practitioner students. J Am Acad Nurse Pract 24: 604–611.
  34. Sharma C (2017). Understanding of emergency contraception among nursing staff in a tertiary care hospital of Andaman and Nicobar Islands, India. J Basic ClinReprod Sci 6: 133–136.
  35. Gupta R, Langer B, Singh P, Kumari R, Akhtar N, et al. (2018) Health care providers knowledge, attitudes and perceived barriers towards emergency contraception in a sub-Himalayan state of India. International Journal of Reproduction, Contraception, Obstetrics and Gynecology 7: 3244.
  36. World Health Organization Department of Repro-ductive Health and Research (WHO/RHR) (2008) Johns Hopkins Bloomberg School of Public Health /Center for Communication Program (CCP), Info Project.Family planning: a global handbook for providers. Baltimore and Geneva: CCP and WHO; PG No: 53.
  37. Mohammad-Alizadeh-Charandabi S, Farshbaf-Khalili A, Moeinpoor R (2012) Emergency Contraception: Providers’ Knowledge and Attitudes and Their Relationship with Users’ Knowledge and Attitudes at Public Health Centers/Posts of Tabriz. Journal of Caring Sciences 1: 53.
  38. Lee CJ, Ahonen K, Apling M, Bork C (2012) Emergency contraception knowledge among nurse practitioner students. Journal of the American Academy of Nurse Practitioners 24: 604–611.
  39. Delaram M, Rafie H (2012) Knowledge and attitudes of emergency contraception among medical sciences students. Futur Med Educ J 2: 9–13.
  40. Mohammed S, Abdulai A-M, Iddrisu OA (2019) Pre-service knowledge, perception, and use of emergency contraception among future healthcare providers in northern Ghana. ContraceptReprod Med [Internet] Jan 24 [cited 2019 Aug 4]: 4. Available from: https://www.ncbi.nlm.nih.gov/pmc/articles/PMC6345032/
  41. Corbett PO, Mitchell CP, Taylor JS, Kemppainen J (2006) Emergency contraception: knowledge and perceptions in a university population. J Am Acad Nurse Pract 18: 161–168.
  42. Xu X, Vahratian A, Patel DA, McRee AL, Ransom SB (2007) Emergency contraception provision: a survey of Michigan physicians from five medical specialties. J Women Health (Larchmt) 16: 489–498.
  43. Muia E1, Ellertson C, Lukhando M, Flul B, Clark S, et al. (1999) Emergency contraception in Nairobi, Kenya: knowledge, attitudes and practices among policymakers, family planning providers and clients, and university students. Contraception 60: 223–232. [crossref]
  44. Mandiracioglu A, Mevsim V, Turgul O (2003). Health personnel perceptions about emergency contraception in primary health-care centers. Eur J ContraceptReprod Health Care 8: 145–149.
  45. Bildircin M, Sahin NH (2005) Knowledge, attitudes and practices regarding emergency contraception among family-planning providers in Turkey. Eurp J ContraceptReprod Health Care 10:151–156.
  46. Journal of  Family Medicine and Primary Care – Knowledge and attitude about emergency contraception among Saudi women of childbearing age?: Download PDF [Internet]. [cited 2019 Aug 4]. Available from: http://www.jfmpc.com/downloadpdf.asp?issn=22494863; year=2019;volume=8;issue=1;spage=44;epage=48;aulast=Alharbi;type=2
  47. Karim SI, Irfan F, Rowais NA, Zahrani BA, Qureshi R, et al. (2015) Emergency contraception: Awareness, attitudes and barriers of Saudi Arabian Women. Pak J Med Sci 31: 1500–1505.

Compliance and Audit Necessary for Effective Statutes Protecting Student Athletes from TBI Related Injuries in California

Abstract

Awareness of mild traumatic brain injury in sports in the United States of America has had a dramatic increase in the past several years. This article cites recent developments in its increased awareness, and some recent legal developments regarding the medical condition. This commentary recommends an additional part of legislation the authors feel to be effective in protecting the susceptible.

Illustrating the Problem of TBI

Traumatic Brain Injury (TBI) is defined as a traumatically induced structural injury and/or physiological disruption of brain function as a result of an external force that is induced by new onset of at least one of the following clinical signs. Immediately following the event: any period of loss of decreased level of consciousness, any loss of memory for events immediately before or after the injury, any alteration in mental state at the time of the injury (confusion, disorientation, slow thinking), neurological deficits (weakness, loss of balance, change in vision, paresis/paraplegia, sensory loss aphasia that may or may not be transient), and/or intracranial lesion.

Traumatic brain injury is categorized as mild, moderate or severe depending on certain criteria. A mild categorization is determined when the structural imaging is normal, the loss of consciousness is ranges between 0-30 minutes, the alteration of consciousness ranges between a moment up to 24 hours, the post traumatic amnesia is less than or equal to 1 day, and the Glascow Coma Scale is between 13-15. A moderate categorization is determined when the structural imaging is normal or abnormal, the loss of consciousness exceeds 30 minutes but last less than 24 hours, the alteration of consciousness exceeds 24 hours, the post traumatic amnesia is greater than 1 day but less than 7 days, and the Glascow Coma Scale is between 9-12. A severe categorization is determined when the structural imaging is normal or abnormal, the loss of consciousness exceeds 24hours, the alteration of consciousness is analyzed under other criteria, the post traumatic amnesia exceeds 7 days, and the Glascow Coma Scale is between 3-8 [1].

 While Eighty-five percent of medically treated traumatic brain injuries are determined to be “mild”, this designation of “mild” is dangerously misleading because there is a small but significant subpopulation in this group that has persistent and catastrophic lingering effects. Binder & colleagues (2009 & 1997) [2,3], analyzed a meta-analysis of data from eight studies of long-term (3 months to many years after injury) effects of mTBI, and reported that approximately 8% of individuals remained symptomatic chronically and 14% had work-related disability2,3.  Binder and colleagues (2009 & 1997) [2,3] discussed a prior study by Bohnen et al (1994) [4], which emphasized that though the symptoms of mTBI are nonspecific, it is likely that the severity of the symptoms is greater after mTBI than in control subjects and some patients have cognitive deficits which are apparent only in particular stressful situations [2,3].

Not only is the finding of an mTBI injury potentially catastrophic, but the enormous incidence rates making it one of the most costly conditions in the USA. The incidence rate of mTBI in America is projected to be 1.5 million – 3.8 million annually. In the wider perspective of the world, the incidence is cited to be 9.5 million – 50 million per year. While a study by Rutland-Brown et al. (2006) [5] cited that the CDC estimated a total medical cost of $16.7 billion for mild TBI in the USA, these estimates overlook those who do not seek care in hospitals or emergency departments or choose not to seek care at all [5]. More importantly, medical costs are not the only costs incurred, as work loss costs have been estimated to be $69.2 billion and the value of lost quality of life is estimate to be $137 billion. Hence, the totality of costs suffered due to TBI in the USA alone is estimated to be $221 billion annually.

Proposed Legislative Remedies to Regulate TBI in Sports

A big impetus to this increased regulation and legislation was because of unfortunate consequence consequences of a TBI suffered by Zackery Lystedt, a 13 year old football player who was permanently disabled after sustaining a concussion in 2006 and prematurely returning to the game. Zackery Lystedt was a remarkable athlete who played both offense and defense on his junior high school football team. After tackling an opponent, Zackery’s head struck the ground. Despite the blow, he was back in the game by 3rd quarter. However, Zackery collapsed on the field and was airlifted to Harborview Medical Center where he underwent emergency surgery to remove the left and right site of his skull to relive the pressure from his injured and swelling brain. Although this procedure saved his life, he experience severe brain injury, spent seven days on a ventilator and spent three months in coma before he woke up in a his new reality. It was nine months before Zackery was able to speak his first words and nearly three years before he was able to stand with assistance. Today, Zackery continues to depend on a wheelchair and spends numerous hours each week in rehabilitation.

Three years following Zackery’s injury, in May 2009, the state of Washing passed a new bill referred to as the Lystedt Law, which protects young athletes from life threatening or potentially life-long consequences that can result from prematurely returning to the game following a concussion. The Lystedt Law requires any youth showing signs of a concussion to be examined and cleared by a licensed health care provider before the young athlete is allowed the return to play. Less than five years following Washington’s passing of the law, all 50 states and the District of Colombia have adopted the majority of the core principles of the Lystedt Law, making the Lystedt Law the fastest growing public safety initiative to become law in all states [6].

With the support of key national organizations, including the NFL, CDC, USA Football, and the United States Brain Injury Alliance, the Lystedts are striving to bring the law to the US Congress and establish the return to play safeguards are federal law.

Additional Protective Legislation in California

Assembly Bill No. 2127 was signed by the governor on July 21, 2014. This added section 35179.5 to the California Education code [7]. This legislation limits the amount of full contact practices as well as specific requirements in the care of athletes suspected of having a mild TBI. For example, section 49475 [8] of the California Education Code is amended to read:

49475 (a) If a school district, charter school, or private school elects to offer an athletic program, the school district, charter school, or private school shall comply with both the following:

  1. An athlete who is suspected of sustaining a concussion or head injury in an athletic activity shall be immediately removed from the athletic activity for the remainder of the day, and shall not be permitted to return to the athletic activity until he or she is evaluated by a licensed health care provider. The athlete shall not be permitted to return to the athletic activity until he or she receives written clearance to return to the athletic activity from a licensed health care provider. If the licensed health care provider determines that the athletic sustained a concussion or a head injury, the athlete shall also complete a graduated return-to-play protocol of no less than seven days in duration under the supervision of a licensed health care provider. The California Interscholastic Federation is urged to work in consultation with the American Academy of Pediatrics and the American Medical Society for Sports Medicine to develop and adopt rules and protocols to implement this paragraph.
  2. On a yearly basis, a concussion and head injury information sheet shall be signed and returned by the athlete and the athlete’s parent or guardian before the athlete initiates practice of competition.

b. A sued in this section, “licensed health care provider” means a licensed health care provider who is trained in the management of concussions and is acting within the scope of his or her practice.

c. This section does not apply to an athlete engaging in an athletic activity during the regular school-day or as part of a physical education course required to pursuant to subdivision (d) of Section 51220.

Comment

Although it is hoped that legislation, statutes, and laws are adhered to, without enforcement, at least intermittent enforcement seems to have a positive effect of compliance with laws.

The authors of this commentary feel that for this law to be as effective as hoped and should be, an audit of compliance should be written into the legislation on a yearly or every two years.  If non-compliance is found, Draconian measures such as forfeiture of wins, loss of championships, and cancelling of future schedules should be implemented to note the seriousness of the consequences of the violations of these statutes.

References

  1. Teasdale G, Jennett B (1974) Assesment of coma and impaired consciousness: a practical scale. Lancet 2: 81–84.
  2. Binder LM, Iverson GL, Brooks BL (2009) to err is human: “abnormal” neuropsychological scores and variability are common in health adults. Arch Clin Neuropsychol 24: 31–45.
  3. Binders LM (1997) A review of mild head trauma 2: Clinical implicaitons (review) J Clin Expt Neuropsychol 19: 432–457.
  4. Bohnen N, Twijnstra A, Jolles J (1993) Persistance of postconcussional symptoms in uncomplicated, mildly head-injured patients: a prospective cohort study. Neuropsychiatry Neuropsychol Behav Neurol 6: 193–200.
  5. Rutland-Brown W, Langlosi JA, Thomas KE, et al. (2003) Incidence of Traumatic Brain Injury in the United States. J Head Trauma Rehabilitation 21: 544–548.
  6. https://www.nlelaw.com/case-results/zackery-lystedt-law
  7. https://codes.findlaw.com/ca/education-code/edc-sect-35179-5.html
  8. https://law.justia.com/codes/california/2011/edc/title-2/49470-49475/49475/

Autoantibodies in Type-2 Diabetes having Neurovascular Complications Bind to the Second Extracellular Loop of the 5-Hydroxytryptamine 2A Receptor

Introduction

Diabetes is associated with a substantially increased risk of certain neurovascular and neurodegenerative complications, e.g. stroke, dementia, Parkinson’s disease, major depressive disorder [1], through complex and poorly-defined mechanisms. We previously reported the occurrence of activating 5-HT2A receptor IgG autoantibodies in plasma or serum from older adult diabetes suffering with major depressive disorder [2], Parkinson’s disease or dementia [3]. Acute neurite retraction and accelerated mouse neuroblastoma N2a cell death induced by the autoantibodies in cell culture was partially or completely prevented by co-incubation (of IgG autoantibodies) with selective antagonists of the 5-HT2A receptor [2,3].

The second extracellular loop region of several different G-protein coupled receptors lies adjacent to the receptors’ orthosteric binding pocket [4]. In subsets of human dilated cardiomyopathy [5] or in eclampsia [6], spontaneously- occurring auto antibodies which targeted the second extracellular loop region of the beta-1-adrenergic or the angiotensin II, type 1 receptor, respectively, caused G-protein coupled receptor activation. In the present study, we tested a hypothesis that IgG autoantibodies in older adult diabetes having angiopathic and/or neurodegenerative complications cause 5-HT2A receptor activation via binding to the second extracellular loop region of the 5-HT2A receptor.

The 5-HT2A receptor is highly expressed in specific brain regions underlying cognition, perception and mood regulation [7]. It is also expressed on vascular smooth muscle cells where it plays a role in the regulation of arterial vascular tone [8]. Autoantibodies targeting 5-HT2A receptors in the central nervous system and the peripheral vasculature could serve as a biomarker for complications associated with refractory hypertension (e.g. stroke, chronic kidney disease) and/or neurodegeneration (dementia, Parkinson’s disease, retinal degeneration).

Participants and Methods

Participants

Men and women enrolled in the Diabetes or Endocrinology clinics at the Veterans Affairs New Jersey Healthcare System (VANJHCS), East Orange and Lyons NJ signed an informed consent for VANJHCS Institutional Review Board-approved study participation prior to blood drawing.

Patient subgroups

Patient 1: A 57-year-old man with morbid obesity, type 2 diabetes, stage 3 Chronic Kidney Disease (CKD) and refractory hypertension who suffered a branch retinal vein occlusion and Transient Ischemic Attack (TIA). He underwent renal biopsy which revealed hypertensive glomerulosclerosis (Fig 1).

EDMJ 2019-118 - Mark Zimering USA_F1

Figure 1. Enzyme linked immunosorbent assay using the synthetic peptide Q..N-18 as the solid-phase antigen. Results are arbitrary absorbance units (OD) in a one-fortieth dilution of the protein-A eluate fraction of plasma or serum from patients with uncomplicated type 2 diabetes (N=6), Parkinsons disease (PD) (N=17), cerebrovascular accident (CVA) (N=7), major depressive disorder (MDD) (N=12) or dementia (N=7). Dashed line indicates background absorbance level of 0.04 absorbance units (dotted line).

Patient 2: A 72 -year-old man with twenty-year history of type 2 diabetes, discoid lupus erythematosus, and adult onset retinitis pigmentosa who had also suffered with a central retinal artery occlusion.

Patient 3: An 81 year-old-man who suffered with autoimmune thyroid disease and juvenile-onset retinitis pigmentosa (Stargardt disease). He has a ten-year history of type 2 diabetes without microvascular complications. Family history is positive for Stargardt disease in one brother.

Blood drawing

Blood was drawn in the morning in fasted participants.

Protein-A Affinity Chromatography

Protein An affinity chromatography was carried out as previously reported [2].

Synthetic peptide synthesis

A synthetic peptide having the amino acid sequence QDDSKVFKEGSCLLADDN, hereafter referred to as Q..N-18 or peptide 1, was synthesized at Lifetein Inc.(Hillsborough, NJ) and had > 92% purity. Q…N-18 had identical amino acid sequence to the region of the human 5-HT2A receptor comprising the second extracellular loop (ECL2) (Uniprot KB- P28223 [216 – 233] 5HT2A_Human). Three shorter overlapping peptides having the following amino acid sequences: QDDSKVF (peptide 3), VFKEGSC (peptide 4), SCLLADDN (peptide 2) were synthesized at Lifetein, Inc. and had purities > 96%. The latter three peptides were used in epitope analysis of the Q..N-18 (ECL2) region targeted for binding in subsets of human neurovascular pathologies’ autoantibodies.

Enzyme Linked Immunosorbent Assay (ELISA)

Ninety-six well plates were coated with the Q..N-18 peptide in PBS at a concentration of 65 micrograms/mL for two hours at 25 degrees C. The plates were washed three times with 0.1% Triton X-100 in PBS (PBS/Triton). Next the plate was blocked with 3% BSA in PBS for 1 hour at room temperature. Following 3 washes with PBS/Triton, 0.5–10 μg/mL concentrations of the patient IgG antibody (obtained by protein an affinity chromatography of plasma or serum) or a control sample was added to wells in duplicate and incubated for 1 hour at room temperature. The plate was washed 3× in PBS/Triton. Next HRP-conjugated goat anti human IgG (Sigma, St. Louis, MO) was added to each well at a 1: 3000 final dilution. After 1 h incubation, the plate was washed 3× in PBS/Triton. Next 150μL of a substrate solution containing 0.4 mg/mL ortho-phenylenediamine (Sigma, St. Louis, MO) and H2 O2 was added to each well and the reaction was monitored for color development. After 5 minutes, the reaction was stopped by the addition of 50μL 8 M H2 SO4 and the optical density was read at 490 nm in a microtiter plate reader (Dynatech Inc). Results are expressed as basal OD490 compared to wells to which PBS alone was added.

Mouse neuroblastoma N2 cells

N2A cells were generously provided by Dr. Smith Varia and Dr. Janet Alder (Department of Neurosciences, Rutgers-Robert Wood Johnson Medical School). The cells were cultured in DMEM with 10% fetal calf serum.

N2A Acute Neurite Retraction assay

Acute neurite retraction assay was performed as previously reported [2]

N2 cell survival assay

Cell survival assays were carried out as previously reported [2]

Chemicals

All chemicals (with the exception of synthetic peptides) were from Sigma Chem. Co, Inc.

Protein determinations

Protein assays were carried out as previously reported [2]

Results

Baseline clinical characteristics in the study patients

The baseline clinical characteristics are shown in Table 1. The study cohort included 49 older adults with type 2 diabetes mellitus (T2DM) and 7 older adults without diabetes. The patients without diabetes were slightly younger on average, but did not differ significantly from the diabetic patients in their mean body mass index 31.0 vs 34.9 kg/m2 (Table 2).

Table 1. Baseline clinical characteristics in the 56 study patients

Risk factor

Mean (SD)

N

Age (years)

68.3(9.0)

56

Non-diabetes * Type 2 Diabetes49

61.8(10.8)

7

Body mass index (kg/m2)

34.9 (6.8) 49

49

Glycosylated hemoglobin(%)

8.0 (1.6)

49

Duration of diabetes (years)

15.4 (8.2)

49

*Major depressive disorder (n=2), Parkinsons’disease (n=3), Schizophrenia (n=1), Graves ophthalmopathy (n=1)

Table 2. Comparison of age and body mass index in diabetic and non-diabetic patients.

Diabetes (n=49)

No Diabetes (n=7)

P-value

Age (years) 69.0 (7.2)

61.8(10.8)

0.04

Body mass index (kg/m2) 34.9(6.8)

31.0(3.0)

0.26

Mean binding to a linear synthetic 5-HT2A receptor peptide did not differ significantly in autoantibodies from Parkinson’s disease or major depressive disorder patients with or without type 2 diabetes (Table 3). These data suggest that the ‘susceptible’ population harboring increased 5-HT2A receptor peptide autoantibodies is likely to include older persons with and without type 2 diabetes mellitus.

Table 3.Mean 5-HT2A receptor peptide binding in diabetic vs nondiabetic patients having Parkinson’s disease or major depressive disorder.

Neurodegeneration

Diabetes

No Diabetes

P-value

Parkinson’s disease

0.13(.04) [14]

0.13(.05) [3]

0.85

Major depression

0.16(.06) [10]

0.12(.04) [2]

0.32

Results are mean absorbance units AU +/ (SD); [ ] number of patients

Increased 5-HT2AR synthetic peptide binding in protein-A eluates from subsets of diabetic angiopathy and/or neurovascular complications

A one-fortieth dilution of the protein-A eluate of plasma (2–8 µg/mL IgG) was tested for binding to the linear synthetic peptide Q…N-18 having an amino acid sequence identical to that of the second extracellular loop of human 5-HT2A receptor. Mean binding level was significantly increased (P < 0.01) in subsets of diabetes having Parkinson’s disease (n=17), dementia (n=7), stroke or TIA n=7), or major depressive disorder (n=12) compared to the mean level in age-matched older adult type 2 DM without significant angiopathy (i.e. retinopathy or nephropathy) (n=6; Fig 1). It was also significantly increased in diabetes patients with a coexisting systemic autoimmunity condition (i.e. discoid lupus erythematosus (n=1), ankylosing spondylitis (n=1), Graves orbitopathy (n=2), rheumatoid arthritis (n=1)) (Table 4). Mean binding in the protein-A eluate fraction of T2DM plasma (IgG) was significantly increased in patients having significant retinopathy vs. no retinopathy, or diabetic nephropathy vs. no nephropathy (Table 5). There was no significant difference in plasma IgG autoantibody binding level in T2DM patients with or without atrial fibrillation, T2DM with or without obstructive sleep apnea or T2DM with or without co-morbid cancer (Table 5). Taken together, these data suggest associations among diabetic angiopathy, neurodegenerative disorders and certain systemic autoimmune diseases with increased level of IgG autoantibodies that binds to 5-HT2A receptor, second extracellular loop region, and linear synthetic peptide.

Table 4. Mean 5-HT2A receptor peptide binding in type 2 diabetes without angiopathy vs diabetes with a neurodegenerative disorders or a co-morbid systemic autoimmune condition^^.

Mean receptor peptide binding

N

P-value*

Diabetes without angiopathy^

0.068(.01)

6 ——

Diabetes with dementia

0.11(.02)

7 < 0.01

Diabetes with PD**

0.13 (.04)

17 <0.01

Diabetes with MDD***

0.14(.05)

12 0.02

Diabetes with CVA or TIA

0.16(.04)

7 <0.01

Diabetes with Autoimmunity

0.18(.05)

5 <0.01

Results are mean AU +/- SD; ^- without any neurodegenerative disorder; ^^-N=1 each having discoid lupus erythematosus, ankylosing spondylitis, Graves disease, celiac disease, rheumatoid arthritis; *t-test compared to group having diabetes without angiopathy. PD-Parkinson’s disease, MDD-major depressive disorder, CVA-cerebrovascular accident, TIA-transient ischemic attack. ** includes 3 patients without diabetes; ***includes 2 patients without diabetes

Table 5. Association between5-HT2AR, ECL2 receptor peptide binding and baseline diabetic micro-vascular or other complications.

Present (N)

Absent (N)

Absent (N)

Diabetic retinopathy

0.15 +0.05(16)

0.10 +0.04(27)

0.002

Diabetic nephropathy

0.13+0.04 (21)

0.1 +0.04 (21)

0.006

Diabetic painful neuropathy

0.13 + 0.05 (21)

0.1 + 0.05 (19)

0.12

Atrial fibrillation

0.13 + 0.05(19)

0.13+ 0.05(34)

0.87

Obstructive sleep apnea

0.12 + 0.05(20)

0.12 + 0.05 (28)

1.0

Cancer

0.14 + 0.05(13)

0.12 + 0.05 (36)

0.13

Results are mean AU +/- SD; Patients having co-morbid systemic autoimmune condition (n=5) were excluded except in two cases having retinal neurodegeneration.

Lack of association between IgG plasma autoantibody binding to 5-HT2A receptor peptide and patient age or diabetes duration

There was no significant association between mean IgG autoantibody binding to the 5-HT2A receptor peptide and baseline patient age, body mass index, glycosylated hemoglobin, or duration of diabetes (data not shown in Tables).

Dose-dependence and titer of diabetic protein-A eluate binding to Q..N-18

Titer and potency of IgG autoantibody binding to the Q..-N-18 linear synthetic peptide was substantially increased in subsets of diabetes suffering with recurrent stroke, diabetes with co-morbid discoid lupus erythematosus and retinitis pigmentosa, diabetes having dementia, and diabetes with Parkinson’s disease. Peak binding and titer was not elevated in representative older type 2 diabetes without neurodegeneration and without significant angiopathy (i.e. retinopathy and nephropathy), i.e. < 2-fold above background absorbance at IgG concentrations tested between 1–2 µg/mL (Table 6).

Table 6. Potency and titer of receptor peptide autoantibodies in representative patients.

Diagnosis

Titer of autoantibody

Peak Binding (AU)

Retinitis pigmentosa & Discoid lupus erythematosus

0.37 µg/mL

0.25

DM, Refractory hypertension

2 µg/mL

0.17

DM, Dementia

0.4 µg/mL

0.14

DM, Parkinson’s disease

<1 µg/mL

0.10

DM without ND

1 µg/mL

0.07

DM without angiopathy

2 ug/mL

0.06

Absorbance units= 0.04 is background level. 1 µg/mL IgG ~ 6.7 nM.

ND– neurodegenerative disorder, DM– diabetes mellitus; Titer– concentration of autoantibodies causing ~50% of maximal binding.

Correlation of receptor peptide binding with IgG neurotoxicity (neurite retraction, N2A cell loss)

There was a significant correlation between 5-HT2A receptor synthetic peptide binding and acute N2A neurite retraction in the protein-A eluates from twenty-five patients tested (Fig 2) including representative patients from various pathologic subgroups (Table 7). High receptor peptide binding IgG was associated with significantly greater acute N2A neurite withdrawal (compared to low-binding IgG) at each of several different dilutions tested (Table 8).

EDMJ 2019-118 - Mark Zimering USA_F2

Figure 2. . Correlation between 5-HT2A receptor synthetic peptide binding and acute N2A neurite retraction in the protein-A eluates from twenty-five patients with neurovascular or neuropsychiatric complications. A 1/40th dilution of the protein-A eluate fraction was incubated with N2A cells and acute neurite retraction was determined as described in Materials and Methods. Results were correlated with binding to Q..N-18 in an ELISA using a 1/40th dilution of the protein-A eluate of serum or plasma.

EDMJ 2019-118 - Mark Zimering USA_F3

Figure 3. A 1/40th dilution of the Pt 1 refractory hypertension plasma autoantibodies(AAB) was incubated with N2A neuroblastoma cells alone (solid bar) or in the presence of a 20 µg/mL concentration of peptide 2 ((SCLLADDN), peptide 3 (QDDSKVF),or peptide 4 (VFKEGSC)(open bar). Results are (mean + SD) acute neurite retraction determined as described in Materials and Methods.

Table 7. Association between autoantibody- 5HT2ARreceptor peptide binding and autoantibody-induced acute neurite retraction by representative patient subgroup.

Diagnosis

Binding

Neurite retraction

*Diabetes without angiopathy (n=3)

.04

.06

.08

Dementia (n=2)

.15

.14

++

+++

Schizophrenia (n=4)

.08

.08

.10

.07

++

++

++

Major depressive disorder (n=2)

.14

.23

++

+++

Parkinsons Disease (n=7)

.14

.19

.10

.15

.19

.21

.09

+++

+++

++

++++

++++

+++

+

Stroke (n=2)

.18

.25

+++++

+++++

*Neurite retraction scale: % neurite shortening after 5 minutes’exposure to autoantibodies , i.e. 0–10% = (-); 11–24% (+); 25–33% (++); 34–50% (+++); 51–74% (++++); 75–85% (+++++).

Table 8. Dose-dependent, increased autoantibody-induced neurite retraction in DM having neurodegeneration or cancer vs. DM without neurodegeneration or cancer

Receptor Peptide

Autoantibody Dilution

Diagnosis

Binding (AU + SD)

1/40th

1/60th

1/100th

1/200th

PD(1),

Stroke(2),

High binders

Prostate cancer (1)

(0.21 + .03)

72+ 13 %^

44+ 6%*

33%

25%

Schizophrenia (1),

Low binders

20+ 12 %

13 +10%

NR

NR

uncompl DM (2)

(0.06 + .01)

Results are mean+ SD % neurite retraction after 5 minutes exposure to indicated dilution of autoantibodies; NR- nodetectabeneurite retraction. ^ P <0.002; * P < 0.02– compared to neurite retraction at same autoantibody dilution in low peptide binding IgG autoantibodies subgroup; AU- absorbance units, SD-standard deviation.Uncomplicated diabetes mellitus- without microvascular complications.

‘High- binding’ IgG caused significantly greaterN2a neuron loss (after 24 hours incubation) than an identical concentration of ‘low-binding’ IgG (Table 9). Taken together these data suggest that IgG autoantibody binding to the linear synthetic 5-HT2A (ECL2) receptor peptide is correlated with IgG autoantibody-induced N2A neurite retraction and accelerated N2A neuron loss.

Table 9. Association between autoantibody- receptor peptide binding and autoantibody-induced accelerated N2A neuron loss.

Low-binding (N=7)

High-binding (N=5)

P-value

Absorbance (AU)

0.08 + 0.019

0.22 + 0.04

< 0.001

% N2A cell survival

91.7 + 5.9%

66.4 + 9.1%

< 0.001

Results are mean +/- SD. Neuron survival was determined after 24 hours incubation as described in Materials and Methods.

Soluble ECL2 peptide inhibits DM autoantibody-induced N2A neurite retraction

An 18-mericlinear synthetic peptide (Q..N-18) having an identical amino acid sequence to the ECL2 of the 5-HT2A receptor dose-dependently inhibited mouse N2A neuroblastoma cell neurite retraction induced by a sixty Nano molar concentration of the protein-A eluate fraction of plasma from Patient 1 type 2 diabetes suffering with refractory hypertension, retinal vein occlusion, and transient ischemic attack (TIA). The Patient 1 refractory hypertension autoantibodies alone caused 90% neurite retraction in N2a cells (Table 10). Half-maximal inhibition of autoantibody-induced acute neurite retraction occurred at a 2 µg/mL concentration of Q..N-18, corresponding to ~ 1 µM concentration of the peptide (Table 10).

Table 10. Dose-dependent inhibition of autoantibody-induced acute N2A neurite withdrawal by co-incubation with 18-meric Q..N linear synthetic peptide Autoantibody (one sixtieth dilution) + (Q…N-18) at

Diagnosis

(0 µg/mL)

(3 µg/mL)

(5 µg/mL)

DM, refractory hypertension (N=1)

90 + 5%

25 + 7%

0 + 0%

The indicated concentration of theQ..N-18 linear synthetic 5HT2A receptor peptide was co-incubated with a 100 nM concentration of the Patient 1, diabetes (DM) refractory hypertension autoantibodies. Acute N2A neurite retraction was assessed after 5 minutes as described in Materials and Methods.

Epitope mapping of region within 5-HT2AR, ECL2 peptide targeted by autoantibodies

We next performed epitope ‘mapping’ of the region within the second extracellular loop region of 5-HT2A receptor targeted by the type 2 diabetes and neurodegenerative pathologies’ autoantibodies. Each of three short overlapping ECL2-region peptides was preincubated alone (for 5 minutes) with N2A cells prior to the addition of Patient 1, refraction hypertension IgG autoantibodies. Peptide 3or4 (at 20 µg/mL concentration) had no significant effect on Patient 1IgG autoantibody-induced neurite withdrawal. Peptide 2(20µg/mL) dose-dependently nearly completely prevented acute neurite retraction induced by the Patient 1, refractory hypertension IgG autoantibodies (Table 11).

Table 11. Identification of a short linear peptide that blocks autoantibody (IgG)-induced neurite retraction.

Treatment

Mean acute N2A neurite retraction (%)

DM, refractory hypertension IgG*

100 + 0%

Pt1 IgG + Peptide 3 (QDDSKVF)

87+ 19%

Pt1 IgG + Peptide 2(SCLLADDN)

5 + 5%*

Pt1 IgG + Peptide 4(VFKEGSC)

88 + 13%

*A one-fortieth dilution of the Pt 1 diabetic refractory hypertension IgG autoantibodies was incubated in the presence or absence of a 20 µg/mL concentration of three different short linear synthetic peptides comprising portions of the second extracellular loop of 5-HT2A receptor. Results are mean +/SD acute N2A neurite retraction after 5 minutes. Peptide 2 (20 µg/mL) was associated with 95% protection against the diabetic stroke pathologies IgG-induced neurite retraction. Peptide 3 or Peptide 4 at identical (20 µg/mL) concentration had no significant protective effect on IgG autoantibody-induced N2A neurite retraction.

Sub region-specific 5-HT2AR, ECL2 peptide protects against autoantibody neurotoxicity

A brief pre incubation with Peptide 2 (20 µg/mL) nearly completely prevented (99%) IgG-induced acute neurite withdrawal induced by a 50–100nM concentration of pathologies’ IgG autoantibodies in ten of ten patients tested (Table 12).

Table 12. Neutralization of diabetic autoantibody-induced N2A acute neurite retraction by a linear synthetic short peptide contained within the 5-HT2A receptor ECL2, i.e. Peptide 2.
Acute N2A neurite retraction in IgG autoantibodies

Pathologies Autoantibodies (N=10)

(without Peptide 2)

(with Peptide 2)

P-value

Dementia (2), PD(3), Stroke(2), Schizophrenia(3)

33% + 8%

0.25% + 0.75%

< 0.001

ECL2- second extracellular loop region of 5-HT2A receptor; PD-Parkinson’s disease

Co-incubation with peptide 2 (20 µg/mL) completely protected N2A cells from accelerated neuron loss caused by a1/100th dilution of Patient 1, refractory hypertension IgG autoantibodies (Table 13). After 16 hours’ incubation (at 37 degrees C) with Patient 1 or the IgG autoantibodies from four different patients suffering with stroke, Parkinson’s disease, dementia or major depressive disorder, peptide 2 (20 µg/mL) afforded substantial neuro protection against accelerated neuron loss (Table 14).

Table 13. Neutralization of diabetic IgG-induced accelerated N2A cell loss by Peptide 2, a short linear synthetic peptide corresponding to a portion of 5-HT2AR second extracellular loop region.

Pathology

Pt 1 IgG alone

Pt 1 IgG + Peptide 2

P-value

DM refractory HTN (n=1)

57 + 3%

100+ 4%

0.005

A 1/100th dilution of the diabetes (DM) refractory hypertension (HTN), plasma IgG autoantibodies was incubated for 16 hours in the presence or absence of a 20 µg/mL concentration of the linear synthetic peptide, Peptide 2. Results are mean +/- (SD) percent of basal N2A neuroblastoma cell survival.

Table 14. Neutralization of diabetic (IgG) autoantibody-induced accelerated N2A cell loss by Peptide 2, a short linear synthetic peptide corresponding to a portion of 5-HT2AR, ECL2.

Diagnosis(N=5)

IgG alone

IgG + Peptide 2

P-value

Stroke(2), PD(1), Dementia(1), MDD(1)

64 + 21%

94 + 11%

0.03

Results are mean +SD N2A cell survival after 16 hours incubation of the indicated diabetic pathologies IgG autoantibodies in the presence or absence of 20ug/mL Peptide 2. PD-Parkinson’disease, MDD-major depressive disorder.

In silico test of 5-HT2A receptor peptide’s binding affinity for major histocompatibility complex class II (MHC-II) molecules

We used the Immune Epitope Database (IEDB) and an improved prediction tool [9] to test whether a portion of the Peptide 2 amino acid sequence corresponds to an ‘immune epitope,’i.e. a sequence which displays significant binding affinity to one or more alleles comprising MHC class II,HLA‐DR, HLA‐DQ, or HLA‐DP molecules. The 15-meric linear peptide sequence(s) SKVFKEGSCLLADDN which includes Peptide 2 (underlined) was tested for binding to MHC class II molecules. There was no significant high affinity binding to alleles comprising the HLA‐DR or HLA‐DP loci. The core amino acid sequence, KEGSCLLAD displayed significant binding affinity (i.e. Ka217nM), to one specific HLA-DQ allele, DQA10102-DQB10602.

Discussion

Type 2 diabetes is not an autoimmune disease. Yet the present data suggest humoral immune responses to the 5-hydroxytryptamine (serotonin) 2A receptor in subsets of older adult obese type 2 diabetes suffering with diabetic macular edema, and proteinuric nephropathy. Aging, diffuse vascular injury and visceral obesity may each contribute to humoral immunity to the 5HT2A receptor. A role for chronic inflammation and hemodynamic factors is suggested by the observation of significantly increased ECL2 receptor peptide binding in subsets of patients with nephropathy and chronic kidney disease. The high prevalence of increased 5-HT2A receptor peptide binding in autoantibodies from patients suffering with Parkinson’s disease (14/17), major depression (9/12), stroke (6/7), and dementia (4/7), is unlikely to represent ‘non-specific binding’ since autoantibody binding (in the ELISA) was significantly associated with both autoantibody-induced neurite retraction and accelerated N2A cell loss. The correlation between receptor peptide binding and neurotoxicity demonstrated here suggests that neurovascular IgG autoantibody binding to the5-HT2AR second extracellular loop causes receptor activation which as previously reported was positively coupled to PLC/IP3/Ca2+ and RhoA/ROCK signaling pathway activation[2,3].

The second extracellular loop region loop lies in close proximity to the Orthosteric Binding Pocket (OBP) [4] and has a role in preventing normal constitutive receptor activation in biogenic and trace amine G-Protein Coupled Receptors (GPCRs) [10]. Neurovascular pathologies’ autoantibodies appeared to target a conserved sub region in ECL2 [10] important in promoting sustained activation of the 5HT2B and 5HT2A receptors by the hallucinogenic drug Lysergic Acid Diethylamine (LSD) [4]. In a recent study by Wacker et. al. [4], the atomic structure of LSD complexes to the 5-HT2B and -2A receptors was reported. Lysergic acid diethylamide-known to have long-lasting effects in humans-exhibited unusually long residence times at the 5-HT-2B and -2A receptors, i.e. off-reaction times of ~ 45 minutes and ~220 minutes, respectively [4]. Wacker and co-authors reported that amino acid residues 207–214 in 5-HT2BR form a ‘lid’ which blocks the opening to the orthosteric binding pocket likely accounting for LSD’s prolonged off-reaction time at the receptor [4]. Of interest, seven of the eight amino acid residues comprising the inhibitory Peptide 2 sequence SCLLADDN (underlined here) form the corresponding ‘lid’ region in the 5-HT2A receptor, including the conserved amino acid residue, leucine 229 (bolded), which is present in all three 5-HT2 (-A, -B, and -C) receptor isoforms [10] One of the striking features of the neurovascular pathologies’ autoantibodies effect in N2A cells was its long duration of action, i.e. neurite retraction was essentially irreversible after 45 minutes’ or longer observation times. Serotonin or the 5HT2A receptor agonist DOI promoted neurite retraction which peaked after (3–5 minutes) and was reversible at longer times [3]. Taken together with the structural data on the LSD bound 5-HT2R [4], these data suggest that neurovascular autoantibodies may binding at a critical region in the second extracellular loop involved in stabilizing a ‘persistently-active’ conformation of the 5HT2A receptor.

Systemic autoimmunity is associated with a wide variety of autoantibodies capable of targeting diverse auto antigens. In the present study, highest binding to the 5-HTR2AR linear synthetic peptide occurred in two patients with a systemic autoimmune condition, i.e. discoid (cutaneous) lupus erythematosus (Pt 2) or HLAB27- positive ankylosing spondylitis. Heparan Sulfate Proteoglycans (HSPG) is among a small group of overlapping auto antigens reported in both systemic lupus erythematosus [11] and ankylosing spondylitis [12]. Heparan sulfate proteoglycans are strongly anionic at physiologic pH. They are abundantly expressed in extracellular matrix and on vascular and neuronal surfaces where they have role(s) in the maintenance of tissue barriers and serve as low-affinity co-receptors for cationic ‘heparin-binding’ growth factors, e.g. basic fibroblast growth factor (FGF-2) [13]. Neurotoxic and endothelial cell inhibitory autoantibodies previously reported in subsets of diabetes complicated by painful neuropathy, nephropathy, macular edema or primary open angle glaucoma [14] displayed increased affinity for heparan sulfate proteoglycan [14] or a heparin Sepharose column [15]. Glomerular HSPG are elaborated in diabetic nephropathy [16], and may be a target of heightened humoral autoimmunity especially under conditions of chronic inflammation which prevail in chronic kidney disease.

The putative dominant epitope targeted by 5-HT2A receptor activating autoantibodies in the present study contains a di-aspartic acid motif (SCLLADDN) not present in the 5-HT2B receptor [10]. It is interesting to speculate that the negative charge(s) associated with having di-aspartic acid residues in a solvent-exposed region of the receptor may provide a basis for strong electrostatic interaction with circulating IgG pathologies autoantibodies. In a prior report, neurotoxicity in diabetic dementia and PD dementia IgG autoantibodies was enhanced eight-fold following chromatography of plasma on a dextran sulfate affinity chromatography column [2]. Dextran sulfate (Liposorber) apheresis issued to lower excessive concentrations of cationic lipoprotein particles (very low density, and low-density lipoproteins) in the circulation in patients with familial hypercholesterolemia. It is possible that neurovascular pathologies autoantibodies co-purified with cationic lipoprotein particles based on having similar cationic surface charge characteristics which may contribute to an electrostatic interaction with anionic sulfate groups.

Prostate expresses high level of HSPG [17] which acts as a co-receptor for several different fibroblast growth factors having key role(s) in stromal proliferation underlying prostate cancer progression [18]. Among nine patients in the present study who had co-morbid prostate (n=8) or bladder (n=1) cancer, the mean level of 5-HT2AR autoantibody peptide binding was 0.14 AU, i.e. 3.5-fold higher than background (0.04 AU). Eight of the nine prostate or bladder cancer patients suffered with a neurodegenerative (n=5 PD, n=1 dementia) or neuropsychiatric disorder (N=1 MDD, N=1 schizophrenia). In most of these patients, the cancer diagnosis and treatment was established prior to the onset of neurologic or neuropsychiatric disease manifestations perhaps consistent with a paraneoplastic mechanism for humoral autoimmunity to 5-HT2A receptor activating autoantibodies. In a prior report, prostate cancer autoantibodies in patients suffering with fatigue/depression were highly neurotoxic and evoked large increases inward cationic current in (whole-cell patch clamped) rat hippocampal pyramidal neurons associated with long-lasting desensitization of excitatory synaptic inputs [14]. Taken together with the present data, these findings suggest that 5-HT2A receptor found on cortical pyramidal neurons or in other brain regions may mediate glutamatergic excitatory post-synaptic actions in response to 5-HT2A receptor- activating autoantibodies [19].

A short linear synthetic peptide comprising a region of the second extracellular loop of the 5HT2A receptor, i.e. peptide 2, largely prevented autoantibody- induced neurotoxicity perhaps by competing for binding to the region of the 5-HT2R targeted by a majority of the autoantibodies tested. The peptide antagonist (SCLLADDN) retained its neuro protective effect (against autoantibody-induced N2A cell loss) even after 16 hours’ incubation time (at 37 degrees C) in the presence of 10% fetal calf serum. A hallmark property of an auto antigen’s immune dominant epitope is its ability to survive complete intracellular proteolytic processing [20]. Our in silico analysis suggests that Peptide 2 having the sequence SCLLADDN may comprise an immune dominant peptide which is specifically ‘recognized’ by the major histocompatibility complex class II molecular system through high affinity binding interaction with the specific HLA-DQ allele, DQA10102-DQB10602. Of interest, DQA10102-DQB10602 was previously reported to have conferred markedly increased susceptibility to narcolepsy-cataplexy in certain populations [21]. Narcolepsy is a putative neurodegenerative process affecting hypocretin neurons located in the lateral hypothalamus [22]. Narcolepsy incidence rates in young adults were reported to have peaked following the 2009 H1N1 influenza pandemic [23] and related H1N1 vaccination regimes [24] suggesting molecular mimicry with certain strains of influenza viruses as one possible mechanism for T-cell driven auto immunity in the unknown etiology of a subset of ‘autoimmune’ narcolepsy-cataplexy in HLA-DQ susceptible persons [25].

Highest level of 5-HT2AR, ECL2 autoantibody binding, i.e. 6.25 times above background, occurred in an older man (Patient 2) having discoid lupus erythematosus, and near blindness secondary to central retina artery occlusion and retinitis pigmentosa. It is of interest that 5-HT2AR immune reactivity was reported on the terminals of photoreceptors and bipolar cells in rabbit retina [26]. In addition, 5-HT2AR antagonists afforded protection against light-induced photoreceptor degeneration in certain susceptible genetic strains of mice [27]. Plasma autoantibodies in Patient 3, an 81 year-old-man who suffered with autoimmune thyroid disease and juvenile-onset retinitis pigmentosa (i.e. Stargardt disease), displayed significantly increased binding (2.5-fold background) in the ELISA. Taken together, these data suggest systemic autoimmunity in which humoral autoantibodies are directed against many different autoantigen epitopes might provide a humoral-mediated mechanism contributing to retinal degeneration occurring in genetically-susceptible patients. The 5-HT2AR ECL2 peptide-based ELISA might be useful in screening family members of affected patients suffering with genetic forms of retinal degeneration. More in vivo study of the antagonist peptide is needed to determine whether it might be neuro protective in an animal model of retinal degeneration.

The source(s) of 5-HT2AR autoantigen in angiopathic type 2 diabetes is not known. Obese diabetes is associated with increased inflammation and the latter is associated with higher risk of thrombosis. Since 5-HT2AR is expressed on platelets, it is possible that diabetic microangiopathy predisposes to micro thrombi formation at sites of inflammation which may cause 5HT2A receptor to be taken up and processed by macrophages and/or other professional antigen presenting cells. Monocytes have been reported to adhere to platelets at sites of inflammation via specific interactions not observed between platelets and other subtypes of white blood cells [28].

Our study was cross-sectional and included mostly older men. More longitudinal study in diverse (unselected) populations is needed to estimate the actual prevalence of 5-HT2AR- activating autoantibodies and whether a dose-response relationship may exist between the autoantibodies and one or more kind of neurodegenerative disorder.

In summary, the present data provide the first evidence that subsets of major depressive disorder, Parkinson’s disease, dementia, small vessel stroke (e.g. retinal artery occlusion), refractory hypertension, and proteinuric nephropathy (in both diabetes and obese non-diabetic older persons) harbored IgG autoantibodies which bound to a region of the second extracellular loop of the human 5HT2A receptor [4] previously implicated in causing long-lasting receptor activation.

References

  1. Hu G (2007) Type 2 Diabetes and the Risk of Parkinson’s Disease. Diabetes Care 30: 842–847.
  2. Zimering MB (2018) Circulating Neurotoxic 5-HT2A Receptor Agonist Autoantibodies in Adult Type 2 Diabetes with Parkinson’s Disease. J Endocrinol Diabetes 5.
  3. Zimering MB (2017) Diabetes Autoantibodies Mediate Neural- and Endothelial Cell- Inhibitory Effects Via 5-Hydroxytryptamine- 2 Receptor Coupled to Phospholipase C/Inositol Triphosphate/Ca2+ Pathway. J Endocrinol Diabetes 4.
  4. Wacker D, Wang S, McCorvy JD, Betz RM, Venkatakrishnan AJ, et al. (2017) Crystal Structure of an LSD-Bound Human SerotoninReceptor. Cell 168: 377–389.
  5. Holthoff HP, Zeibig S, Jahns-Boivin V, Bauer J, Lohse MJ, et al. (2012) Detection of anti-β1-AR autoantibodies in heart failure by a cell-based competition ELISA. Circ Res111: 675–684.
  6. Dechend R, Gratze P, Wallukat G, Shagdarsuren E, Plehm R, et al.( 2005) Agonistic autoantibodies to the AT1 receptor in a transgenic rat model of preeclampsia. Hypertension 45: 742–746.
  7. Xu T, Pandey SC (2000) Cellular localization of serotonin (2A) (5HT (2A)) receptors in the rat brain. Brain Res Bull 51: 499–505.
  8. Alsip NL, Harris PD, Durrani GE (1991) Multiple Serotonin Receptors on Large Arterioles in Striated Muscle. J Vasc Res 28: 537–541.
  9. Jensen KK, Andreatta M, Marcatili P, Buus S, Greenbaum JA, et al. (2018) Improved methods for predicting peptide binding affinity to MHC class II molecules Immunology 154: 394–406.
  10. Michino M, Beuming T, Donthamsetti P, et al. (2015) What Can Crystal Structures of Aminergic Receptors Tell Us about Designing Subtype-Selective Ligands? Pharmacol Rev 67: 198–213
  11. Shibata S, Sasaki T, Harpel P, Fillit H (1994) Autoantibodies to vascular heparan sulfate proteoglycan in systemic lupus erythematosus react with endothelial cells and inhibit the formation of thrombin-antithrombin III complexes. Clin Immunol Immunopathol 70: 114–123.
  12. Wright C, Sibani S, Trudgian D, Fischer R, Kessler B, et al. (2012) Detection of multiple autoantibodies in patients with ankylosing spondylitis using nucleic acid programmable protein arrays. Mol Cell Proteomics 11: 00384.
  13. Bernfield M, Sanderson RD (1990) a developmentally regulated cell surface proteoglycan that binds extracellular matrix and growth factors. Philos Trans R Soc Lond B Biol Sci 327: 171–186
  14. Zimering MB, Alder J, Pan Z, Donnelly RJ (2011) Anti-endothelial and anti-neuronal effects from auto-antibodies in subsets of adult diabetes having a cluster of microvascular complications. Diabetes Res Clin Pract 93: 95–105.
  15. Zimering MB, Anderson RJ, Moritz T, Ge L (2009) Investigators for the VADT Low plasma basic fibroblast growth factor is associated with laser photocoagulation treatment in adult type 2 diabetes mellitus from the Veterans Affairs Diabetes Trial. Metabolism 58: 393–400
  16. Makino H, Ikeda S, Haramoto T, Ota Z (1992) Heparan sulfate proteoglycans are lost in patients with diabetic nephropathy. Nephron 61: 415–421.
  17. Kosir MA, Quinn CC (1995) Sorting of heparan sulfate proteoglycan into matrix compartments of prostate adenocarcinoma cells. J Surg Res 58: 46–52.
  18. Wu X, Kan M, Wang F, Jin C, Yu C, et al. (2001) A rare premalignant prostate tumor epithelial cell syndecan-1 forms a fibroblast growth factor-binding complex with progression-promoting ectopic fibroblast growth factor receptor 1.Cancer Res 61: 5295–5302.
  19. Aghajanian GK, Marek GJ (1997) Serotonin induces excitatory postsynaptic potentials in apical dendrites of neocortical pyramidal cells. Neuropharmacology 36: 589–599.
  20. Kim A, Sadegh-Nasseri S (2015) Determinants of immunodominance for CD4 T cells. CurrOpin Immunol 34: 9–15.
  21. Mignot E, Lin L, Rogers W, Honda Y, Qiu X, Lin (2001) Complex HLA-DR and -DQ interactions confer risk of narcolepsy-cataplexy in three ethnic groups. Am J Hum Genet 68: 686–699.
  22. Nishino S, Ripley B, Overeem S, Lammers GJ, Mignot E (2000) Hypocretin (orexin) deficiency in human narcolepsy. Lancet 355: 39–40.
  23. Nohynek H, Jokinen J, Partinen M, Vaarala O, Kirjavainen T, et al. (2012) S03 adjuvanted AH1N1 vaccine associated with an abrupt increase in the incidence of childhood narcolepsy in Finland. PLoS One 7: 33536.
  24. Han F, Lin L, Warby SC, Faraco J, Li J, et al (2011) Narcolepsy onset is seasonal and increased following the 2009 H1N1 pandemic in China. Ann Neurol 70: 410–417.
  25. Black JIII, Avula R, Walker D, Silber M, KrahnL, et al. (2005) HLA DQB1*0602 positive narcoleptic subjects with cataplexy have CSF IgG reactive to rat hypothalamic protein extract. Sleep 28: 1191–1192
  26. Pootanakit K, Prior KJ, Hunter DD, Brunken WJ (1999) 5-HT2a receptors in the rabbit retina: potential presynaptic modulators. Vis Neurosci 16: 221–230.
  27. Chen Y, Okano K, Maeda T, Chauhan V, Golczak M, et al.(2012) Mechanism of all-trans-retinal toxicity with implications for stargardt disease and age-related macular degeneration. J Biol Chem 287: 5059–5069.
  28. Passacquale G, Vamadevan P, Pereira L, Hamid C, Corrigall V, et al (2011) Monocyte-platelet interaction induces a pro-inflammatory phenotype in circulating monocytes. PLoS One 6: 25595.

Schizophrenia Plasma Autoantibodies Promote ‘Biased Agonism’ at the 5-Hydroxytryptamine 2A Receptor: Neurotoxicity is Positively Modulated by Metabotropic Glutamate 2/3 Receptor Agonism

Abstract

Aims: To test whether neurite-inhibitory plasma autoantibodies in chronic schizophrenia activate Gq/11- and Gi- coupled signaling pathways downstream of 5-hydroxytryptamine 2A receptor activation; and for modulation of serotonergic signaling by the metabotropic 2/3 receptor agonist LY379268.

Methods: Plasma from five older adults with chronic schizophrenia and eight age-matched patients having another neuropsychiatric, immune or metabolic disorder was subjected to Protein-A affinity chromatography to obtain IgG autoantibodies. Mean neurite retraction (5 minutes) or cell survival (24 hours) was determined in mouse N2A neuroblastoma cells incubated with autoantibodies in the presence or absence of specific antagonists of the Gq/11/PLC/IP3R signaling pathway, Gi-coupled, beta-arrestin2-directed pathways, or LY379268.

Results: Chronic schizophrenia plasma autoantibodies- mediated dose- and time-dependent acute N2A neurite retraction was completely prevented by M100907, a selective 5-hydroxytryptamine 2A receptor antagonist. LY379268 promoted autoantibody-induced neurite retraction causing a shift-to-the-left in the dose-response curve. Antagonists of the RhoA/Rho kinase and Gq/11/PLC/IP3R signaling pathways blocked autoantibody-mediated neurite retraction. Chronic schizophrenia plasma autoantibodies mediated increased N2A cell survival which was blocked by LY379268, pertussis toxin, and antagonists of PI3-kinase- mediated survival signaling.

Conclusion: Schizophrenia plasma autoantibodies activate the 5-hydroxytryptamine 2A receptor positively coupled to Gq/11/PLC/IP3R pathway and RhoA/Rho kinase signaling activation in promoting acute N2A cell neurite retraction. Autoantibodies in a subset of patients experiencing hallucinations promoted increased N2A cell survival mediated (in part) via a pertussis-toxin sensitive, Gi-coupled, PI3-kinase-dependent mechanism. Positive modulation of 5-HT2AR-mediated neurite retraction by LY379268 suggests the autoantibodies may target (in part) the 5-HT2AR/mGlu2R heteromer.

Introduction

The serotonin 2A receptor (5-HT2AR) is highly expressed in cortical brain regions underlying normal perception [1]. The hallucinogenic drug lysergic acid diethylamine (LSD) causes long-lasting 5-HT2AR activation which is positively coupled to Gq/11- and β-arrestin-2- dependent signaling pathway activation [2]. Head twitch in mice infused with the hallucinogenic (reversible 5HT2AR agonist) 1-[2,5-dimethoxy-4-iodophenyl]- 2-aminopropane (DOI) required an additional contribution from metabotropic glutamate (mGlu)2R-mediated, Gi-coupled signaling since head twitch was not observed in DOI-treated mice harboring an mGlu2R knock-out mutation [3]. Heteromeric 5-HT2AR/mGlu2R complexes occur in the mammalian prefrontal cortex [4] and are thought to integrate serotonergic and glutamatergic signals via allosteric receptor-receptor interactions alters the balance between Gq11- and Gi-coupled signaling pathway activation [4].

Paranoid schizophrenia is a common disabling disease affecting ~1% of adults [5]. Evidence from epidemiologic studies [6] and a recent genome-wide association study [7] suggests a role for dysregulated acquired immunity in the pathophysiology of schizophrenia. A possible role for brain reactive autoantibodies was suggested by prior studies [6] including our report that plasma IgG autoantibodies in a subset of chronic schizophrenia potently suppressed neurite outgrowth and mediated strong depolarization in N2A mouse neuroblastoma cells [8]. Since major depression and Parkinson’s disease autoantibodies mediated long-lasting 5-HT2A receptor activation positively coupled to Gq/11 signaling [9,10], here we tested whether chronic paranoid schizophrenia plasma autoantibodies activate 5-HT2A receptor, Gq/11-mediated signaling leading to neurite outgrowth inhibition in N2A mouse neuroblastoma cells. A role for signaling cross-talk involving 5-HT2AR/mGlu2R heteromers was tested by comparing N2A acute neurite retraction induced by schizophrenia plasma autoantibodies in the presence or absence of the mGlu2/3R agonist LY379268. Since LY379268 was previously reported to suppress hallucinogen-induced Gi-coupled signaling at the 5HT2AR [4], we investigated biased 5-HT2AR-dependent, Gi-coupled signaling evoked by autoantibodies from subgroups of psychosis-prone vs. patients not experiencing recurrent visual or auditory hallucinations.

Participants and Methods

Participants– Outpatient men ranging in age from 47–78 years old provided informed consent for participation in the Institutional Review Board-approved study and were consecutively enrolled from the diabetes and endocrinology clinics at the Veterans Affairs New Jersey Health Care System (East Orange and Lyons, New Jersey).

Psychosis-prone patients

Patient 1: A 61- year- old man with a history of chronic paranoid schizophrenia and multiple recurrent hospitalizations for auditory hallucinations and one previous suicide attempt. The patient has type 2 diabetes mellitus of approximately eight years duration without microvascular complications.

Patient 2: A 55- year- old man with chronic paranoid schizophrenia, three previous suicides attempts, and type 2 diabetes (of five years known duration) without microvascular complications.

Patient 3: A 61-year-old man having major depressive disorder with mood-incongruent psychotic features and type 2 diabetes of fourteen years duration.

Patient 4: A 47-year-old man with chronic schizophrenia, and no history of type 2 diabetes. He had paranoid delusions without any suicide attempt.

Blood samples: Blood was drawn in the morning after an overnight fast. Plasma or serum was stored at -20 C.

Protein A affinity chromatography- Protein-A affinity was performed as previously described [10].

N2A mouse neuroblastoma cells: were cultured in Dulbecco’s modified Eagles medium (DMEM) containing 10% fetal calf serum. Cells were fed with fresh medium every 1–2 days, except for survival assays in which fresh medium was not added for up to 5 days prior to the addition of test autoantibody fractions.

Acute neurite retraction assay: % of basal neurite length in N2A cells expressing one or more proximally-located dendrite-like process was determined after interval exposure to test substances as previously reported [10].

N2A cell survival: MTT assay was performed 24 hours after incubation with test substances as previously reported [10].

Chemicals: all chemicals were obtained from Sigma, Co., Inc. (St Louis, MO), except YM-254890 (Focus Biomolecules) and LY 379268 (Tocris Bioscience).

Protein assay: protein concentration was determined using a modified bichichonic acid assay (Bio Rad. Inc.).

Statistics- Paired and unpaired T-tests were used to assess for statistically significant differences between groups or between treatments.

Results

Baseline characteristics in the study patients

The clinical characteristics in the study patients are shown in (Table 1). Patients having chronic schizophrenia did not differ significantly in their mean age, body mass index or glycosylated hemoglobin level from patients having Parkinson’s disease (n=5), dementia (n=1), or diabetic nephropathy (n=1).

Table 1. Clinical characteristics in the study participants

Diagnosis

Age (years)

HbA1c (%)

BMI (kg/m2)

Schizophrenia (n=5)

61.4 + 9.7

7.0 + 1.1

31.7 + 8.1

PD or Other (n=7)

70.6 + 5.5

7.2 + 1.4

33.1 + 6.2

Diabetes without MVD (n=2)

77.5 + 6.1

7.2+ 0.2

33.5 + 5.3

*Parkinsons disease (PD) (n=4), major depressive disorder (n=1), diabetic nephropathy (n=1), dementia (n=1). MVD- microvascular disease.

Acute N2A neurite retraction from schizophrenia plasma IgG fractions

Schizophrenia plasma autoantibodies (at IgG concentrations > 10 nM) caused dose-dependent N2A neurite retraction which significantly exceeded neurite retraction in an identical concentration of IgG from two older adult type 2 diabetes patients without microvascular, neuropsychiatric or neurodegenerative complications (Figure 1A). Neurite retraction in response to potent schizophrenia plasma autoantibodies, e.g. Pt 1, was linear, irreversible and more than 50% neurite withdrawal occurred after 5 minutes’ exposure time (Figure 1B).

A

EDMJ 2019-117 - Mark Zimering USA_F1a

B

EDMJ 2019-117 - Mark Zimering USA_F1b

Figure 1. A) Dose-dependent or B) time-dependent acute neurite retraction induced by diabetic schizophrenia plasma autoantibodies (solid bars; Pt 1) or (A) by the autoantibodies from two older diabetic patients not suffering with diabetic microvascular complications or any neuropsychiatric or neurodegenerative complication (open bars). Results represent mean + SE determined as described in Materials and Methods. B) Similar results were obtained in the plasma autoantibodies from all five of five schizophrenia patients tested.

Schizophrenia (SCZ) plasma autoantibody-induced neurite retraction was completely prevented by co-incubation with a two-hundred nanomolar concentration of the selective 5HT2A receptor antagonist, M100907 (Table 2). Slightly higher concentrations (500 nM) of the 5-HT2A receptor antagonists spiperone and ketanserin afforded significant protection (~50–80%) against SCZ plasma autoantibody-induced neurite retraction (Table 2). A higher concentration (1–10 µM) of selective antagonists of the endothelin A, angiotensin type 1, alpha-1-adrenergic and 5HT2B receptors (all Gq/11-coupled GPCRs) i.e. bosentan, losartan, prazosin and SB204741, did not significantly protect (0- 28%) against schizophrenia plasma IgG-induced neurite retraction (Table 2).

Table 2. Pharmacology of schizophrenia plasma autoantibody(AutoAB)-induced neurite retraction

Antagonist%

AutoAB-induced

+ AutoAB (20 nM)

[Concentration]

Receptor

neurite retraction

M100907

200 nM

5HT2AR

0 + 0%

Spiperone

500 nM

5HT2AR

17 + 6%

Ketanserin

500 nM

5HT2AR

43 + 11%

SB204741

1 µM

5HT2BR

100 + 0%

Bosentan

10 µM

ETAR

94 + 7%

Losartan

10 µM

AT1R

72 + 8%

Prazosin

1 µM

A1AR

72 + 10%

A twenty nanomolar concentration of the Pt 1 schizophrenia protein-A eluate fraction of plasma was incubated with N2A cells in the presence or absence of the indicated concentration of each Gq/11, GPCR antagonist. Results are the mean +/- SD of two experiments

Mechanism of schizophrenia plasma IgG-induced neurite retraction

Major depressive disorder and Parkinson’s disease plasma IgG autoantibodies were previously reported to cause acute N2A neurite retraction through a mechanism involving activation of the RhoA/Rho kinase and PLC/IP3R/Ca2+ signaling pathways [9,10]. In the present study, neurite retraction induced by SCZ plasma IgG autoantibodies was completely prevented by co-incubating N2A cells with a ten micromolar concentration of the selective Rho kinase inhibitor Y27632 or a one micromolar concentration of the selective Gq11 inhibitor Y254890 (Table 3). In addition, a one micromolar concentration of the phospholipase C inhibitor U73122, and a 50 micromolar concentration of the IP3R antagonist 2-APB each significantly protected (72–83%) against SCZ IgG-induced neurite retraction (Table 3). Taken together, these data suggest that SCZ IgG induced neurite retraction likely involves activation of both RhoA/Rho kinase and Gq/11/PLC/IP3R/Ca2+ signaling pathways.

Table 3. Mechanism of acute N2A neurite retraction induced by schizophrenia plasma AutoAB

Treatment

Conc

% of AutoAB-induced neurite retraction

SCZ IgG (N=2) alone

40 nM

100 + 0%

AutoAB + Y27632 (ROCK inhibitor)

10 uM

0 + 0%

AutoAB + 2-APB (IP3R antagonist)

50 uM

17 + 1.9%

AutoAB + U73122 (PLC inhibitor)

1 uM

28 + 15%

AutoAB + YM-254890 (Gq11 inhibitor)

1 uM

0 + 0%

A forty nanomolar concentration of the Pt 1 or Pt 2 schizophrenia plasma autoantibodies (AutoAB) was incubated in the presence or absence of the indicated concentration of RhoA/Rho kinase (ROCK) inhibitor, or individual antagonists of the Gq11/PLC/IP3R signaling pathway. Results are (mean +/- SD) acute N2A neurite retraction occurring in response to Pt 1 or Pt 2 IgG autoantibodies.

Modulation of SCZ IgG-induced neurite retraction by LY379268, a potent mGlu2/3R agonist

Cross-signaling between Glu2/3R and 5HT2AR was inferred from differences in IgG-induced N2A acute neurite retraction occurring in the presence or absence of the mGlu2/3R agonist LY379268, at 5–10 µM concentrations (of LY379268) which alone had no effect on neurite retraction. The mGlu2/3R agonist LY379268 was previously reported to cause positive allosteric modulation of the 5HT2AR protomer affinity at 5HT2AR/mGlu2R heteromers [4]. A one microgram per milliliter concentration (~ 7 nM) of the potent Pt 1, SCZ plasma IgG autoantibodies caused 50% inhibition of N2A neurite outgrowth (Figure 2A). Pre-incubation (for 5 minutes) followed by co-incubation of N2A cells with a 10 micromolar concentration of LY379268 caused a ‘shift to the left’ in the dose-response curve of the Pt 1 plasma IgG-induced neurite retraction: 50% inhibition of N2A neurite outgrowth occurred at substantially lower, i.e.~ 0.5 microgram per milliter concentration (3.5 nM) of Pt 1 IgG autoantibodies (Figure 2A). The “potentiating effect” of 10 µM LY379268 on neurite retraction was more pronounced at low concentrations of SCZ plasma IgG ranging from (3.5–14 nM) (Figure 2A). Presumably, at these lower concentrations a high proportion of unoccupied 5HT2A receptors are available to undergo positive allosteric modulation via mGlu2R protomer binding to LY379268. The dose-response curve for DOI-induced neurite retraction underwent a ‘shift- to-the-left’ in the presence of (10 µM) LY379268: the concentration of DOI needed to evoke 25–30% neurite inhibition decreased from 10 µM (in the absence of LY379268) to 5 uM in the presence of LY379268 (Figure 2B). A saturating concentration of the reversible 5-HT2AR agonist DOI (20 µM) caused 40% peak neurite retraction compared to 50% neurite retraction induced by an ~2000-fold lower concentration (7 nM) of potent SCZ plasma IgG autoantibodies (Figure 3).

A

EDMJ 2019-117 - Mark Zimering USA_F2a

B

EDMJ 2019-117 - Mark Zimering USA_F2b

Figure 2. A) Diabetic schizophrenia Pt plasma autoantibodies or B) the hallucinogen DOI was incubated at the indicated concentrations in the presence (orange symbol) or absence (blue symbol) a 10 micromolar concentration of LY379268 in N2A cells. Each point represents mean acute neurite retraction which varied by < 10%. A) Similar result was obtained in the diabetic schizophrenia Pt 2 plasma autoantibodies.

EDMJ 2019-117 - Mark Zimering USA_F3

Figure 3. Schizophrenia plasma autoantibodies (Pt 1, 2) was incubated with a micromolar concentration of LY379268 alone (solid bars) or with (open bars) a two-hundred nanomolar concentration of the selective 5-HT2AR antagonist M100907 in N2A cells. Results are mean + SE as described in Materials and Methods.

LY379286-potentiated SCZ plasma IgG autoantibody-induced neurite retraction was significantly prevented by co-incubation with the highly selective 5HT2AR antagonist M100907 (500 nM) suggesting mGlu2/3R agonism enhanced neurite retraction via 5HT2AR-dependent signaling. One possibility is that an mGlu2/3R agonist increased 5HT2AR receptor affinity for SCZ plasma IgG autoantibodies via a heteromeric receptor-receptor interaction as was previously reported for mGlu2/3 agonist action at the 5HT2AR/mGlu2R complex [4].

Potentiation of 5HT2AR- mediated neurite retraction (by a 10 µM concentration of LY379268) was observed in the IgG autoantibodies from twelve patients tested including: chronic paranoid schizophrenia (n=5), Parkinson’s disease (n=5), dementia (n=1) and diabetic nephropathy (n=1). The mean level of neurite retraction (induced by an IgG concentration which alone caused~ 50% retraction) was significantly increased in the presence of 10 µM LY379268 (74 + 10% vs 52 + 7%; P < 0.001; n=12) (Table 4).

Table 4. Mean N2A neurite retraction induced by neurovascular pathologies’ AutoAB in the presence or absence of (7.5–10 µM) LY379268, a selective mGlu2/3R agonist

Pathologies (N=12)

Mean [IgG].

Pt IgG.

Pt IgG + LY379268

P-value

Schizophrenia (5), PD(4),

17 + 6 nM

52 + 7%^

74 + 10%^

< 0.001

Other (3)

^ Mean acute N2A neurite retraction (after five minutes’ incubation) in the presence of the indicated mean concentration of plasma autoantibodies (protein-A eluate fraction) with or without a 7.5–10 µM concentration of the mGlu2/3R agonist LY379268.

Other pathologies: n=1 dementia, n=1 diabetic nephropathy, n=1 major depressive disorder

Balanced Gq/11- and Gi/o-coupled signaling in response to SCZ plasma IgG autoantibodies

Second generation anti-psychotic medications, e.g. clozaril, risperodone, exhibit high affinity binding to 5-HT2AR and bias 5-HT2AR signaling in favor of Gi- coupled pathways [11]. They also bind less avidly to the dopamine 2 receptor, D2R [11]. The reversible 5-HT2AR hallucinogenic agonist DOI biases signaling in favor of Gq/11 [12]. Yet the irreversible 5-HT2AR agonist LSD, and serotonin and its psychoactive metabolites promotes a mix of Gi- and Gq/11 coupled signaling [2, 12]. Psychosis can occur in subsets of major depressive disorder and in ~50% of Parkinson’s disease patients. We next investigated whether the ability to evoke survival promotion in N2A cells might differentiate autoantibodies in a subset of psychosis-prone patients and the mechanisms underlying autoantibody-induced N2A survival promotion.

Plasma IgG autoantibodies in Patients 1, 2, 4 having chronic schizophrenia (10 µg/mL) caused dose-dependent increased N2A cell survival compared to an identical concentration of IgG autoantibodies from four patients with either MDD (n=3) or PD (n=1), only one of whom (PD) had experienced visual hallucinations (Figure 4A). The autoantibodies from a patient with the systemic autoimmune condition discoid lupus erythematosus caused significantly greater N2A growth stimulation (144% + 5% vs. 102 + 8%; P < 0.01) compared to mean growth stimulation in an identical concentration of the autoantibodies from three chronic schizophrenia patients (Figure 4A).

A

EDMJ 2019-117 - Mark Zimering USA_F4a

B

EDMJ 2019-117 - Mark Zimering USA_F4b

Figure 4. A) Plasma autoantibodies in three patients with schizophrenia (solid line) , four patients with another disorder (dotted line), or a patient with diabetes and discoid lupus (dashed line) were incubated with N2A cells at the indicated concentrations for 24 hours. Each point represents mean N2A cell survival, i.e. quadruplicate determinations which varied by < 10%.

* P< 0.01 compared to solid line or dotted line B) Patient 1 diabetic schizophrenia autoantibodies (60 nM) was incubated alone (solid bars) or with a 200 nanomolar (speckled bar) or a 500 nanomolar concentration (open bar) of the selective 5-HT2AR antagonist M100907 in N2A cells for 24 hours. Results are mean + SE.

Mechanism of N2A pro-survival effect in plasma autoantibodies from psychosis-prone subset

Serotonin 2A receptor activation leads to β-arrestin-2- mediated desensitization and receptor internalization. However, β-arrestin-2 can also couple with diverse signaling pathways leading to enhanced cell proliferation and/or survival promotion. The Pt 1, chronic paranoid schizophrenia IgG autoantibodies promoted increased N2A cell proliferation which was significantly blocked by 500 nM concentration of M100907 (Figure 4B) consistent with 5HT2AR-mediated proliferation signaling. LY379268 (5 µM) alone had no effect on N2A survival, but it significantly blocked the Pt 1 and Pt 2, schizophrenia autoantibody-induced pro-survival effect on N2A cells (Figure 5A). Pertussis toxin (100 ng/mL) had no effect alone on N2A cell survival, but significantly blocked the pro-survival effect of Patient 2 SCZ IgG on N2A cells (Figure 5B). Finally, the PI3- kinase inhibitor LY294002 (20 µM) significantly decreased N2A survival-promotion induced by schizophrenia Pt 1, and Pt 3 major depression with psychotic features autoantibodies (Figure 6A, B).

A

EDMJ 2019-117 - Mark Zimering USA_F5a

B

EDMJ 2019-117 - Mark Zimering USA_F5b

Figure 5. A) Patient 1 schizophrenia plasma autoantibodies (40 nM) was incubated alone (solid bar) or with (speckled bar) a 5 micromolar concentration of the mGlu2R agonist LY379268 in N2A cells for 24 hours. Similar results were obtained in the plasma autoantibodies from Pt 2 chronic schizophrenia, and a Parkinson’s disease patient who had been experiencing visual hallucinations. B) Patient 2 chronic schizophrenia plasma autoantibodies (40 nM) was incubated alone (solid bar) or with (speckled bar) a 100 ng/mL concentration of pertussis toxin (PTX) in N2A cells for 24 hours. A-B) Results are mean + SE.

A

EDMJ 2019-117 - Mark Zimering USA_F6a

B

EDMJ 2019-117 - Mark Zimering USA_F6b

Figure 6. A) Pt 1 schizophrenia plasma autoantibodies (40 nM) or B) Pt 3 major depression with psychotic features autoantibodies was incubated alone (solid bar) or in the presence (speckled bar) of a twenty micromolar concentration of the PI3-kinase inhibitor LY294002 in N2A cells for 24 hours. Results are mean + SE. Similar results were obtained with two additional schizophrenia patient plasma autoantibodies.

Possible association between psychosis and autoantibody-mediated N2A survival promotion

Mean N2A survival promotion in the autoantibodies from seven patients suffering with hallucinations significantly exceeded mean N2A survival in an identical concentration of the plasma autoantibodies from four patients not suffering with hallucinations (112 + 14 vs 72 + 15; P = 0.001) (Figure 7). The patient subgroups (experiencing or not experiencing hallucinations) did not differ significantly in their baseline clinical characteristics (Table 5).

EDMJ 2019-117 - Mark Zimering USA_F7

Figure 7. Mean N2A cell survival after 24 hours incubation in the presence of an identical 40 nM concentration of the plasma autoantibodies from schizophrenia (n=5), major depression (n=1), Parkinson’s disease (n=1) patients all suffering with hallucinations (n=7, solid bar) or from patients with major depression (n=3) or diabetes without hallucinations (n=4, open bar). Results are mean + SE.

Table 5. Baseline characteristics in patients suffering or not suffering hallucinations

Risk factor

Hallucinations (n=7)^

No Hallucinations (n=4)*

P-value

Age (years)

64.3 + 9.1

71.5 + 15.0

0.33

Glycosylated Hgb (%)

7.7 + 1.0

7.7 + 0.9

0.93

Diabetes duration (years)

13.3 + 6.1 (7)

8.7 + 2.6

0.30

^ Schizophrenia (n=5), Major depression (n=1), Parkinsons disease (n=1)

* Major depression (n=3), type 2 diabetes without neuropsychiatric disorder (n=1)

Discussion

Here we demonstrate (for the first time) the existence of 5-HT2AR- activating IgG autoantibodies in plasma from a subset of chronic schizophrenia patients. The autoantibodies caused potent, irreversible Gq/11-mediated neurite retraction in N2A cells by a mechanism involving activation of RhoA/ROCK and Gq11- coupled, PLC/IP3R signaling pathways. In patients suffering with severe, recurrent hallucinations and suicidal ideation, the autoantibodies also promoted N2A cell survival and/or proliferation (in part) via apparent recruitment of additional Gi-coupled, PI3-kinase-dependent survival signaling. LY379268 blocked 5HT2AR-dependent, Gi-coupled, N2A survival signaling in autoantibodies from patients suffering with hallucinations in agreement with the report of Gonzalez-Maeso et. al. [4] of similar effects of LY379268 on hallucinogen-specific induction of egr-2.

The 5-HT2A receptor mediates diverse signaling pathway activation in response to different ligands [12], a phenomenon which has been referred to as “functional selectivity” or “biased agonism.” Beta-arrestin-2- directed signaling not only plays a key role in receptor internalization and desensitization, but it acts as a scaffold to organize extracellular regulated-kinase MAPK signaling cascades [13] and components of the PI3-kinase/Src/Akt cell survival pathway [14]. The latter pathway is active in cancer cells [15] including neuroblastoma [16]. Lysergic acid diethylamine (LSD) causes long-lasting 5-HT2AR activation and biased, β-arrestin-2-directed signaling [2] providing a further link between a ‘mix’ of Gq/11-coupled and β-arrestin-2- directed signaling and psychomimetic effects associated with a subset of long-lasting 5-HT2AR agonists, i.e. schizophrenia autoantibodies.

Sensitization of autoantibody-induced neurite retraction by the mGlu2/3R agonist LY379268 is consistent with Gonzalez-Maeso et. al. [4] and suggests positive allosteric modulation of the 5HT2AR protomer affinity at functional 5HT2AR/mGlu2R complexes in N2A neuroblastoma cells as a plausible mechanism. Receptor heteromers have been reported in neuroblastoma cell, e.g. A2R/D2R [17], and both 5HT2AR [9] and mGlu2R [18] are normally expressed in mouse neuroblastoma cells. Yet in our preliminary experiments, the dopamine 2 receptor (D2R) agonist quinpirole (10 µM) did not sensitize N2A cells to schizophrenia plasma autoantibody- (n=4 different patients) or DOI-induced neurite retraction suggesting that targeting of 5-HT2AR by schizophrenia plasma autoantibodies is specific for homomers or 5-HT2AR/mGlu2R heteromers.

Targeting mGlu2R agonism as a mechanism to suppress presynaptic glutamate release (via mGlu2 autoreceptors) reduced certain psychomimetic drug effects in animals, but did not lead to overall reduction in both negative and positive symptoms in schizophrenia patients [19]. Sensitization of 5-HT2AR-mediated neurite withdrawal by an mGlu2/3 agonist demonstrated here (in vitro) suggests a possible mechanism in which mGlu2R agonism may promote a ‘negative symptom’ in schizophrenia. For example, major depression autoantibodies from patients suffering with anhedonia, a negative symptom in schizophrenia, not only caused robust Gq/11-mediated neurite retraction in N2A neuroblastoma cells [9], but also led to decreased sucrose preference, the behavioral equivalent of anhedonia, in mice following autoantibody intracerebroventicular infusion [20]. More study is needed to determine whether Gq/11-mediated neurite retraction might a useful biomarker in drug discovery aimed at reducing combined negative and positive symptoms in schizophrenia.

Excessive glutamatergic signaling in the cortex and striatum is a feature of 5-HT2AR activation which may underly (in part) delusions and hallucinations occurring in schizophrenia [21] and in a subset of Parkinson’s disease. Serotonin 2A receptor agonism promotes neuronal glutamate release [22] which in turn may enhance 5-HT2AR protomer affinity at 5HT2AR/mGlu2R heteromers in the prefrontal cortex. Since constitutive activation of Gq11-coupled GPCR signaling was reported to recruit additional Gi-coupled downstream signaling in independent GPCRs [23], we cannot rule out the possibility that some ‘cross-talk’ between 5HT2AR and mGlu2R agonism may occur (in part) via mechanisms occurring downstream of direct receptor-receptor interaction(s).

Autoantibodies in a subset of psychosis-prone individuals might possess structural characteristics which bias 5-HT2AR signaling in favor of dual Gq/11 and Gi-coupled, or β-arrestin-2-directed pathways. One possibility is circulating immune complexes which were reported to increase in patients with schizophrenia [24]. Systemic autoimmunity, characterized by a high prevalence of immune complexes, is a risk factor for schizophrenia identified in prior studies [6]. Circulating immune complexes in chronic lymphocytic leukemia (CLL) promoted increased B cell survival through activation of anti-apoptotic and pro-survival signaling pathways [25] and in a prior report, the autoantibodies in a Parkinson’s disease patient with CLL strongly promoted increased N2A proliferation [10]. Taken together, autoantibody-induced cancer cell proliferation and survival might suggest immune complexes which appear to promote biased signaling in favor of dual Gq/11-mediated and β-arrestin-2-directed pathway activation.

A limitation of our study is that it is cross-sectional. More study is needed to determine whether autoantibodies are present in acute-onset, or drug-naive schizophrenia or in other psychotic disorders. Long-standing type 2 diabetes mellitus was associated with 5-HT2AR-activating autoantibodies in patients having diffuse microvascular injury and chronic inflammation, e.g. diabetic kidney disease [9,10]. Yet type 2 diabetes per se is unlikely to have accounted for autoantibodies in the present subset of schizophrenia patients who were free of significant microvascular (i.e. renal or retinal) complications. Schizophrenia is thought to arise through complex gene-environment interactions leading to abnormal neurodevelopment. Brain-reactive antibodies occurring as a result of inflammation, infection or systemic autoimmunity is one potential environmental mechanism in schizophrenia causation [6].

In summary, chronic schizophrenia plasma IgG autoantibodies appeared to activate a Gq11/phospholipase C/inositol triphosphate receptor pathway and RhoA/Rho kinase signaling to cause acute N2A neurite retraction. Autoantibody-induced neurite retraction was positively modulated by the mGlu2/3R agonist LY379268 consistent with reported mGlu2R-driven, positive modulation of 5-HT2AR protomer affinity at 5HT2AR/mGlu2R heteromers [4] found in cortical brain regions underlying perception. Biased agonism at 5-HT2AR mediated by the hallucinogen LSD [2] or by certain autoantibodies from patients suffering delusions and halllucinations involves recruitment of Gi-coupled, PI3-kinase-dependent mechanisms (which for the autoantibodies) was associated with enhanced survival in N2A neuroblastoma cells.

Acknowledgement

We thank Dr. S. Varia and Dr. J. Alder (Dept of Neuroscience, Rutgers-RWJ Med School) for generously providing N2A mouse neuroblastoma cells. Supported in part by a grant from the Veterans Biomedical Research Institute (East Orange, NJ) to MBZ.

The authors report no multiplicity of interest affecting the objectivity of the study results. Presented (in part) at the 2019 Experimental Biology Meeting, Orlando, Florida Supported in part by a grant from the Veterans Biomedical Research Institute, East Orange, New Jersey to MBZ.

References

  1. Xu T, Pandey SC (2000) Cellular localization of serotonin(2A) (5HT(2A)) receptors in the rat brain. Brain Res Bull 51: 499–505. [crossref]
  2. Wacker D, Wang S, McCorvy JD (2017) Crystal Structure of an LSD-Bound Human Serotonin Receptor. Cell 168: 377–389
  3. Moreno JL, Holloway T, Albizu L, Sealfon SC, Gonzalez-Maeso J (2011) Metabotropic glutamate mGlu2 receptor is necessary for the pharmacological and behavioral effects induced by hallucinogenic 5-HT2A receptor agonists. Neurosci Lett 493: 76–79.
  4. González-Maeso J, Ang RL, Yuen T, Chan P, Weisstaub NV, et al. (2008) Sealfon SC Identification of a serotonin/glutamate receptor complex implicated in psychosis. Nature 452: 93–97.
  5. Huang A, Amos TB, Joshi K, Wang L, Nash A (2018) Understanding healthcare burden and treatment patterns among young adults with schizophrenia. J Med Econ 21: 1026–1035.
  6. Benros ME, Mortensen PB, Eaton WW (2012) Autoimmune diseases and infections as risk factors for schizophrenia. Ann N Y Acad Sci 1262: 56–66. [crossref]
  7. Schizophrenia Working Group of the Psychiatric Genomics Consortium (2014) Biological insights from 108 schizophrenia-associated genetic loci. Nature 511: 421–427.
  8. Zimering MB, Mirkovic N, Pandya M, Zimering JH, Behnke JA, et al. (2016) Toxic Immunoglobulin Light Chain Autoantibodies are Associated with a Cluster of Severe Complications in Older Adult Type 2 Diabetes. J Endocrinol Diab 3: 1–14.
  9. Zimering MB (2017) Diabetes Autoantibodies Mediate Neural- and Endothelial Cell- Inhibitory Effects Via 5-Hydroxytryptamine- 2 Receptor Coupled to Phospholipase C/Inositol Triphosphate/Ca2+ Pathway. J Endocrinol Diab 4: 1–10.
  10. Zimering MB (2018) Circulating Neurotoxic 5-HT2A Receptor Agonist Autoantibodies in Adult Type 2 Diabetes with Parkinson’s Disease. J Endocrinol Diabetes 5: 10.
  11. Weiner DM, Burstein ES, Nash N, Croston GE, Currier EA, et al. (2001) 5-hydroxytryptamine2A receptor inverse agonists as antipsychotics. J Pharmacol Exp Ther 299: 268–276. [crossref]
  12. Schmid CL, Raehal KM, Bohn LM (2008) Agonist-directed signaling of the serotonin 2A receptor depends on beta-arrestin-2 interactions in vivo. Proc Natl Acad Sci U S A 105: 1079–1084. [crossref]
  13. Luttrell LM, Roudabush FL, Choy EW (2001) Activation and targeting of extracellular signal-regulated kinases by beta-arrestin scaffolds. Proc Natl Acad Sci U S A 98: 2449–2454.
  14. Schmid CL, Bohn LM (2010) Serotonin, but not N-methyltryptamines, activates the serotonin 2A receptor via a ß-arrestin2/Src/Akt signaling complex in vivo. J Neurosci 30: 13513–13524.
  15. Hennessy BT, Smith DL, Ram PT, Lu Y, Mills GB (2005) Exploiting the PI3K/AKT pathway for cancer drug discovery. Nat Rev Drug Discov 4: 988–1004. [crossref]
  16. Johnsen JI, Segerström L, Orrego A, Elfman L, Henriksson M, et al. (2008) Inhibitors of mammalian target of rapamycin downregulate MYCN protein expression and inhibit neuroblastoma growth in vitro and in vivo. Oncogene 27: 2910–2922. [crossref]
  17. Johnsen JI, Segerström L, Orrego A, Elfman L, Henriksson M, et al. (2008) Inhibitors of mammalian target of rapamycin downregulate MYCN protein expression and inhibit neuroblastoma growth in vitro and in vivo. Oncogene 27: 2910–2922. [crossref]
  18. Fuxe K, Agnati LF, Jacobsen K (2003) Receptor heteromerization in adenosine A2A receptor signaling: relevance for striatal function and Parkinson’s disease. Neurology 61: 19–23.
  19. Wang J, Wang Z, Liu R (2018) Metabotropic glutamate receptor subtype 2 is a cellular receptor for rabies virus. PLoS Pathogens 14.
  20. Muguruza C, Meana JJ, Callado LF (2016) Group II Metabotropic Glutamate Receptors as Targets for Novel Antipsychotic Drugs. Front Pharmacol 7: 130.
  21. Zimering MB, Behnke JA, Thakker-Varia S, Alder J (2015) Autoantibodies in human diabetic depression inhibit adult neural progenitor cells in vitro and induce depressive-like behavior in rodents. J Endocrinol Diab 2: 11.
  22. Aghajanian GK, Marek GJ (2000) Serotonin model of schizophrenia: emerging role of glutamate mechanisms. Brain Res Brain Res Rev 31: 302–312.
  23. Ansah TA, Ferguson MC, Nayyar T (2011) The 5-HT2A receptor antagonist M100907 produces antiparkinsonian effects and decreases striatal glutamate Front Systems. Neurosci 2011.
  24. Baker RA, Casarosa P, Timmerman H (2004) Constitutively active Gq/11-coupled Receptors Enable Signaling by Co-expressed Gi/o-coupled Receptors. J Biol Chem 279: 5152–5161.
  25. Mailian KR, Boiadzhian AS, Sogoian AF, Sim RB, Manukian LA (2005) Concentration and protein composition of circulating immune complexes in the blood of patients with schizophrenia and subjects with positive familial history of disease. Zh. Nevrol. Psikhiatr. Im. S. S. Korsakova 105: 55–60
  26. Balakrishnan K, Peluso M, Fu M (2015) The phosphoinositide-3-kinase (PI3K)-delta and gamma inhibitor, IPI-145 (Duvelisib), overcomes signals from the PI3K/AKT/S6 pathway and promotes apoptosis in CLL. Leukemia 29: 1811–1822.

Production of Ulva Sp. in Multitrophic Aquaculture in Earth Ponds

Abstract

The cultivation of macroalgae in earth ponds could provide an optimal control on both quantity and quality of biomass. In previous studies the genus Ulva has proved to be an ideal candidate for growing in fish ponds since it withstands their considerable environmental fluctuations. This study assessed the biomass production and the SGR (specific growth rate) of green algae Ulva sp. cultivated in earth ponds facing the Ria Formosa lagoon (Southern Portugal). The growth and production performance were tested among: a) two different multitrophic systems (IMTA (fish +oyster + Ulva) and ‘Fish + Ulva’); b) four different initial densities (15 ,30, 50 e 60 g/m2); c) five production and harvest cycles (6, 7, 8, 9 e 15 days). The Specific Growth Rate (SGR) of Ulva sp. was found to be significantly different between the two multitrophic systems (p <0.05) and higher in the ‘Fish + Ulva’ system (19.3 ± 0.08% day-1) than in the IMTA system (16.7 ± 0.8% day-1). Also, there were significant differences between different densities and varied cultivating periods. Growth of Ulva sp. was dependent on both densities and time periods. The densities of 30g/m2 revealed to be the best among the four tested densities (23 ± 3.9 % day−1) whereas the optimal cultivating period was between seven and nine days (≈21 % day−1). The experiments on the production cycle indicated an optimal period of cultivation of about 8 days.

Keywords

Ulva sp.; Biomass production; Specific Growth Rate (SGR); Integrated Multitropihc Aquaculture (IMTA).

Introduction

Despite the growing demand for algae in the EU markets, its production is growing slowly with respect to the world’s largest producers [1]. Traditionally, both in Europe and in Portugal, the macroalgae industry was based mainly on the harvesting of macroalgae [1,2]. However, this technique is subject to annual fluctuations, poor product quality and raises concerns about the conservation of the marine ecosystem [1]. The cultivation of macroalgae in earth ponds and tanks could provide a better control on both quantity and quality of biomass [3–5]. The genus Ulva has proved in previous studies to be an ideal candidate to growing in fish ponds since it reaches high biomass production with high protein content [4, 6–8]. The rapid growth of Ulva is attributed to its high photosynthetic rates and high ability to uptake dissolved nitrogen [8]. Ulva withstands the considerable environmental fluctuations to which the tanks or ponds are subjected [4,9]. Additionally, the environment of the ponds is improved by this type of macroalgae which is able to balance fishpond pH level, oxygen demand and to increment chlorophyll a concentration [4,10]. There is always certain seasonality in growth capacity and biomass yield of Ulva [11]. Seasonality is especially important in the tank cultivation of Ulva in temperate zones as all factors, environmental and ecological, vary considerably [12]. Ulva has long been integrated into land based Integrated Multi-Trophic Aquacultures (IMTA) for biomass production and bioremediation [13]. Since Growing Ulva in effluent media increases its protein content (> 40%), it turned out to be a valuable feed for macroalgivores* species with high commercial value [8,13,14]. Currently the market for these algae is limited, but studies that discuss the suitability of Ulva as a biomass energy resource and its application as a raw material for nutraceuticals, biomaterials and sulphated polysaccharides (ulvan), can increase their attractiveness [13–15]. The present work focused on the feasibility of integrating a land-based production system of Ulva sp. on a semi-commercial aquaculture farm, with the objective of assessing the Specific Growth Rate (SGR) and Biomass production of Ulva sp. in multitrophic aquaculture.

Materials and Methods

Ulva sp. Production

The multitrophic aquaculture experiment was conducted at the Aquaculture Research Station in Olhão (EPPO- Estação Piloto de Piscicultura de Olhão), Portugal. Four rectangular 450 m2 x 1.5 m deep earthen ponds were used: 2 with fish, oyster and macroalgae (IMTA) and 2 without oysters (Fish + Ulva) (Figure 1). Autotrophs (phytoplankton, Ulva sp.), filter-feeding species (Crassostrea gigas) and fed organisms (Argyrosomus regius, Mugil cephalus, Diplodus sargus) are grown in the same earthen pond. Stock densities of the organisms cultivated are showed in table 1.

AFS 2019-102 - Glauco Favot USA_F1

Figure 1. Pattern of assay in EPPO earth ponds.

Table 1. Stock densities of the organisms present in the pond.

Species

Density

Argyrosomus regius

1500 (N°/pond)

Diplodus sargus

900 (N°/pond)

Mugil cephalus

550(N°/pond)

Crassostrea gigas

18000 (N°/pond)

Ulva sp.

30g/m² x 6 rafts

Growth, biomass production and best cultivation period were evaluated for the cultivated macroalgae belong to the genus Ulva (Linnaeus, 1753). The time scheduled for the several experiments is shown in Figure 2) The first experiment involved the evaluation of the best stock density for Ulva’s growth; 2) The best cultivation time to attain the highest growth (best cultivation Period) was determined next in a specific experiment where daily production of Ulva sp. was followed for 8 consecutive days (dry biomass was also measured); 3) After determining this density, the production of Ulva in the ponds was assessed by comparing the multitrophic system IMTA and Fish+Ulva.

AFS 2019-102 - Glauco Favot USA_F2

Figure 2. Time schedule of experiments ran during the study

Naturally occurring Ulva was collected in the main discharge channel and in the settling pond of EPPO (Figure 3a). After harvest, the macroalgae were washed with clean saltwater to remove most of the impurities and epibionts and drained by excess water. A portion of the harvest was weighted and individually planted in 6 rafts, each measuring 1 m2, made of horizontal nets stretched between styrofoam floaters. The individual pieces of macroalgae were attached to the net with brackets (Figure 3b and 3c).

AFS 2019-102 - Glauco Favot USA_F3

Figure 3. a) Collecting Ulva sp. from discharge channel; b) the six floating rafts; c) Ulva being fixed with brackets; d) macroalgae draining and weighing.

The stock density that permitted the highest growth of Ulva was determined in May-June 2016 in a three-weeks trial to evaluate the growth of the macroalgae (Figures 2 and 4). Specific Growth Rate (SGR) and Wet Biomass Production (WBP), was tested using four stock densities: 60, 50, 30 and 15 g/m2. Each week the growth obtained with different stock densities (60, 50 e 15 g/m2) were compared with the growth obtained with 30g/m2 that act as a control for comparison. This was done to prevent the effect of differences in environmental conditions among the three experiments. Ulva was distributed among the six rafts in the way shown in Figure 4. Since the 30g/m2 showed the best results it was decided to plant the floating structures with this density in all subsequent experiments.

AFS 2019-102 - Glauco Favot USA_F4

Figure 4. Scheme representing the density distribution in the six rafts.

To determine the cultivation time for highest growth the SGR was obtained for 5 different cultivation periods: 6, 7, 8, 9 and 15 days in June 2016. This allowed drawing a growth curve to define the cultivation time that resulted on better growth rates. To accurately determine the daily growth curve another experiment was carry out on an eight-day experiment where the macroalgae biomass was sampled daily. The experiment started on June 2016. Eight floating rafts (each of 1m2) were placed in a pond containing oysters and fishes (Figure 5). In the following eight days, a raft was chosen at random and the macroalgae removed, washed, drained and weighed. In this experiment the water temperature (°C), pH, turbidity (FNU) and dissolved oxygen (ppm and % saturation) were determined twice a day. Ulva sp. were collected, washed and weighed as in previous experiments. 30g of macroalgae was placed on each raft and 3 samples of 30g, were dried up in an oven at 60°C to obtain an average starting dry weight. Obtaining the dry weight allowed to calculate the percentage (17.7%) of dry biomass presents in the wet Ulva biomass collected as follow: (DW/WW) *100. The dry weight (DW) was determined by drying the algae at 60°C in a hoven. Dry biomass production (DBP) was calculated by the following equation:

DBP = [(DWf–DWi)/(A*t)]

where DWf = final dry weight, DWi = initial dry weight, t = days of culture and A = culture area [16].

AFS 2019-102 - Glauco Favot USA_F5

Figure 5. Eight-days experiment to determine the growth period. Each raft had 30 g/m2 of initial density. Every number represents after how many days the algae were harvested from that raft.

From June to November 2016 the production of IMTA and Fish+Ulva systems was compared. A total of 14 weekly harvests were carried out. During the experiment water temperature (°C), pH, turbidity (FNU, Formazin Nephelometric Units) and dissolved oxygen (ppm and % saturation) were measured with multiparameter probes (Hanna Instruments H9829) twice a day. The irradiance was measured using an Apogee Mark Model SP-214 pyranometer. Furthermore, monthly, samples were taken to determine the concentration of Chlorophyll a and nutrients (NH4, NO3, NO2, HPO4). The nutrients were analysed by colorimetry method (Grasshoff et al., 1983) whereas Chlorophyll a was determined by spectrophotometry according to Parsons et al. (1984).

Macroalgae harvesting was done by hand. The floating structures were gently agitated to remove deposited sediments on the surface of the macroalgae before harvest. Prior to weighing Ulva was washed with filtered salt water to remove debris and epibionts, squeeze drained and the biomass in each 1 m2 determined individually in a scale with a 1 mg accuracy (Figure 3d).

The daily wet biomass production (WBP) at each 1 m2 raft composing the floating structure was calculated and expressed in g m−2 day−1.

Specific growth rate (SGR, %) of Ulva in the rafts was calculated as:

SGR = ln (WWt–WWi)/t

where WWi is the initial wet weight and WWt is the wet weight after t = time (cultivation days).

Statistic

The normality (Shapiro-Wilk’s test) and homogeneity of variances (Bartlett’s test) within the biotic and abiotic factors were tested before applying parametric test. When these assumptions were not respected, the non – parametric test (Kruskal – Wallis) was used. Statistical test of one-way ANOVA within abiotic factors was performed to identify the possible differences between the two production systems [17]. One-way ANOVA was also used to test the Specific Growth Rate (SGR) obtained from the two different systems.

The SGR (specific growth rate) of the two systems was used for the following statistical test:

  • To determine the correlation (with Spearman variant in case of no normality-homogeneity) between physic-chemical parameters in the pond water and SGR.
  • To assess the different densities and periods of cultivation. In this case when statistical difference was found a pairwise test was done to know which groups cause the difference (‘inhomogeneity’) [17].

Values for dissolved oxygen, pH, temperature and turbidity used in the correlation analysis (see Figure 7 in Results) correspond to the daily mean of a seven days period prior to the sampling for the other parameters.

Results

Ulva sp. Production

Abiotic factors (Table 2)

Table 2. Mean ± standard deviation values of abiotic and biotic factors for the two systems (IMTA and Fish + Ulva), and level of significance (p-value) of the comparison between the two using one-way ANOVA.

System

IMTA

Fish + Ulva

p-value

Factor

Temp.(°C)

25.11±2.92

25.08±2.85

p>0.05

pH

8.47±0.19

8.43±0.17

p<0.01

D.O. (ppm)

5.92±1.03

5.67±0.98

p<0.01

Turb. (FNU)

17.91±7.20

20.59±8.44

p<0.001

Irr.a (kW m-2)

400.47±288.5

400.47±288.5

Sal. (psu)

36.08±0.85

36.04±1.76

p>0.05

NH4+(µM)

32.20±22.67

36.89±8.63

p>0.05

NO3 (µM)

7.84±5.18

6.02±1.73

p>0.05

HPO4–2 (µM)

1.02±0.02

0.93±0.33

p>0.05

NO2(µM)

1.42±1.12

1.37±0.61

p>0.05

Chla (µg/l)

1.07±0.63

0.86±0.66

p>0.05

a.Irradiance equal for both systems because the data came from meteorological station placed on the roof of EPPO building.

The temperature of the water averaged 25.11±2.92 ºC and 25.08±2.85 ºC at IMTA ponds (Fish + Oysters + Ulva) and at ponds without oysters (Fish + Ulva) respectively. During the experience, the temperature range between 30.2°C (maximum value found on IMTA ponds on July) and 15.5°C (minimum value found on Fish + Ulva ponds on November). Salinity was almost constant (≈ 36 PSU) except on the last day of October when it was raining (minimum value of 32.26 PSU). No significant difference was found between the ponds and systems respecting the temperature and salinity (p>0.05).

pH and dissolved oxygen (D.O.) in the water increased on the ponds from morning to afternoon, and this difference was more pronounced during summer (Figures 6a and 6b). Dissolved oxygen and pH presented higher mean values in the IMTA ponds (pH = 8.47±0.19; D.O.= 5.92±1.03) when compared to Fish + Ulva ponds (8.43±0.17; D.O.= 5.67±0.98) and in October when there was a peak at IMTA ponds for both parameters. Either D.O. and pH presented significant difference between the systems (p<0.01). Also for the turbidity (FNU) was statistically different among systems but in this case the higher mean corresponded to Fish + Ulva system (20.59±8.44). Mean values of nutrients and chlorophyll a are presented in Table 2. No significant differences were found between the systems for these factors. Both temperature and pH showed a positive correlation with specific growth rates (SGR), whereas a negative correlation was found between SGR and NH4+( p-values< 0.05) (Figure 7). Values for dissolved oxygen, pH, temperature and turbidity used in the correlation analysis correspond to the daily mean of a seven days period prior to the sampling for the other parameters.

AFS 2019-102 - Glauco Favot USA_F6

Figure 6. Means of daily variation of pH(a) and D.O(b) in the ponds (morning, blue lines; afternoon, red lines) during the 5 months of the experiment (systems are represented together). Vertical bars represent standard deviation.

AFS 2019-102 - Glauco Favot USA_F7

Figure 7. Correlation between biotic and abiotic parameters in the ponds. Correlations with p-value > 0.05 were considered as non-significant and leaved blank. Circles represent significant correlations: red – negative correlation, blue – positive correlation. Colour intensity and size of the circles are proportional to the significance of the correlation coefficient. (NH4+, HPO4–2, NO3, NO2 in µM: Chlorophyll a in µg/l; D.O.: dissolved oxygen in µM; Temp: temperature in °C; SGR: specific growth rate in %, Turb: turbidity in FNU).

Ulva sp. growth and biomass yield

Specific growth rate (SGR) of Ulva sp. had a mean of 19.3±0.08% at Fish + Ulva ponds and 16.7±0.8% at IMTA ponds. Kruskal-Wallis test gave a narrow significant difference between the systems (KW=3.85, p=0.049). The maximum SGR of Fish + Ulva systems was achieved on 13 September (36.51%), whereas IMTA registered the higher value on 19 July (31.33%) (Table 3).

Table 3. Specific growth rate (SGR) and daily wet biomass production (WBP) during the experiment. Kruskal-Wallis (KW) value and significance (p).

System

Min value

Mean ± SD

Max value

KW

p-value

SGR (% d-1)

IMTA

5.6

16.7±0.8

3.33

3.85

p<0.05

Fish+Ulva

3.0

19.3±0.08

36.51

WBP
(g/m2d)

Min value

Mean ± SD

Max value

KW

p-value

IMTA

0.25

12.3±9.89

44.85

5.84

p<0.05

Fish+Ulva

0.74

17.2±13.60

65.87

The mean wet biomass production (WBP) created by the two systems were statistically different (KW=5.84, p<0.05) with a maximum value found on Fish + Ulva ponds of 65.87 g m-2d-1 on 13 of September (Table 3).

Figures 8 and 9 show two clear cycles of increase and decrease for both SGR and WBP that corresponds to 6 weeks each. The first increase started in June 24 peaking in 19 July followed by a decrease until August 11 when it reached the minimum value; after this date they started increasing again until September 02. The second decrease reached the minimum value in October 20. The SGR followed the temperature fluctuation only in the last period of the experiment, whereas the ammonium variation is clearly in opposition to the biomass production (Figure 9).

AFS 2019-102 - Glauco Favot USA_F8

Figure 8. Variation of specific growth rate (SGR) (at right) of Ulva sp. along the experiment. X axis refers to day of harvesting. The green line represents the average water temperature during the 7 days of the cultivation periods (at left). Blue bars: Fish + Ulva system; Yellow bars: IMTA system; lines: standard deviation.

AFS 2019-102 - Glauco Favot USA_F9

Figure 9. Variation of Wet biomass production (WBP) (at right) of Ulva sp. along the experiment. The black dots correspond to the ammonium concentration (at left) in the tanks during the sampling day. Blue bars: Fish + Ulva system; red bars: IMTA system; lines: standard deviation

Best Cultivating Periods and Stock Densities for Improved Growth

The Figure 10 shows a polynomial trend line of 2nd order (an ascending curve) to illustrate the relationship between the five different cultivation periods and their SGR. The coefficient of determination R2= 0.9474 represents the fitting of the data to the line. The SGR between the 5 cultivating periods were found to be statistically different (KW = 25.045, p<0.001) and the pairwise test stressed that the 6 and 9 days were those that differed significantly from the other three (p=0.0018) (Table 4). The SGR of Ulva sp. of the 7–8-9 days periods were almost double of the remaining two (Figure 10). Abiotic parameters during the experiment to determine the best cultivating period are shown in Table 5.

AFS 2019-102 - Glauco Favot USA_F10

Figure 10. Growth curve using SGR recorded from 5 different cultivation periods.

Table 4. Numeric matrix containing the p-values of the t- tests calculated for each pair of cultivation period groups. In the output view, the red numbers stressed the periods are significantly different from each other (p<0.05).

Cultivation period

6 days

7 days

8 days

9 days

15 days

6 days

7 days

0.018

8 days

0.2109

1.0000

9 days

0.0018

1.0000

1.0000

15 days

1.0000

0.1127

0.7544

0.0058

Table 5. Mean values (8 days) of abiotic parameters during the experiment to determine the daily growth.

System

Temp.(°C)

pH

D.O.
(ppm)

Turb.
(FNU)

Sal.
(psu)

Morning

25.2±0.81

8.2±0.05

4.6±0.77

15.9±1.71

36.5±0.07

Afternoon

26.9±1.93

8.5±0.06

8.4±2.03

19.2±1.88

36.6±0.07

Different stock densities did show differences for SGR and for WBP (KW= 24.343, p<0.05) (Table 6). The values for 60 grams were omitted due to a measurement error during weighing. For the densities, the pairwise test showed a significant difference in biomass production between 30g/m2 and the lower value (15 g/m2) (p = 0.0004) but not with 50 g/m2 (Table 7).

Table 6. Specific growth rate (SGR) and wet biomass production (WBP) obtained with 3 different initial densities

15

30

50

SGR(%/d)

21.1 ± 4.8

23.0 ± 3.9

15.7 ± 7.6

WBP(g/m2d) *

6.9 ± 2.9

22.2 ± 12.6

17.40 ± 13.4

*Significant difference p<0.05

Table 7. Numeric matrix containing the p-values of the t- tests calculated for each pair of stock densities groups. In the output view, the red numbers stressed the biomass are significantly different from each other (p<0.01).

Densities

15g/m2

30g/m2

50g/m2

15g/m2

30g/m2

0.0004

50g/m2

0.004

0.312

Daily Growth of Ulva sp.

Daily growth rates (SGR), obtained during the 8 days experiment, are presented in Figure 11. The SGR increased linearly until the third day of cultivation (R2=0.9969) then entered a stationary phase (R2=0.0883) with values identical or slightly lower than those reached on the third day (≈ 39 %). The daily increase of dry weight (DW) followed an exponential curve (R2=0.9756) (Figure 12) until the seventh day then slow down sharply. The dry and wet biomass productions on the 8th day was 10.9 g m-2d-1 and 60.6 g m-2d-1 respectively.

AFS 2019-102 - Glauco Favot USA_F11

Figure 11. Growth curve of Ulva sp. SGR grown in eight-days experiment. Blue line represents first 3 days trend. Orange line represents the last 5 days.

AFS 2019-102 - Glauco Favot USA_F12

Figure 12. Growth curve of Ulva sp. dry biomass (DW) grown in eight-days experiment.

Discussion

EPPO pond water and their abiotic factors supported well the Ulva sp. growth. The values of specific growth rate (SGR) of both systems gave results similar to other studies (Table 8). However, the wet biomass production (WBP) and the Dry Biomass Production (DBP) recorded in this experiment were often lower than the others likely due to the use of different tank sizes, techniques or different initial density of Ulva [16,19] .

Table 8. Comparison of averages of specific growth rate(SGR), dry biomass production (DBP), Wet biomass production(WBP) cultured in different systems with different stock density (Table adapted from Ben-Ari et al., 2014 [8] and Castelar et al., 2014 [16]).

Species

System

Stocking density (kg WW m-2)

DBP
(g m-2 d-1)

SGR
(%/day)

WBP
(g m-2 d-1)

References

Ulva sp.

Earth pond

0.06–0.015

2.6

17

14.75

This study

Ulva lactuca

Tank

1–8

34.5–6

10–1

230–40

Bruhn et al., 2011 [14]

Ulva sp.

Ropes,sea

0,0005*

0.24

11.95

_

Castelar et al., 2014 [16]

Ulva sp.

Tank

 0,0005*

0.47

22.80

_

Castelar et al., 2014 [16]

Ulva clathrata

Tank

0.2–0.5

10.5

7

70

Copertino et al., 2009 [22]

Ulva lactuca

Tank

1

16.8 -56.4

_

112–376

Msuya and Neori, 2008 [18]

Ulva lactuca

Tank (continuous aeration)

0.8

47.7

13.3

318

Ben-Ari et al., 2014 [8]

Ulva lactuca

Tank (25% aeration)

0.8

26.7

8.1

178

Ben-Ari et al., 2014 [8]

The optimal cultivation period into EPPO ponds seemed to be positioned between seven to nine days since, after this time, the SGR decreased. Moreover, looking at the growth curve of Dry Weight (DW) obtained after eight days cultivations, Ulva sp. seemed to have reached the maximum of biomass around this period. This result and SGR values greater than 10% up to 15 days of cultivation suggest a production cycle of approximately 8 days.

The SGR and WBP during the experience drew a sinusoidal pattern with two spikes and two falls of values. The drop in autumn can be explained by a decrease in temperatures and a reduction of light period [20,21], in addition to a week of rain that occurred before the last collection. More complicated is explaining the drop in August. During this period was noted the presence of white spots in the Ulva thalli a phenomenon known as “ghost tissue” often indicative of an increase in sporulation. Sporulation can be caused by several factors such as elevated temperatures, irradiance, lack of nutrients and life cycle’ stage [22,23]. However, temperature and irradiance were constant from June to the end of August and the first one was within the optimum range for the species [16,24]. Even pH values (7.6<pH<8.8) were optimal for species growth, since they could be related to a high presence of dissolved bicarbonate (HCO3) in water, the main source of inorganic carbon for the seaweed [25–27]. Therefore, life cycle could explain the August decreased. A study concerning Ulva rigida conducted in the Venice lagoon reported pulses of production during the year similar to that of this study [28]. The algae could have been harvested at a specific stage of the life cycle and the procedure to weigh it and put it in the structure could have accelerated these sporulation processes [23,29]. Although the nutrients concentration of EPPO ponds was like if not greater than previous studies [11,16,20,30,31] cannot be ruled out the possibility of a shortage of nutrients, particularly of NH4+. The increasing concentration of NH4+ during the phases of decline in algal biomass (Figure 3.3b) could represent a phase of renewal of nutrients up to a re-optimal level for algae. Another hypothesis would suggest that this oscillation depicted the Ulva sp. capacity to remove this nutrient. When macroalgae biomass declined the assimilative capacity of the environment for nutrients declined in turn. However, specific studies will be required for a proper evaluation of both conclusions.

Initial different densities showed better results for 30g/m2 which led to the decision discussed in the methodology (see Material and methods). Using low initial density has been suggested as a possible optimization of growing space [16]. Nevertheless, in macroalgae culture it’s usually used an optimum initial density of 1 kg/m2 but growing macroalgae in tanks equipped with artificial aeration to ensure there is no shading among the algae [8,14].

Ulva growing in the ‘Fish + Ulva’ system revelled a better performance than in the IMTA. ‘Fish + Ulva’ system presented mean values superior for both SGR and WBP. Since environmental parameters such as temperature, salinity and irradiance were identical for both systems the cause could be attributed to interactions between the different organisms presents into the ponds. It is known that oysters remove suspended particle by filtration [32] which explains the turbidity difference between the two systems. However, they contribute to the N pool with their excretions [33] so there might be higher growth of phytoplankton with limitations in the growth of Ulva in IMTA system. Nevertheless, the presence of oysters may have also caused a variation in the bacterial community [33,34]. Since the rule of bacteria is important for the growth and the morphogenesis of some species of green algae [15,35,36] the variation in quantity and quality of their community could have affected the growth of algae.

Wet biomass values were converted to dry biomass considering that dry/wet Ulva sp. biomass is around 15 % (17.7 %in this study); *dry biomass.

The differences in oxygen concentrations and pH between early morning and afternoon stressed the ability of the primary producers, Ulva sp. included, to oxygenate the water in both systems.

Conclusion

Ulva sp. showed to grow well under conditions typical of earth-pond aquaculture. The experiments on the production cycle indicated a period of cultivation of macroalgae of about 8 days. Despite the differences found within the systems, the growing periods and the initial densities of Ulva sp., the growth values have always been satisfactory. The technique used for cultivation has proved feasible. However, it will be necessary to assess the growth of the species along the year to evaluate better it response at environmental changes. Even higher stock densities should be tested to evaluate a possible cultivation for commercial purposes.

References

  1. EUMOFA (2016) Monthly Highlights – October, (April) 23 (www.eufoma.eu).
  2. Pereira L, Correia F (2015) Macroalgas marinhas da costa portuguesa – biodiversidade, ecologia e utilizações. Edição Nota de Rodapé
  3. Cohen I, Neori A (1991) Ulva lactuca Biofilters for Marine Fishpond Effluents 1. Ammonia Uptake Kinetics and Nitrogen-Content. Botanica Marina 34: 475–482.
  4. Robertson-Andersson (2003) the cultivation of Ulva lactuca (Chlorophyta) in an integrated aquaculture system, for the production of abalone feed and the bioremediation of aquaculture effluent. MSc Dissertation, University of Cape Town, South Africa.
  5. Abreu MH, Pereira R, Yarish C, Buschmann AH, Sousa-Pinto I (2011) IMTA with Gracilaria vermiculophylla: Productivity and nutrient removal performance of the seaweed in a land-based pilot scale system. Aquaculture 312: 77–87.
  6. Floreto EAT, Hirata H, Yamasaki S, Castro SC (1994) Effects of Temperature, Light Intensity, Salinity and Source of Nitrogen on the Growth, Total Lipid and Fatty Acid Composition of Ulva pertusa Kjellman (Chlorophyta). Botanica Marina 36: 149–158.
  7. De Casabianca ML, Posada F (1998) Effect of Environmental Parameters on the Growth of Ulva rigida (Thau Lagoon, France). Botanica Marina 41:157–166.
  8. Ben-Ari T, Neori A, Ben-Ezra D, Shauli L, Odintsov V, Shpigel M (2014) Management of Ulva lactuca as a biofilter of mariculture effluents in IMTA system. Aquaculture 434: 493–498.
  9. Carballo RQ (2012) Acuicultura multitrófica integrada, una alternativa sostenible y de futuro para los cultivos marinos de Galicia.
  10. Hurd CL (2015). Seaweed Ecology and Physiology. 2nd Edition. Cambridge University Press.
  11. Macchiavello J, Bulboa C (2014) Nutrient uptake efficiency of Gracilaria chilensis and Ulva lactuca in an IMTA system with the red abalone. Haliotis rufescens Latin American Journal of Aquatic Research 42: 523–533.
  12. Israel AA, Friedlander M, Neori A (1995) Biomass Yield, Photosynthesis and Morphological Expression of Ulva lactuca. Botanica Marina 38: 297–302.
  13. Carl C, De Nys R, Paul NA (2014) The seeding and cultivation of a tropical species of filamentous Ulva for algal biomass production. PLoS ONE 9.
  14. Bruhn A, Dahl J, Nielsen HB, Nikolaisen L, Rasmussen MB, Markager S, Jensen PD (2011) Bioenergy potential of Ulva lactuca: Biomass yield, methane production and combustion. Bioresource Technology 102: 2595–2604.
  15. Grueneberg J, Engelen AH, Costa R, Wichard T (2016) Macroalgal morphogenesis induced by waterborne compounds and bacteria in coastal seawater. PLoS ONE 11.
  16. Castelar B, Reis RP, dos Santos Calheiros AC (2014) Ulva lactuca and U. flexuosa (Chlorophyta, Ulvophyceae) cultivation in Brazilian tropical waters: Recruitment, growth, and ulvan yield. Journal of Applied Phycology 26: 1989–1999.
  17. Altobelli A (2008). Laboratorio di Informatica applicata all’Ecologia per il Corso di laurea in Scienze Biologiche. Appunti introduttivi di R Laboratorio di informatica applicato all’ecologia – Dip.Biologia – Univ. TS.
  18. Msuya FE, Neori A (2008) Effect of water aeration and nutrient load level on biomass yield, N uptake and protein content of the seaweed Ulva lactuca cultured in seawater tanks. Journal of Applied Phycology 20: 1021–1031.
  19. Robertson-Andersson DV, Potgieter M, Hansen J, Bolton JJ, Troell M, et al (2008). Integrated seaweed cultivation on an abalone farm in South Africa. Journal of Applied Phycology 20: 579–595.
  20. Ogawa T, Ohki K, Kamiya M (2013) Differences of spatial distribution and seasonal succession among Ulva species (Ulvophyceae) across salinity gradients. Phycologia 52: 637–651.
  21. Amosu AO (2016) Using Ulva (Chlorophyta) for the production of biomethane and mitigation against coastal acidification.  Thesis for the degree PhD in the Department of Biodiversity and Conservation Biology, University of the Western Cape.
  22. Copertino MDS, Tormena T, Seeliger U (2009) Biofiltering efficiency, uptake and assimilation rates of Ulva clathrata (Roth) J. Agardh (Clorophyceae) cultivated in shrimp aquaculture waste water. Journal of Applied Phycology 21: 31–45.
  23. Chemodanov A, Jinjikhashvily G, Habiby O, Liberzon A, Israel A, Yakhini Z, Golberg A (2017) Net primary productivity, biofuel production and CO 2 emissions reduction potential of Ulva sp. (Chlorophyta) biomass in a coastal area of the Eastern Mediterranean. Energy Conversion and Management 148: 1497–1507.
  24. Cui J, Zhang J, Huo Y, Zhou L, Wu Q, Chen L, He P (2015) Adaptability of free-floating green tide algae in the Yellow Sea to variable temperature and light intensity. Marine Pollution Bulletin 101: 660–666.
  25. Falkowski PG, Raven JA (2007) Aquatic Photosynthesis, 2nd Edition. Princeton University Press, Princeton, NJ, USA.
  26. Raven JA (2010) Inorganic carbon acquisition by eukaryotic algae: four current questions. Photosynthesis Research 106: 123–134.
  27. Msuya FE, Kyewalyanga MS, Salum D (2006) The performance of the seaweed Ulva reticulata as a biofilter in a low-tech, low-cost, gravity generated water flow regime in Zanzibar, Tanzania. Aquaculture 254: 284–292.
  28. Sfriso AA, Sfriso A (2017) In situ biomass production of Gracilariaceae and Ulva rigida: the Venice Lagoon as a study case 60: 271–283.
  29. Pettett P (2009) Preliminary investigation into the induction of reproduction in Ulva spp. in Southeast Queensland for mass cultivation purposes University of the Sunshine Coast Submitted in partial fulfilment of the requirements for the degree of Masters in Environmenta. Tesis Maestria, University of the Sunshine Coast 2–71.
  30. Neori A, Cohen I, Gordin H (1991) Ulva lactuca biofilter for marine fishpond effluents: II. Growth rate, yield and C: N ratio. Botanica Marina 34: 389–398.
  31. Nielsen MM, Bruhn A, Rasmussen MB, Olesen B, Larsen MM, Møller HB (2012) Cultivation of Ulva lactuca with manure for simultaneous bioremediation and biomass production. Journal of Applied Phycology 24: 449–458.
  32. Buck BH, Nevejan N, Wille M, Chambers MD, Chopin T (2017) Offshore and Multi-Use Aquaculture with Extractive Species: Seaweeds and Bivalves. BT – Aquaculture Perspective of Multi-Use Sites in the Open Ocean: The Untapped Potential for Marine Resources in the Anthropocene. In B. H. Buck & R. Langan (Eds.) (pp. 23–69). Cham: Springer International Publishing.
  33. Jones, A. B., Dennison, W. C., & Preston, N. P. (2001). Integrated treatment of shrimp effluent by sedimentation, oyster filtration and macroalgal absorption: A laboratory scale study. Aquaculture 193: 155–178.
  34. Quental-ferreira H, Leão AC, Pousão-ferreira P (2012) Integrated Multitrophic Aquaculture in Earthen Ponds Conference Paper.
  35. Spoerner M, Wichard T, Bachhuber T, Stratmann J, Oertel W (2012) Growth and Thallus Morphogenesis of Ulva mutabilis (Chlorophyta) Depends on A Combination of Two Bacterial Species Excreting Regulatory Factors. Journal of Phycology 48: 1433–1447.
  36. Wichard T, Charrier B, Mineur F, Bothwell JH, De Clerck O, Coates JC (2015) The green seaweed Ulva: a model system to study morphogenesis. Front Plant Science 6.

Symptomatic Effects of Chest Physiotherapy with Increased Exhalation Technique in Outpatient Care for Infant Bronchiolitis: A Multicentre, Randomised, Controlled Study. Bronkilib 2

Abstract

Objectives: The effectiveness of chest physiotherapy (CP) with increased exhalation technique (IET) to treat infants hospitalised for bronchiolitis has not to date been demonstrated. In outpatient settings, data are lacking to confirm CP’s effectiveness. The purpose of our study was to assess the impact of CP in outpatient care for infants with bronchiolitis.

Methods: We conducted a multicentre, randomized, controlled, single-blind study involving infants under 12 months treated on an outpatient basis. The primary endpoint, a decrease in the severity classification level of the infants’ respiratory difficulties, was compared between two patient groups, one with and one without CP.

A total of 82 infants were randomized; 41 were assigned to the CP group and 41 to the control group. Different blinded assessors determined the Wang Clinical Severity Score at inclusion (T0) and 30 minutes after inclusion (T1) for each group.

Results: In the group that received CP, 29 infants (70.7%) showed improvement and their severity level was modified, as compared to 4 (9.76%) in the control group (p<0.001). The mean decrease in the Wang Clinical Severity Score was: -2 (±1.32) in the group receiving physiotherapy compared to -0.22 (±0.99) in the control group (p<0.001).

Conclusions: Our study results suggest a symptomatic effect of CP with IET for short-term clinical improvement among infants with bronchiolitis in outpatient settings.

Keywords

bronchiolitis, infants, chest physiotherapy

1. Introduction

Infant bronchiolitis is a common disease that causes a large number of patients to seek outpatient medical and physiotherapy care in France. Numerous studies and international recommendations [1,2,3] have indicated that no drug is effective in care for bronchiolitis. In September 2000, a consensus conference sponsored by the French National Agency for Health Accreditation and Evaluation (ANAES) reached the same conclusion [4].

With respect to chest physiotherapy (CP), postural drainage therapy, vibration and conventional chest physiotherapy (CPT) are not considered to be effective [5, 6]. Although the ANAES has recommended the utilization of chest physiotherapy with prolonged slow expiration techniques combined with assisted coughing [4], there is little proof of its effectiveness (grade C). For this reason, the ANAES has advocated that studies be conducted in “outpatient” settings to assess CP’s degree of effectiveness.

Much more recently, a Cochrane Review publication recommended exploring the effects of CP techniques among mild to moderate non-hospitalised patients [6]. In fact, most of the studies conducted to date have focused exclusively on infants who were hospitalised for severe bronchiolitis. For this type of patient group, the effectiveness of such treatment, aiming to reduce time to recovery, has not been demonstrated [7, 8]. However, three recently conducted studies have produced new data [9, 10, 11]. Despite the inherent limitations of the methodologies used and/or the number of subjects, these studies once again raise the question of the effectiveness of CP combined with IET in outpatient settings. For this reason, we undertook to assess the symptomatic effect of CP as a component of outpatient care for infant bronchiolitis, in line with recommendations in France.

2. Materials and methods

2.1 Study design and organisation

We conducted a multicentre, randomized, controlled, single blind study comparing a group of infants receiving physiotherapy and a control group without physiotherapy. For our study, children were enrolled at four centres: two located in the Ile de France region, one located in Normandy, and one located in the Auvergne Rhône Alpes region of France. The study was conducted during an acute bronchiolitis epidemic season between 17 December 2016 and 01 February 2017.

Upon the recommendation of the ethical committee of Robert Debré University Paediatric Hospital Centre, we submitted our study to a French institutional review board, the Comité de Protection des Personnes CPP IV IDF (ID-RCB n°2016-A01553-48), which approved the study at its meeting of 22 November 2016. In addition, our clinical trial was registered with the French National Agency for Medicines and Health Products Safety (ANSM) and assigned No. ID-RCB 2016-A01553-48. Lastly, we submitted a declaration of compliance with a reference methodology to the French Data Protection Authority (CNIL), and we provided an information sheet to parents of infants taking part in the study. We obtained the oral consent and non-opposition of all the parents of children who participated in the study.

2.2 Participants

To be included in the study, infants had to be between one and 12 months old [12] and experiencing a first or second episode of bronchiolitis for which their GP had prescribed outpatient CP (the first or second session of CP for this episode). Only infants who had been assigned a Wang Clinical Severity Score ≥4 and <9 were randomised after inclusion. Exclusion criteria included infants who had been born prematurely, i.e., before 34 weeks’ gestation. Those with a history of bronchopulmonary dysplasia and serious pulmonary or cardiac disease were also excluded. In addition, infants presenting a contraindication to CP with IET (prolonged corticosteroid therapy, rickets, osteogenesis imperfecta or rib fracture) were not enrolled in the study.

2.3 Randomisation, arms

We used an on-line system (PHP/MySQL) for randomisation into blocks, centralised and stratified by centre, which we accessed using a login name and password. When authorized investigators connected to the system to enrol a patient, they checked to ensure that inclusion criteria had been met and no exclusion criteria were present.

A stratification by centre approach ensured minimal imbalance among groups within the same study centre. Finally, so as to avoid any selection bias in relation to a specific centre, we imposed an upper limit of 40 patients per centre. We used a 1: 1 allocation with set blocks of 4. Study participants were randomised to receive CP immediately (Group A) or to receive CP later (Group B, the control group). For Group A, the Wang Clinical Severity Score was measured 30 minutes after the CP session, while for Group B the Wang Score measured at 30 minutes was assessed before the CP session.

2.4 Conduct of the study

After informing the parents and obtaining their consent, the physiotherapist/investigator enrolled the infants meeting the inclusion criteria in the study (Figure 1).Wang Clinical Severity Scores were measured at inclusion (T0) and 30 minutes after inclusion (T1) by two different blinded assessors. Concerning infants participating in the study arm with CP, a procedure was set up to ensure that the assessor would not know which randomisation arm infants were assigned to. Moreover, parents were told that verbal contact with the assessors would not possible. Only the physiotherapist/investigator who enrolled the child in the study and the physiotherapist who performed the CP with IET on infants in the CP randomisation arm (obtained by entering the initials and the randomisation site) knew which arm children had been assigned to. We developed this two-step, independent Wang Clinical Severity Score evaluation procedure to avoid any observer bias while relying on the satisfactory inter-observer reproducibility of the score assessment [13, 14, 15] and its utilisation for studies involving hospitalised infants [16,17]. We followed our usual standard of care and all the infants who participated in the study received CP with IET.

JCRM 2019-117 - D Evenou_F1

Figure 1. Flow chart

2.5 Intervention

All the physiotherapists/investigators in our study received training to comply with the standardisation of professional practice requirements and to ensure the reproducibility of the techniques. Chest physiotherapy as performed during this study involves a passive technique designed to produce sufficient airflow to generate air-mucus interaction. Passive expiration is produced through manual thoracic-abdominal pressure while respecting the mechanical rotational axis shared by the costovertebral and costotransverse joints. Two clinical indicators are used to check expiratory airflow: an audible indicator (an increase in wet or productive coughing sounds) and a tactile indicator (vibrations under the hand on the thorax) [18]. These two indicators guide the physiotherapist’s movements during CP. Because the anatomy of infants’ lower respiratory tract is associated with poor pulmonary compliance, it is important to carefully control the movements with each expiration in order to obtain a continuous flow without ever causing the collapse [4] of the peripheral bronchial structure. As long as the flow is audible from the infant’s mouth and the expiratory movement can be performed, there is no collapse [18]. Under these quality and safety conditions, this technique aims to produce drainage of the secretions and to reduce the obstructive syndrome related to congestion. The techniques used within the scope of the study did not require practising deliberate movements to assist coughing.

2.6 Primary endpoint

Our primary endpoint was comparing the number of responsive patients in each group. A responsive patient was defined as an infant whose Wang Clinical Severity Score decreased between the first and second assessment [19]. For the purposes of monitoring symptoms in an outpatient setting, this is a more significant occurrence than a simple variation in score. The Wang Clinical Severity Score [13] measures the degree of breathing difficulty (Table 1). A total score of less than or equal to 3/12 is interpreted as benign bronchiolitis, from 4 to 8/12 as moderate bronchiolitis, and 9/12 or more as severe bronchiolitis [19]. The scores were determined by blinded assessors who did not know to which group the patient had been assigned during randomisation.

Table 1. Wang Score definition

Score

0

1

2

3

Respiratory rate (breaths/min)

<30

31–45

46–60

>60

Wheezing

None

Terminal expiratory or only with stethoscope

Entire expiration or audible during expiration without stethoscope

Inspiration and expiration without stethoscope

Retractions

None

Intercostal only

Trachcostcmal

Severe with nasal flaring

General condition

Normal

Irritable, lethargic, poor feeding

2.7 Secondary endpoints

Changes in the Wang Clinical Severity Score assessed at T0 and at T1 after randomisation of each group.

CP tolerance among patients in Group A, based on events reported during chest physiotherapy: discomfort, vomiting, pain, worsening of the child’s condition.

2.8 Collected data

Collected data concerned, among other information: the identification of an atopic predisposition [20, 21], the infant’s age, concomitant treatment, and data recorded by the investigator physiotherapist in the electronic case report form developed for the purpose of the study.

2.9 Statistical analyses

For qualitative variables, absolute values and percentages were used. For quantitative variables, mean and standard deviation were used. Comparisons between the two groups were made using the Chi-square test, Fischer’s exact test, Student’s t-test or the Wilcoxon and Mann-Whitney tests, depending on the type and distribution of the variables. Matched data sets before and after care were analysed using paired Student’s t-tests or McNemar’s test, depending on the type of data.

The significance level was P<0.05. STATA v13.1 software (Stata Corporation, College Station, Texas, USA) was used for statistical analyses.

3. Results

3.1 Description of the study population

During the study period, we saw 190 infants in 4 centres (Figure 2). A total of 82 infants were included in the study, 41 in the group receiving chest physiotherapy (Group A) and 41 in the control group (Group B). The patient population within each group was comparable in terms of age and gender. The mean patient age was 204.8 days (±82.4) in Group A and 218 days (±81) in Group B.

JCRM 2019-117 - D Evenou_F2

Figure 2. Study design

There were more male than female infants in Group A (61%) and in Group B (56.1%). With respect to other demographic characteristics collected at inclusion, statistical tests revealed no difference in distribution (Table 2). In addition, there was no significant difference between the two groups with respect to the amount of time (number of days) the disease evolved after the randomisation.

Table 2. Characteristics of the study population

Item

GROUP A
chest physiotherapy
N = 41

GROUP B
not chest physiotherapy
N = 41

P

Age in days

204.8 (± 82.4), 198 [55; 363]

218 (± 81), 219 [79; 364]

0.47 *

Sex (Male)

25 (61%)

23 (56.1%)

0.65 **

Family history of asthma

10 (24.4%)

16 (39%)

0.15 **

History of eczema

3 (7.3%)

5 (12.2%)

0.71 ***

No treatment

15 (36.6%)

18 (43.9%)

0.50 **

Antibiotic treatment

10 (24.4%)

7 (17.1%)

0.41 **

Bronchodilator treatment

21 (51.2%)

20 (48.8%)

0.83 **

Corticosteroid treatment

7 (17.1%)

11 (26.8%)

0.29 **

Antitussive treatment

1 (2.4%)

1 (2.4%)

1.00 ***

Delay between the symptoms and the session

7.9 (± 7.1), 6 [1; 29]

4.8 (± 3.4), 4 [1; 17]

0.01 *

0.03 ****

* Student, ** χ², *** Exact de Fisher, **** Wilcoxon-Mann-Whitney

3.2 Results

At the end of the first CP session, 29 infants (70.7%) in Group A were responsive to CP with IET as reflected in a change in the severity classification level of their condition, compared to 4 infants (9.76%) in the control group (p<0.001) (Table 3). The results of Wang Clinical Severity Score (secondary endpoint) at T0 and T1 also changed significantly between the 2 groups. In Group A, they went from 4.83 (±0.86) to 2.83 (±1.16) and in Group B they went from 4.83 (±0.99) to 4.61 (±1.18) (Table 2). The mean decrease in the score was -2 (±1.32), -2 [-5; 0] in Group A compared to -0.22 (±0.99), 0 [-3; 1] in Group B (p<0.001) (Table 2).

Table 3. Evolution of the Wang Clinical Severity Score in Group A and Group B

First assesment

Second assesment

** Student

Group A
N=41

Group B
N=41

P**

Group A
N=41

Group B
N=41

P**

Wang Respiratory Scores values

4,83 (±0,86), 5 [4; 7]

4,83 (±0,99), 5 [4; 8]

1

2,83 (±1,16), 3 [1; 6]

4,61 (±1,18), 4 [2; 8]

< 0,001

Table 4. Comparing the decrease in clinical severity scores, Group A and Group B


GROUP A
chest physiotherapy

N=41


GROUP B

N=41

0–3 (%)

4–8 (%)

9–12 (%)

0–3 (%)

4–8 (%)

9–12 (%)

P

0–3

0 (0,0)

0 (0,0)

0 (0,0)

0–3

0 (0,0)

0 (0,0)

0 (0,0)

4–8

29 (70,7%)

12 (29,3%)

0 (0,0)

4–8

4 (9,76%)

37 (90,24%)

0 (0,0)

<0,001***

9–12

0 (0,0)

0 (0,0)

0 (0,0)

9–12

0 (0,0)

0 (0,0)

0 (0,0)

3.2.1 Differences between the groups in terms of Wang Score criteria

The Wang Clinical Severity Score items that were most impacted in Group A between T0 and T1 were respiratory rate and wheezing (Table 5).

Tableau 5. Variation in items on Wang Score between T0 and T, Group A and Group B

Wang T0

Wang T1

Item

Group A T0
N=41

Group B T0
N=41

P

Group A T1
N=41

Group B T1
N=41

P

Wang Score

0,630

0,000

1

0 (0%)

0 (0%)

5 (12,2%)

0 (0%)

2

0 (0%)

0 (0%)

12 (29,3%)

2 (4,9%)

3

0 (0%)

0 (0%)

12 (29,3%)

2 (4,9%)

4

17 (41,5%)

20 (48,8%)

10 (24,4%)

17 (41,5%)

5

16 (39%)

11 (26,8%)

1 (2,4%)

12 (29,3%)

6

6 (14,6%)

8 (19,5%)

1 (2,4%)

6 (14,6%)

7

2 (4,9%)

1 (2,4%)

0 (0%)

1 (2,4%)

8

0 (0%)

1 (2,4%)

0 (0%)

1 (2,4%)

Respiratory rate (breaths/min)

0,239

0,000

0

1 (2,4%)

0 (0%)

26 (63,4%)

10 (24,4%)

1

9 (22%)

12 (29,3%)

15 (36,6%)

26 (63,4%)

2

29 (70,7%)

23 (56,1%)

0 (0%)

5 (12,2%)

3

2 (4,9%)

6 (14,6%)

0 (0%)

0 (0%)

0,128

0 (0%)

0,003

0

4 (9,8%)

1 (2,4%)

19 (46,3%)

6 (14,6%)

1

13 (31,7%)

21 (51,2%)

14 (34,2%)

16 (39%)

2

22 (53,7%)

19 (46,3%)

8 (19,5%)

19 (46,3%)

3

2 (4,9%)

0 (0%)

0 (0%)

0 (0%)

Retractions

0,054

0,005

0

5 (12,2%)

0 (0%)

18 (43,9%)

5 (12,2%)

1

16 (39%)

22 (53,7%)

14 (34,2%)

19 (46,3%)

2

20 (48,7%)

19 (46,3%)

9 (22%)

17 (41,5%)

3

0 (0%)

0 (0%)

0 (0%)

0 (0%)

General condition

1,000

0,494

0

39 (95,1%)

39 (95,1%)

41 (100%)

39 (95,1%)

3

2 (4,9%)

2 (4,9%)

0 (0%)

2 (4,9%)

3.2.2 Monitoring undesirable side effects

No undesirable side effects were reported among the infants in Group A during the study.

4. Discussion

The effects of chest physiotherapy (CP) with increase exhalation technique (IET) for respiratory difficulties had not been studied up to now using a randomised approach with a control group in an outpatient setting. Ours was thus a first study conducted within the context of real-life infant bronchiolitis primarily targeting a clinical objective (change in the severity level). While the study required the involvement of a large number of healthcare professionals, this did not limit its feasibility nor its acceptability. In fact, it was thus possible to recruit a sufficient number of infants in each group while limiting observer bias, given that the assessors were independent and were not the same as the physiotherapists providing CP. Our study population’s gender and age (under 12 months) were representative of infants with bronchiolitis as described in the literature [4,12]. This study population requires outpatient care, since we excluded from the study any infants with very severe conditions (Wang Score >9) who needed to be hospitalised.

Our findings highlight a significant change in the initial severity classification level of the infants receiving care, with the severity level decreasing between the first and the second evaluation (Table 4). The data was corroborated by changes in the Wang Clinical Severity Score (Table 3). We chose to use this score [13] as our secondary endpoint based on its inter-observer reproducibility, which is moderate according to Landis and Koch classification (Kappa=0.48) [14]. Moreover, this score has been used several times in studies to assess the effects of CP [16, 17].

Given the characteristics of the study population, the clinical improvement we observed appears to be statistically unrelated to age at the first session, the presence of an atopy or treatment with prescribed drugs, whether or not it is adhered to (Table 2). It appears to indicate that practicing CP with IET has an effect on the short-term progress of the respiratory difficulty parameters observed in bronchiolitis. If we limit ourselves to the increased exhalation technique (IET) alone, it could impact the bronchial (airway) tree hydrodynamic resistance caused by overproduction of secretions [22], one of the three causes of obstruction in bronchiolitis, along with inflammation and the possible role of bronchial hyper reactivity [23]. This could explain the observed control over the course of the disease in the short term, based on the items in the Wang Clinical Severity Score (respiratory rate, wheezing), with as a corollary, the study populations tending to move toward less severe scores.

A discussion of our findings would nevertheless not be complete without mentioning factors that study participants may have been exposed to but which were not included or evaluated as part of our study, and whose impact cannot be measured – such as, for some infants, the use of induced coughing manoeuvres that may have impacted the results. Yet the purpose of this clinical study was to assess the practice of IET alone; spontaneous coughing, which occurs naturally as part of the disease, is not sufficient alone to limit a patient’s symptoms given its weak “efficacy” [24]. A future protocol that studies an “induced cough” group independently would make it possible to detect a possible causal relationship. In another area, a potential “care provider” effect seems to be possible. Reported recently, this effect has a positive impact on the occurrence of respiratory tract infections in the medium to long term [25]. The design of our study allowed only the quantification of short-term effects, and it is unlikely that effects related to the care provider could be observed in such a short amount of time.

The data from our study did not provide an indication of the potential long-term effects of the care that was provided. To address this question, we collected data about the infants’ subsequent progress by submitting a questionnaire to their parents 7 days after the CP. According to survey respondents (n=52), 25% of the infants saw a doctor, 8% were taken to the paediatric emergency department, and one infant required hospitalisation. In addition, it is worth noting that the absence of reported undesirable side effects in the study appears to confirm the observations of two studies in the Cochrane Review [6]. The potential occurrence of undesirable side effects in the study population must also be considered. Ambulatory patients with moderate bronchiolitis are naturally less at risk than hospitalized patients, who may be younger and may present more severe forms of bronchiolitis. For these patients, it would be reasonable to carry out a benefit/risk analysis before considering this type of care. Lastly, a word about care management: Although to date there have been few arguments to justify the level of prescriptions for outpatient CR with IET in France [26], the immediate decrease in the severity of respiratory difficulty observed in our study may explain this practice, initially based on expert opinion and the observation of considerable clinical improvement [4].

5. Conclusion

Several authors have called for a randomised, controlled study of infants with bronchiolitis in an outpatient setting [8, 25]. Based on our findings, this first study contributes to changing perceptions of the value of chest physiotherapy (CP) with increase exhalation technique (IET) for this indication [25]. The observed clinical improvement, confirmed by a change in the immediate severity score, may reflect the impact on the short-term improvement of respiratory parameters of care provision based on CP with IET. This is in addition to the recognized role of the physiotherapist in monitoring the child’s condition and providing information and guidance to families [12]. Subsequent studies could usefully focus on correlating this symptomatic effect with improvements in the infants’ comfort, sleeping and feeding within the scope of a new qualitative study.

Acknowledgments

The authors would like to thank all the infants who participated in the study as well as their parents and all the physiotherapists who took part in the children’s enrolment and care.

We would also like to thank the Clinical Research Centre (CRC) of the Créteil Inter communal Hospital Centre for providing methodological support, and ACTIV (Association Clinique Thérapeutique Infantile du Val de Marne), C. Levy and S. Bechet for data management and statistical processing.

Competing interests

The authors declare that they have no competing interests

Declaration of Interest: Conflicts of interest: none.

Abbreviations

ANAES: French National Agency for Health

ANSM: French National Agency for Medicines and Health Products Safety

APHP: Paris Pubic Hospitals Group

CHU: teaching hospital

CNIL: French Data Protection Authority

CP: chest physiotherapy

CPP: Committee for the Protection of Persons (ethics committee)

CRC: centre for clinical research

idf: Ile de France Region (it includes the city of Paris and the surrounding area)

IET: increased exhalation technique

References

  1. National Institute for Health and Care Excellence NICE. Bronchiolitis in children: diagnosis and management. NICE Guideline Juin 2015
  2. Subcommittee on Diagnosis and Management of Bronchiolitis. Diagnosis and Management of Bronchiolitis. Pediatrics 2006 October 1, 2006; 118(4): 1774–93.
  3. Ralston SL, Allan S, Lieberthal H Meissner HC and al. Clinical practice guideline: the diagnosis, management, and prevention of bronchiolitis. Pediatrics 2014; 134: e1474-e1502
  4. Conférence de consensus prise en charge de la bronchiolite du nourrisson. Texte du consensus Anaes 2000.Sept 20
  5. Bohe L, Ferrero ME, Cuestas E, Polliotto L and al Indications of conventional chest physiotherapy in acute bronchiolitis. Medicina 2004; 64 (3): 198–200.
  6. Roqué I, Figuls M, Giné-Garriga M,  Granados Rugeles C and al Chest physiotherapy for acute bronchiolitis in paediatric patients between 0 and 24 months old. Cochrane Database Syst Rev.  2016 Feb 1; 2: CD004873
  7. Rochat I, Leis P, Bouchardy M, Oberli C and al. Chest physiotherapy using passive expiratory techniques does not reduce bronchiolitis severity: a randomized controlled trial. Eur J Pediatr. 2012 Mar; 171 (3): 457–62.
  8. Gajdos V, Katsahian S, Beydon N, Abadie V and al. Effectiveness of chest physiotherapy in infants hospitalized with acute bronchiolitis: a multicenter, randomized, controlled trial. PLoS Med 2010; 7(9): e1000345.
  9. Van Ginderdeuren F, Vandenplas Y, Deneyer M,Vanlaethem S and al. Effectiveness of Airway Clearance Techniques in Children Hospitalized With Acute Bronchiolitis Pediatric Pulmonology 2017; 52: 225–231
  10. Evenou D, Sebban S, Fausser C, Girard D Evaluation de l’effet de la kinésithérapie respiratoire avec augmentation du flux expiratoire dans la prise en charge de la première bronchiolite du nourrisson en ville. Kinesither Rev 2017; 17(187): 3–8,
  11. Sebban S, Pull L, Smail A, Menier I and al Influence of chest physiotherapy on the decision of hospitalization of the infant with acute bronchiolitis in a pediatric emergencies department. Kinesither Rev 2017;
  12. Verstraete M, Cros P, Gouin M, H. Oillic and al. Prise en charge de la bronchiolite aiguë du nourrisson de moins de 1 an: actualisation et consensus médical au sein des hôpitaux universitaires du Grand Ouest (HUGO). Arch Pédiatr. 2014; 21(1): 53–62. 17 (183): 3–8.
  13. Wang EE, Milner RA, Navas L, Maj H. Observer agreement for respiratory signs and oximetry in infants hospitalized with lower respiratory infections. Am Rev Respir Dis. 1992; 145: 106–9
  14. Landis J.R., Koch G.G.: The Measurement of Observer Agreement for Categorical Data, Biometrics, 1977a, 33, 159–174.
  15. Gajdos V, Beydon N, Bommenel L, Pellegrino B and al. Inter-observer agreement between physicians, nurses, and respiratory therapists for respiratory clinical evaluation in bronchiolitis. Pediatr Pulmonol.  2009 Aug; 44(8): 754–62.
  16. Postiaux G, Louis J, Labasse HC, Gerroldt J and al. Effects of an alternative chest physiotherapy regimen protocol in infants with RSV bronchiolitis. Respiratory Care 2011; 56(7): 989–94. [DOI: 10.4187/respcare.00721; PUBMED: 21352671]
  17. Gomes EL, Postiaux G, Medeiros DR, Monteiro KK and al. Chest physical therapy is effective in reducing the clinical score in bronchiolitis: randomized controlled trial [A fisioterapia respiratória é eficaz na redução de escore clínico na bronquiolite: ensaio controlado randomizado]. Revista Brasileira de Fisioterapia 2012; 16: 241–7.
  18. Jeulin JC (2014) Approche Anthropologique du développement des compétences des masseurs-kinésithérapeutes. Conception d’un environnement informatique pour l’apprentissage en masso-kinésitherapie, Doctorat en Sciences de l ’Education, université de Provence Aix Marseille, en ligne.
  19. Postiaux G, Zwaenepoel B, Louis J. Chest physical therapy in Acute viral bronchiolitis. An updated review. Resp Care 2013; 58: 1541–5.
  20. Zedan M, Gamil N, El Assmy M, Fayez E and al A Montelukast as an episodic modifier for acute viral bronchiolitis a randomized trial. Allergy Asthma Proc. 2010; 31 (2): 147–53
  21. Castro-Rodriguez JA, Wright AL, Holberg CJ, Martinez FD and al A Clinical Index to Define Risk of Asthma in Young Children with Recurrent Wheezing, American Journal of Respiratory and Critical Care Medicine, Vol. 162, No. 4 (2000), pp. 1403–1406.
  22. Mauroy B, Pelca D, Fausser C, Merckx J and al Toward the modeling of mucus draining from human lung: role of airways deformation on air-mucus interaction. Physical biology, 2011
  23. Cody Meissner H, Viral Bronchiolitis in Children. N Engl J Med 2016; 374: 62–72 January 7, 2016
  24. Ecoffey C, Hamza J, Meistelman C, Physiologie respiratoire du nourrisson. Anesthésiologie pédiatrique 1997
  25. Alexandrino AS, Santos R, Melo C, Bastos JM and al. Caregivers’ education vs rhinopharyngeal clearance in children with upper respiratory infections: impact on children’s health outcomes. Eur J Pediatr 2017; 363: 1–9.
  26. Joud P, Fetouh M, Billet D, Pierre B and al. La kinésithérapie est-elle toujours la pierre angulaire du traitement ? Arch Pédiatr 2014; 21: 228–229