Author Archives: dev

Increase in Parental Knowledge and Confidence Following Communication of Dental Imaging Risks versus Benefits

Abstract

Objective: To explore the role of parental education and communication of risks versus benefits of pediatric dental image on parents’ knowledge, comfort and confidence in allowing their children to receive the necessary imaging procedures.

Methods: Parents of children <18 years of age were recruited during routine dental visits at the Boston University Pediatric Oral Health Care Center and Department of Dentistry at the Boston Medical Center, Boston, Massachusetts. Participants completed two brief questionnaires immediately before and after the educational intervention. A brief two-sided printed informational handout and a mobile application called Medical Imaging Risk (MIR) were used in the educational intervention for parental health education and communication of information on radiation risks. Statistical analysis was conducted using STATA version 14.0 to compare pre-intervention and post-intervention responses of participants.

Results: Among 213 parents, the majorities were mothers (83%), African American (55%), with MassHealth insurance (82%) and reported that their child/children have had previous dental radiographs (75%). A significant improvement in confidence of their knowledge on benefits and risks of dental imaging was observed following the educational intervention (p<0.001). Parents’ level of comfort in allowing the use of dental radiographs for their children significantly improved after the educational intervention (p<0.001). Parents preferred the printed handout (53%) only slightly more than the mobile application (47%).

Conclusion: The results from our study suggest that a simple brief educational intervention that includes easy to understand materials can significantly improve parental level of knowledge and confidence towards pediatric dental imaging. Thus dental practitioners should aim to include risk-benefit dialogues as part of the routine dental care visit to improve communication and acceptance of pediatric imaging.

Keywords

Health Communication, Pediatric Dentistry, Children, Radiation Imaging, Radiation Risks, Dental Imaging, Dental Radiography, Parental Knowledge, Educational Intervention.

Introduction

Patient communication of health information is a key component of patient care and management. In particular, communicating risks and benefits of medical and dental procedures enables better understanding and decreases the level of anxiety among patients. Radiation imaging has been known to cause fear and anxiety among patients due to the general perception of radiation as a ‘hazard’ [1]. This fear, caused mainly by incomplete understanding of the benefits versus risks of radiation imaging, has been further fueled by historical radiation related disasters, media reports, social media, previous experience, experiences or shared by family and friends. Recent evidence in the literature also suggests that significant gaps exist between patient expectations and provider communication of benefits versus risks of medical imaging [2]. These gaps also extend to dental imaging procedures which can be overcome through improved risk-benefit dialogues between practitioners and children, and their parents or guardians. To improve the current practices in risk communication strategies the World Health Organization (WHO) organized an International Workshop on Radiation Risk Communication in Pediatric Imaging in September of 2010 and in collaboration with a working group released a publication titled “Communicating Radiation Risks in Paediatric Imaging” [3]. This publication was developed to aid health professionals on communication of radiation risks in pediatric imaging more efficiently and to provide guidance on risk-benefit dialogues with children and their parents.

Dental radiology has evolved over the years and is currently being used widely in children for diagnosis and management. In pediatric dentistry in particular, dental imaging has played an important role in a child’s first visit to the dentist as it is not only a vital part in a thorough examination of the oral cavity but is a simple procedure that is used to also gain the child’s confidence [4]. While radiation emission from dental imaging is lower than from medical imaging procedures, dental practitioners should weigh the benefit and need for the imaging procedure among children over the risks involved to make a clinical judgement keeping in mind the interest of each patient. In recent years there has been a significant increase in the use of dental radiography in the United States (US) with over 500 million intra-oral bitewing and panoramic radiographic procedures [5]. Also, the number of Cone Beam Computed Tomography (CBCT) procedures have also significantly increased over the years. As a result, the overall contribution of radiation exposure from dental imaging procedures is increasing and is about 50% of the annual per capital radiation dose in the US [6]. In light of these increases the American Dental Association (ADA) in collaboration with 80 other health care organizations developed a program called ‘Image Gently’ in 2007 which is an initiative to raise awareness and educate practitioners to provide safe pediatric imaging [7]. This alliance was also developed to educate providers on selecting imaging procedures based on individual needs and to limit the exposure time among children. The ‘Image Gently in Dentistry’ campaign was specifically launched to promote responsible use of dental radiography and to improve radiation safety in pediatric dental imaging [6]. The main goals of this campaign is based on the concept of reducing radiation exposure in children As Low As Diagnostically Acceptable (ALADA) while achieving effective images that aid in diagnosis.

Radiation exposure is the amount of radiation charge produced by ionizing radiation during imaging procedures whereas absorbed dose describes the amount of emitted radiation absorbed at a point [8]. This absorbed dose is converted to equivalent dose by multiplying the radiation delivered for each type of radiation. Effective dose is the total amount of radiation exposure estimated from the total equivalent dosages and [3] can be expressed in Sieverts (Sv) based on the System International nomenclature [3]. The radiation dose emitted in diagnostic imaging is expressed as milliSieverts (mSv) [9]. When comparing the radiation exposure between medical imaging procedures versus dental imaging, the exposure from dental radiographs are much lower. For example, the radiation dose from a set of four intra-oral bite-wing radiographs is 0.005 mSv and from a single panoramic radiograph is 0.01 mSv which is equivalent to <1 day and 1.5 days of exposure to natural radiation respectively [3,8]. In comparison, the radiation exposure from a chest x-ray for a 5 year old child is 0.02 mSv which is equivalent to 3 days of natural radiation exposure. A Computed Tomography (CT) scan to the head of a 5 year old emits 2 mSv radiation and is equivalent to 10 months of natural radiation exposure whereas one CBCT procedure leads to radiation exposure of 0.107 mSv which is less than five months of natural radiation exposure, demonstrating that dental imaging procedures lead to much lower radiation exposure. The risks from exposure resulting from all types of diagnostic imaging and its effects are not completely understood [3]. Effects such as cell death, hair loss, skin redness etc. occur at much higher doses of exposure than the exposure from dental diagnostic imaging. Long-term risk of developing cancer has been suggested based on some epidemiologic evidence for radiation doses of 50–100 mSv which would be the accumulated dose after multiple CT scans. However, since children have a long period of life ahead, the low dose exposures from diagnostic imaging in the early years of life may accrue and eventually may lead to a small increase in lifetime risk of cancer in the future. Hence given the lack of strong evidence and the uncertainty it is important for dental practitioners to take a precautionary approach when using pediatric imaging. Also, by improving patient and parent-provider communication about risks versus benefits, informed decisions can be made that will ultimately benefit the child patients.

There are only a few studies that explored the perspectives of parents and communication of radiation risks most of which are related to medical imaging procedures. Limited evidence exists on communication of dental radiation risks and parents’ knowledge and perception towards dental radiography. A study in Australia explored parental level of knowledge and attitude towards dental radiography for children [10]. That study analyzed 309 surveys completed by parents and the results showed a low level of knowledge but positive attitude towards dental radiographs. Also in that study, parents’ level of education and parents with children who have had radiographs previously were more likely to have a higher level of knowledge. In the same study when participants were asked about whether they received information on radiation risks, <40% reported that they had been informed of the risks by their providers. Similar findings have been reported in studies on medical imaging where participants have low level of knowledge and report that they did not receive the information on the risks of medical imaging [11,12]. A more recent study evaluated patients’ perception on dental radiographs in Malaysia and reported a significant lack of knowledge about the role of dental radiographs. In that study among the participants 57% believed that dental radiographs should be avoided in pregnant women and 32% believed that dental radiographs should be avoided in children [13]. Studies on communicating risks clearly highlight the gaps in provider-patient or parent communication. Evidence also suggests that parents who did receive information prior to imaging procedures report lower levels of anxiety during the procedures [11]. Insufficient data is available on the preferred method of communication in dental imaging risks versus benefits. One study in Spain among 602 participants reported that participants preferred both oral and written forms of communication with no significant preference of one over the other [14]. With the current technological advances there is an increase in usage of other modes of communication such as online resources, phone applications and text messaging however there is a lack of epidemiological data that supports the use of these methods and there is insufficient evidence on the most effective form of communication of health information.

Our study was developed to explore the role of parental education and communication of risks versus benefits of dental imaging on parents’ knowledge, comfort and confidence in allowing their children to receive the necessary dental imaging. Results from our pilot study has been published previously [15,16]. In this report we describe the study that was conducted and the results obtained from a larger sample with additional investigation on the preferred method of communication of risks versus benefits in comparison to our pilot study. Specifically our hypothesis was that a brief educational intervention by the dental provider will increase the level of confidence and comfort among parents and those parents prefer a specific mode of communication of health information.

Methods

Note: A description of the study methods and results from our pilot study was published previously [15,16].

The sample population in this study included parents or guardians of children under 18 years of age. The participants were recruited during routine dental care visits for their children at either the Pediatric Oral Health Care Center in Boston University Goldman School of Dental Medicine or Department of Pediatric Dentistry at the Boston Medical Center, Boston, Massachusetts. A convenience sampling method was used to recruit any one parent or legal guardian per family and only those who were proficient in the English language were included. Following verbal consent, the parents completed two brief questionnaires and an intervention using a handout and a mobile phone application was conducted as well by the study investigator. The parents completed the questionnaires and the intervention while waiting during their children’s dental treatment. The time taken for participants to complete the questionnaires and the educational intervention was between 15–20 minutes. This study was approved by the Boston University Medical Center Institutional Review Board.

Educational Intervention

The materials utilized for the educational component in this study included a short two-sided informational handout titled ‘Are dental radiographs safe for your children?’ (S1a and S1b Figures), and a mobile application called ‘Medical Imaging Risk (MIR)’ (S2 and S3 Figures). The informational handout used in this study was in English language, easy to read and the content was prepared at the 8th grade level as is the standard when preparing patient related text (S1a and S1b Figures). Colorful images, text and tables were used to educate parents on dental radiography and provide information on sources of radiation and their different dose estimations highlighting the radiation dose with routine dental radiographs. The handout while emphasizing the benefits and importance of dental radiography in early diagnosis and treatment also outlined the possible risks from unnecessary imaging procedures.

JDMR-19-124-Jayapriyaa R. Shanmugham_USA_F1

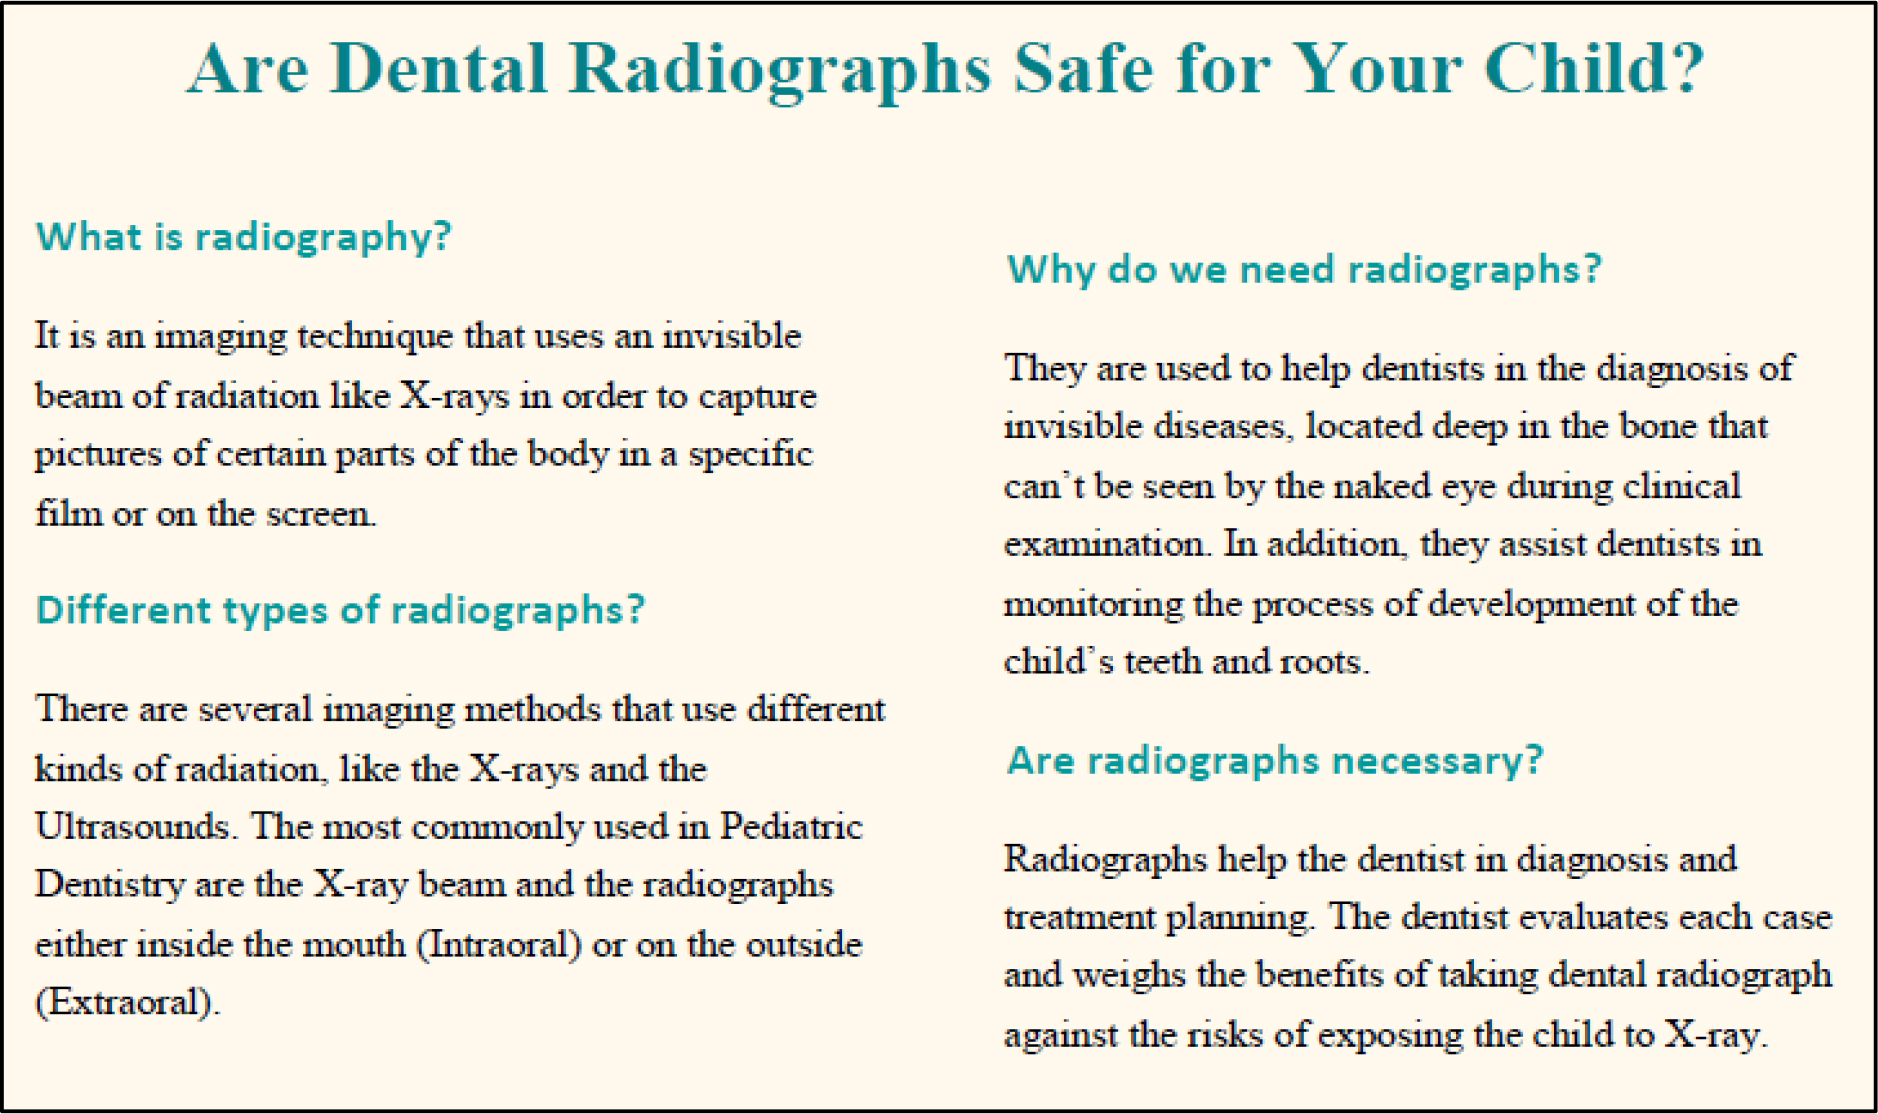
S1a Figure. Information on side 1 of the printed handout:

JDMR-19-124-Jayapriyaa R. Shanmugham_USA_F2

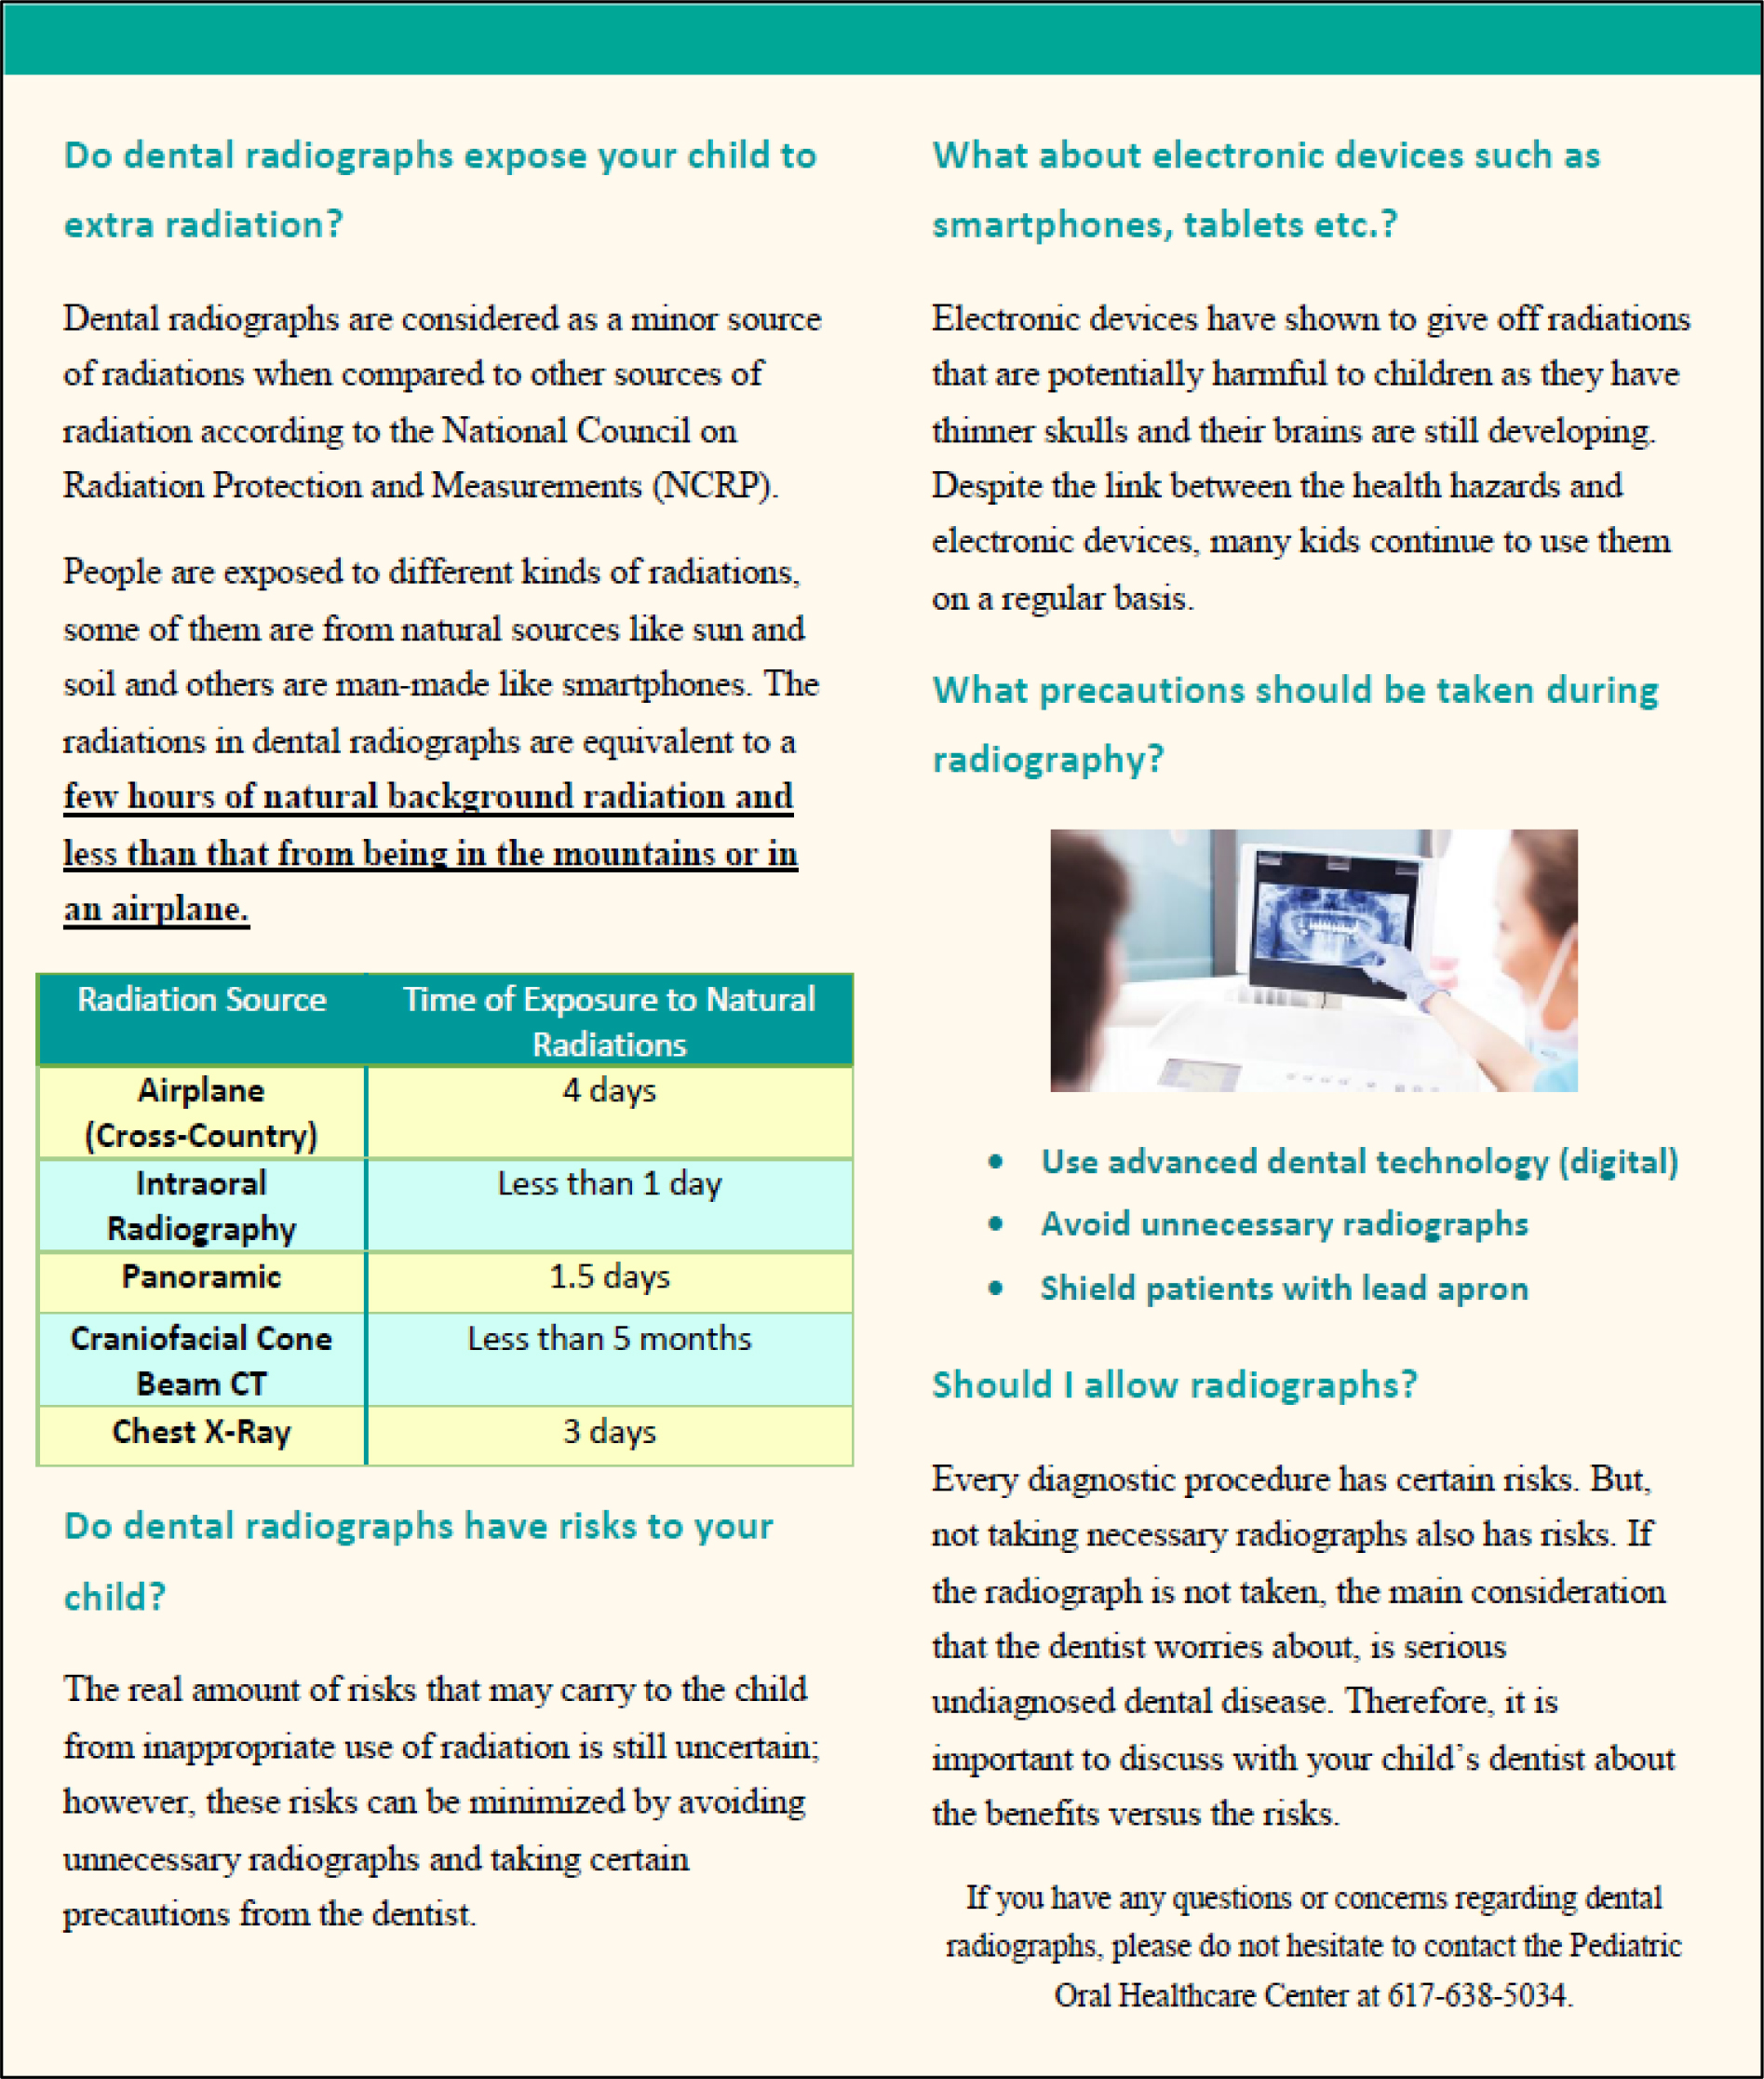
S1b Figure. Information on side 2 of the printed handout:

S1 Figure. Printed two-sided informational handout used in the educational intervention.

JDMR-19-124-Jayapriyaa R. Shanmugham_USA_F3

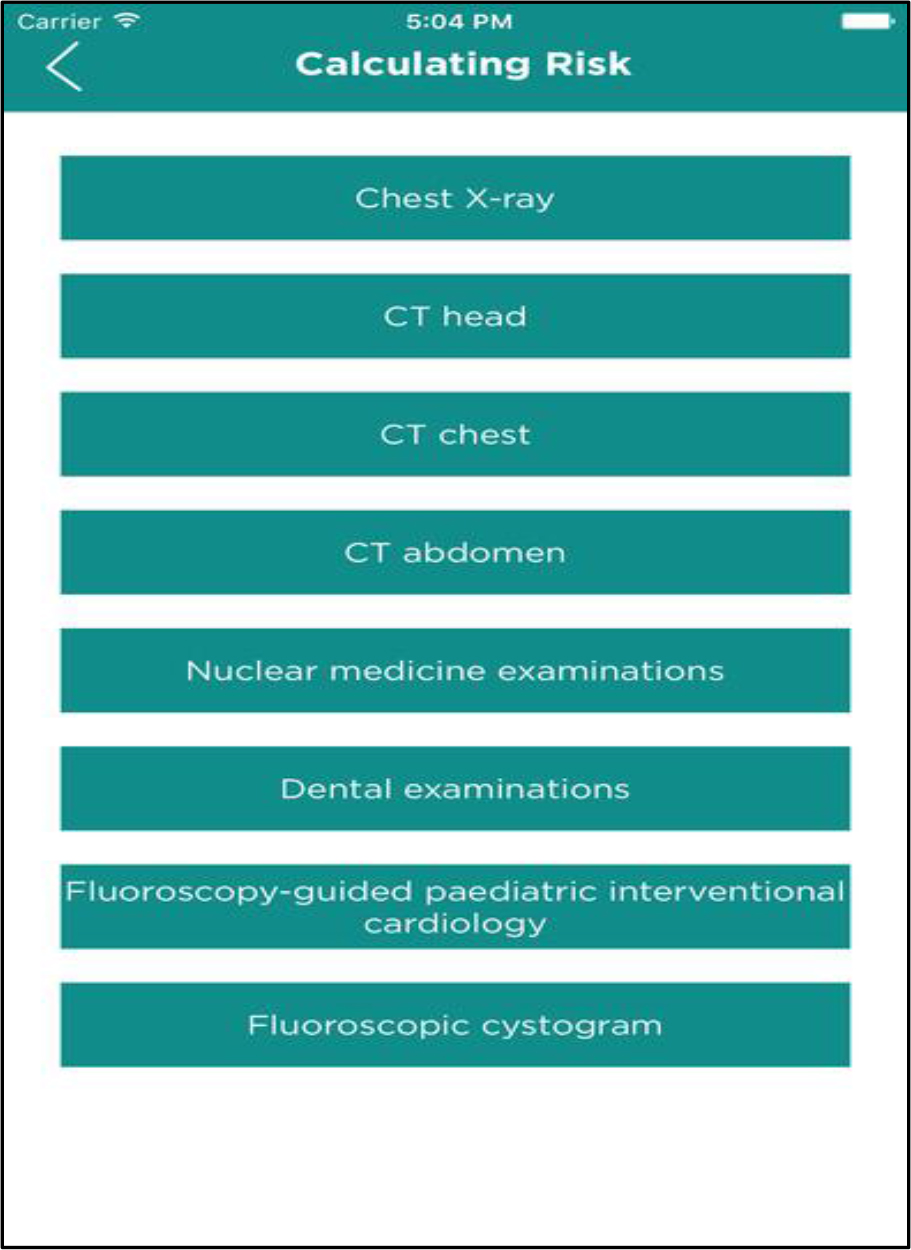
S2 Figure. Medical Imaging Risk (MIR) mobile application: Types of radiographic tests listed in the application.

JDMR-19-124-Jayapriyaa R. Shanmugham_USA_F4

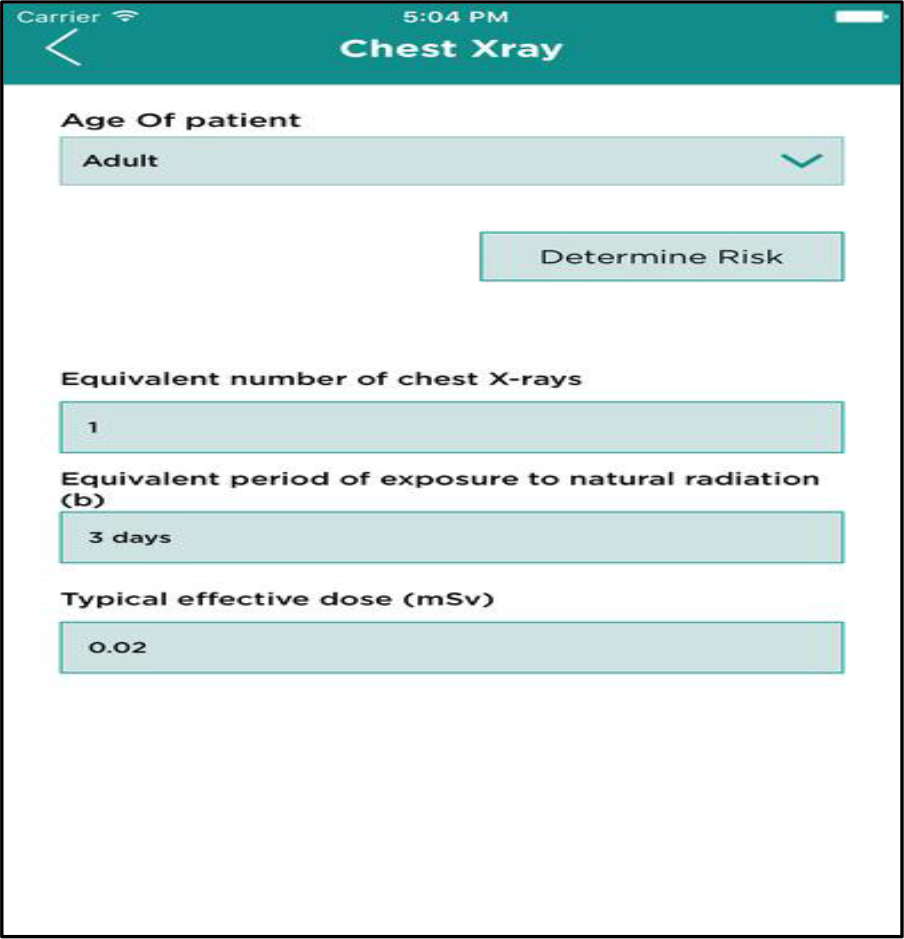
S3 Figure. Medical Imaging Risk (MIR) mobile application: Types of dose equivalents for selected radiographic test by age.

Following the discussion using the informational handout, the mobile application (app), MIR was used to continue an interactive discussion on radiation imaging (S2 Figure). The use of the app was demonstrated, and participants were shown that this app can be easily downloaded for free on both the Android and Apple platforms. This user-friendly app provides information on the various dosages and risks by type of radiation imaging (S3 Figure). The app also provides additional resources for further detailed information that the participants can download for free.

Study Questionnaires

Two questionnaires, one immediately before (pre-intervention) and one immediately after (post-intervention) the educational intervention were used to obtain information on parents’ knowledge and perception towards pediatric imaging.

Pre-intervention questionnaire

In the pre-intervention questionnaire, which included 5 questions, parents responded if their child or children ever received dental imaging. Irrespective of their response to this question parents completed the remainder of the questionnaire. Parents responded to questions on the level of confidence in their knowledge on risks and benefits of radiation and were asked to choose from three options: Not confident, somewhat confident and very confident. To evaluate specific knowledge, parents were asked to respond to whether smartphones and electronic devices emitted harmful radiation to which they responded ‘yes’ or ‘no’. Participants also responded to their level of comfort in their child undergoing any type of radiation imaging by choosing from three options: Not comfortable, somewhat comfortable and very comfortable. Demographic information such as participants’ gender, race, ethnicity and insurance type were also obtained in the pre-intervention questionnaire to evaluate differences in parent responses.

Post-intervention questionnaire

The post-intervention questionnaire, which included 8 questions, included the same five questions that was in the pre-intervention questionnaire, to evaluate a change in perception or comfort if any as a result of the intervention. In addition, questions on whether the educational material discussed during the intervention improved their understanding about dental radiographs and if the participants continued to have concerns about them were also included and both of these questions generated a response of ‘yes’ versus ‘no’. One of the goals of the post-intervention questionnaire was also to explore the preferred method of communication when receiving health information during dental care visits and the participants chose between printed materials versus mobile application. This question was not included initially however it was added later during the study as our goal was also to collect data on the parent perspective related to the educational material. As a result not all of the participants responded to this question. The study application was amended with this additional question and IRB approval was obtained to make this change.

Statistical Analysis

Participants’ responses to the questionnaires, pre versus post intervention, were compared and analyzed using STATA version 14.0 statistical analysis software. Differences in knowledge and perception were also evaluated by demographic characteristics. Descriptive and univariate categorical data analysis was conducted to evaluate differences and p-values <0.05 were considered statistically significant.

Results

A total of 213 parents participated in this study, reflecting the population base of the Boston University Goldman School of Dental Medicine. The majority were mothers (82.6%), having Medicaid as their primary dental insurance (81.7%). Also, most of the participants were African Americans, 54.9% followed by 17.8%n White; 7.04% Asian; and 16.4% self-identified as Hispanic/Latino (S1 Table).

Most of the participants in this study (75%) reported that their child/children have had previous dental radiographs (S1 Table). When comparing participants’ level of confidence on their knowledge towards benefits of dental radiographs for their children, 74% of participants reported either not confident or somewhat confident in the pre-intervention questionnaire. This trend changed in the post-intervention period as an improvement in the level of confidence was evident with 65% of the participants reporting that they are very confident. This improvement in the level of confidence was statistically significant with p<0.001 (S1 Table). Similarly, when evaluating the confidence level on the knowledge of risks of dental radiographs for their children, 69% of participants were either not confident or somewhat confident in the pre-intervention questionnaire. However, this trend also changed in the post-intervention period where 58% reported being very confident with statistically significant results (p<0.001).

S1 Table. Characteristics of the study participants (N = 213).

Characteristic

n (%)

Gender, n (%)

Females

176 (82.6%)

Males

37 (17.4%)

Race/Ethnicity, n (%)

Caucasian

 38 (17.8%)

African American

117 (54.9%)

Hispanic/Latino

35 (16.4%)

Asian/Pacific Islander

15 (7.04%)

Other

8 (3.8%)

Type of insurance, n (%)

MassHealth

174 (81.7%)

Other

 39 (18.3%)

History of previous dental radiographs for participants’ child/children, n (%)

Yes

159 (74.7%)

No

54 (25.4%)

In the pre-intervention, more than half the study population (59%) reported that they were either not comfortable or somewhat comfortable in allowing dental radiographs for their children (S2 Table). However following the educational intervention, in the post-intervention, a significant majority (66%) reported being very comfortable (p<0.001).

In the post-intervention analysis regarding the helpfulness of the educational materials, the great majority (94%) had a positive response (S4 Figure). Eighty two percent reported no concerns with dental radiographs after reviewing the materials during the educational intervention (S2 Table). When evaluating the preferred method of communication of health information, interestingly the responses were almost equally distributed. As mentioned previously, this question was initially not included in the post-intervention questionnaire and was added after our pilot exploration. Therefore, the complete sample population was not included in the comparison of preferred method of communication. Among 147 parents or caregivers 53% reported that they preferred the printed handout versus 47% reported that they preferred the mobile phone application (S5 Figure). No significant differences by gender, race/ethnicity and insurance type was observed as the majority of the participants in this study was women, African-American and had Medicaid insurance (S1 Table). Hence due to the lack of variability by demographic characteristics we did not observe statistically significant differences by these characteristics and were unable to explore potential confounding by these factors in multivariate analyses.

JDMR-19-124-Jayapriyaa R. Shanmugham_USA_F5

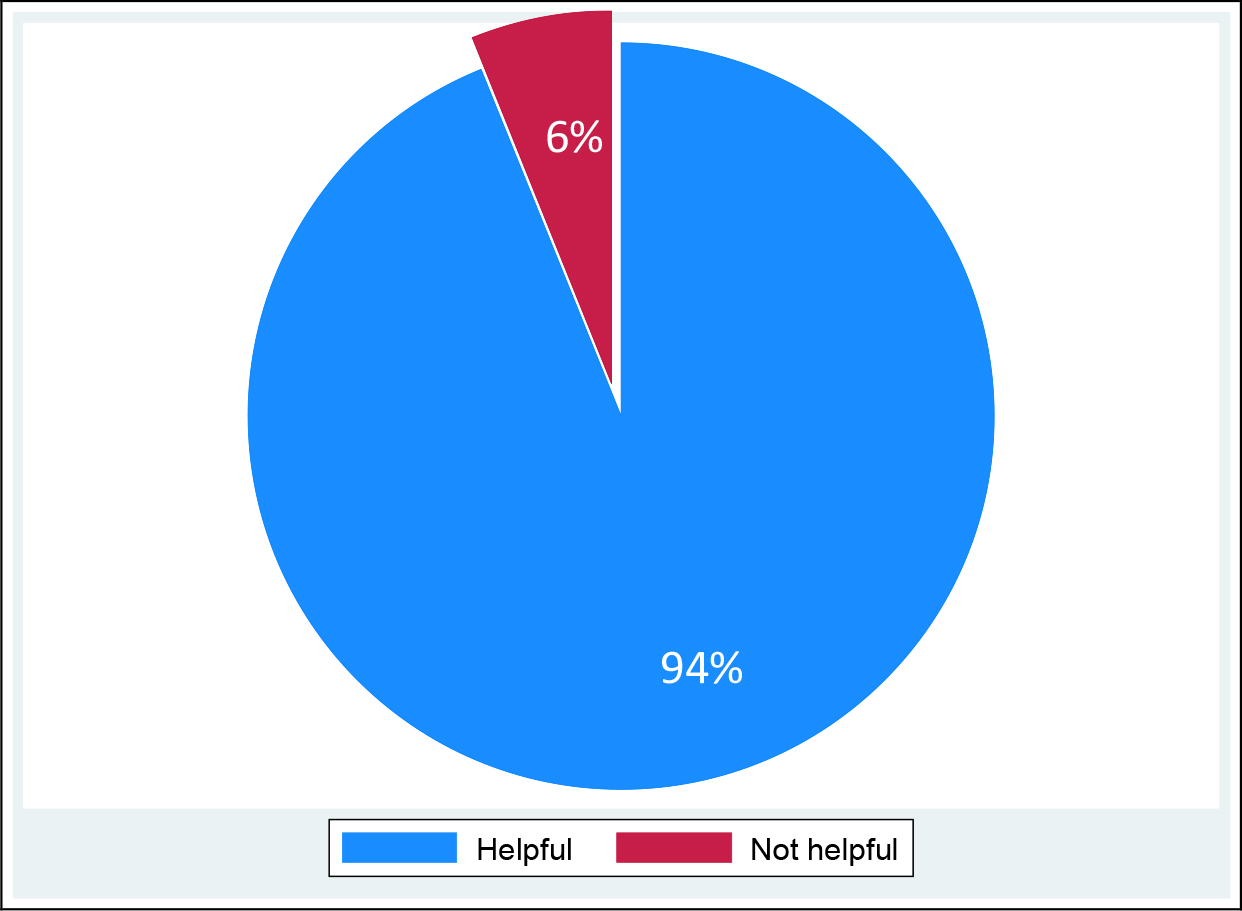
S4 Figure. Helpfulness of the educational materials in understanding of pediatric radiation imaging (post-intervention) N = 213.

JDMR-19-124-Jayapriyaa R. Shanmugham_USA_F6

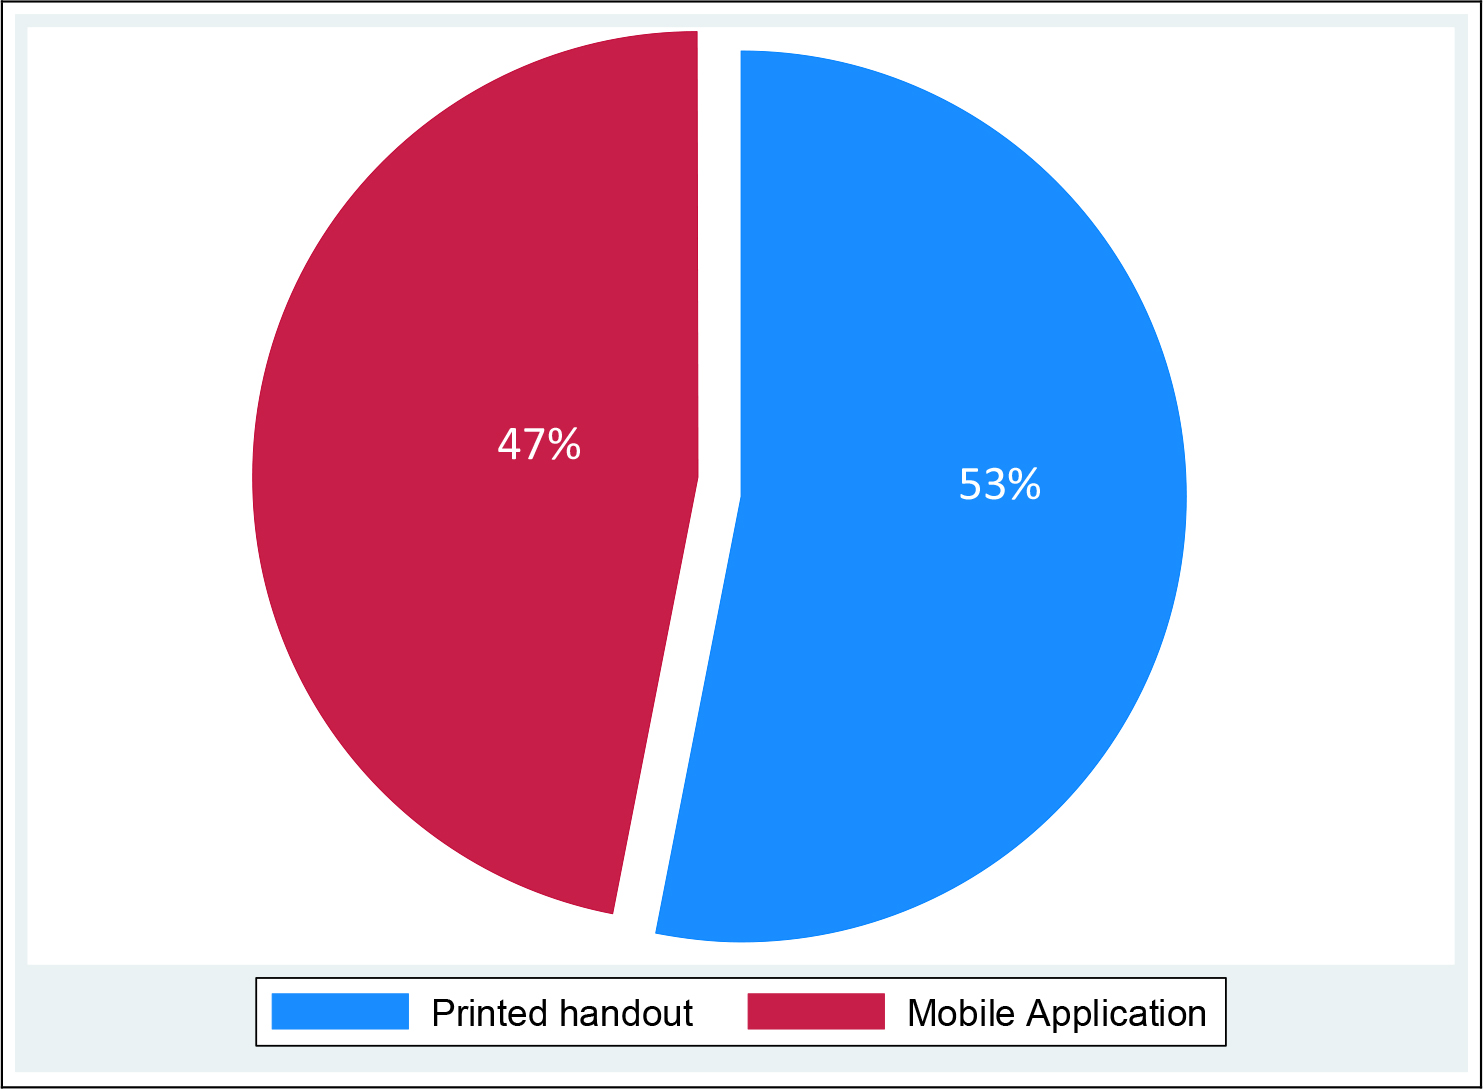
S5 Figure. Preference for receiving health information (post-intervention) N= 147.

S2 Table. Evaluation of parental knowledge and attitudes of radiation imaging among pediatric caregivers at the Pediatric Oral Health Center (N = 213)

Radiation Imaging

Pre-test questionnaire

n (%)

Post-test questionnaire

n (%)

p-value

Level of confidence in knowledge about benefits

Not confident

52 (24.4)

2 (0.94)

Somewhat confident

105 (49.3)

72 (33.8)

Very confident

56 (26.3)

139 (65.3)

<0.0001*

Level of confidence in knowledge about risks

Not confident

38 (17.8)

9 (4.2)

Somewhat confident

109 (51.2)

80 (37.6)

Very confident

66 (31.0)

124 (58.2)

<0.0001*

Level of comfort in allowing the use of dental radiographs

Not comfortable

28 (13.2)

11 (5.2)

Somewhat comfortable

98 (46.0)

61 (28.6)

Very comfortable

87 (40.8)

141 (66.2)

<0.0001*

Reported understanding of radiation from electronic devices

Yes

140 (65.7)

162 (76.1)

No

73 (34.3)

51 (23.9)

<0.0001*

Level of comfort in using dental radiographs by race/ethnicity before intervention

Not comfortable

Somewhat comfortable

Very comfortable

White

7 (25)

21 (21.4)

10 (11.5)

African-American

15 (53.6)

50 (51.0)

52 (59.8)

Hispanic/Latino

6 (21.4)

17 (17.4)

12 (13.8)

Pacific Islander

0 (0)

6 (6.1)

9 (10.3)

Other

0 (0)

4 (4.1)

4 (4.6)

0.29†

Level of comfort in using dental radiographs by race/ethnicity after intervention

White

3 (27.3)

12 (19.7)

23 (16.3)

African-American

5 (45.5)

32 (52.5)

80 (56.7)

Hispanic/Latino

2 (18.2)

14 (22.9)

19 (13.5)

Pacific Islander

1 (9.1)

1 (1.6)

13 (9.2)

Other

0 (0)

2 (3.3)

6 (4.3)

0.47

Concerns regarding dental radiographs (post-intervention)

n (%)

Yes

174 (81.7)

No

39 (18.3)

*Results from Pearson Chi-square analysis.
†Based on results from Fisher’s Exact analysis;
‡Post-intervention question

Discussion

Overall the results from our study indicate that a simple brief educational intervention in the dental office can not only improve parental the level of knowledge but can also increase their level of confidence and comfort thus enabling them to be more accepting and comfortable with radiation imaging procedures for their child/children. Our study also explored the preferred mode of communication among parents and we observed that the majority preferred the printed informational handout over the mobile application.

Communication of health risks and benefits is an important step towards better provider-patient relationship. Particularly in pediatric dentistry the level of anxiety among children and their parents are high due to mainly lack of knowledge among patients and parents, which may be as a result of failing to receive adequate information prior to dental procedures. While dental providers showed an acceptable level of knowledge on radiation risks, evidence from one study reported that the patients’ knowledge was inadequate [17]. Similar findings were reported in another study conducted in Australia where among 309 parents there was a low level of knowledge [18]. In our study, in the pre-intervention questionnaire, parents reported a lower level of confidence in knowledge of risks and benefits of radiation however this significantly improved in the post-intervention following the educational intervention and discussion using the mobile application. This was also observed in the previously mentioned study in Australia where the investigators reported that parents with higher level of education appeared to have not only higher knowledge of radiation risks but were more likely to accept radiation imaging as ‘safe’ and ‘beneficial’. A study in Malaysia among patients reported that insufficient knowledge was associated with higher level of disapproval of the use of dental imaging among children [13]. In our study in the post-intervention when parents were asked if they still had concerns and if they comfortable in allowing their children to undergo imaging procedures, the majority reported that they did not have concerns and that they were very comfortable.

The risk-benefit dialogue is an important component of patient care in the current practice of dentistry and can aid in lowering the level of fear anxiety towards radiation [3,19]. This dialogue should be designed based on individual patient needs. The providers should also keep in mind that each patient and family differ in terms of their social and cultural background, medical and dental history, and access to care, especially given the growing diversity of the demographics in the US [20]. The risk communication strategy should be developed keeping in mind the prominent role of the parents in clinical decision making of dental treatment for their children. Dental practitioners should be aware that parents’ risk perception is often influenced by social factors, personal belief systems, previous health experiences, socio-economic factors and level of education [20]. Therefore, when communicating health information it is vital that dental practitioners take these factors into account and communicate information to the parents and children in a way that is easy for them to comprehend. In our study as we did not collect information on level of education and socio-economic factors. We collected information on insurance type which can be a proxy for economic level however the majority of the participants in our study since the majority reported Medicaid as their insurance we were unable to evaluate differences by economic level of the participants. The demographic characteristics observed in our study are however reflective of the patient population at the Boston University’s Goldman School of Dental Medicine.

Our educational intervention used a brief two-sided printed informational handout and a mobile application. The informational handout included content in simple easy to understand 8th grade level of English language as is the standard when preparing consent forms in English. The mobile application MIR, which was used in our study intervention was also simple user-friendly application. The preference for material used in health communication was distributed almost equally with slightly higher preference for the printed handout. This clearly points to the need to have various types of parental educational aids available in the dental clinic as individuals tend to have diverse learning styles and preferences. A recent study collected data on patient perspectives on how physicians should communicate information on radiation risks to patients and the results suggest that there was equal preference for both oral and written information [19]. Previous studies that used multi-media educational materials for dental procedures have reported successful improvement in knowledge [21,22]. Another study reported that text-messaging was more effective than printed pamphlets when educating mothers. These methods of communicating health information should also be considered for future long-term studies.

Graphic display and visually appealing text play an important role in enhancing health communication and improving knowledge [1]. Our educational handout with information on radiation risks and benefits was colorful with visual images and tables with clear breakdown of details on radiation dosages. As a result, the parents in our study may have preferred the printed handout a little more than the mobile application for the ease of information description and availability of the handout on hand. However, almost half the population preferred the mobile application MIR which may have been for those who prefer the portability and availability of information in their personal devices.

Limitations of our study include the short follow-up time following the intervention as the post-intervention questionnaire was handed out to the parents immediately after the intervention. Parents’ knowledge of risks and benefits may be higher as a result of this short follow-up time. Future studies should consider a longer follow-up period to evaluate long term retention of knowledge. Also, in our study while we described the availability of the mobile application MIR, there is no information about whether parents who preferred the use of the app downloaded the app and whether they continued to use it. Again, a study with longer follow-up period will be able to determine the frequency of use and the long-term benefits of the mobile application.

According to the policy statement published by the American Academy of Pediatrics (AAP), in the field of medical practice, key elements in improving physician-parent-child communications are  (adapted from Levetown MaCob 2008 AAP policy statement) [24]:

  • Informativeness: Quantity and quality of health information provided by physicians.
  • Interpersonal sensitivity: Behavior of the physician that reflects his or her attention to or interest in parents’ and child’ feelings or concerns.
  • Partnership building: Extent to which the physician opens a dialogue that allows the parents or children to share their perspectives and suggestions.

These concepts can be applied in the field of dentistry as well to improve dentist-parent-child communications which in turn will improve the overall treatment and management thus resulting in improved oral and systemic health of the child. In our study we demonstrated that even a simple brief educational intervention during a child’s dental care visit can significantly improve the level of comfort and confidence among parents and caregivers. Future research can utilize our study model to design larger studies with longer follow-up and more detailed information on patient and parent background. This can lead to better understanding on parental and patient preferences and perspectives that will in turn help practitioners to design more effective health communication strategies.

Acknowledgement

The authors would like to acknowledge and thank the parents who participated in this study.

References

  1. Dauer L, Thornton R, Hay J, Balter R, et al. (2011) Fears, feelings, and facts: Interactively communicating benefits and risks of medical radiation with patients. American Journal of Roentgenology 196: 756–61.
  2. Thornton R, Dauer L, Shuk E, Bylund C, et al. (2015) Patient perspectives and preferences for communication of medical imaging risks in a cancer care setting. Radiology 275: 545–52.
  3. WHO, World Health Organization (2015) Communicating radiation risks in paediatric imaging: Information to support healthcare discussions about benefit and risk. Geneva 2016.
  4. Madan K, Baliga S, Thosar N, Rathi N (2015) Recent advances in dental radiography for pediatric patients. Journal of Medicine, Radiology, Pathology & Surgery 1: 21–5.
  5. Linton O, Mettler Jr. F (2003) National council on radiation protection and measurements. In National conference on dose reduction in CT, with an emphasis on pediatric patients. American Journal of Roentgenology 181: 321–9.
  6. White S, Scarfe W, Schulze R, Lurie A, et al. (2014) The Image Gently in Dentistry Campaign: promotion of responsible use of maxillofacial radiology in dentistry for children. Journal of Oral Surgery, Oral Medicine, Oral Pathology and Oral Radiology 118: 257–61.
  7. ADA, American Dental Association: Image Gently Alliance. [Internet]. 2007 [cited August 26, 2019]. Available from: https://www.imagegently.org/About-Us/The-Alliance.
  8. Aanenson J, Till J, Grogan H (2018) Understanding and communicating radiation dose and risk from cone beam computed tomography in dentistry. The Journal of Prosthetic Dentistry 120: 353–60.
  9. Brody A, Frush D, Huda W, Brent R (2007) Radiation risk to children from computed tomography. Pediatrics 120: 677–82.
  10. Chiri R, Awan S, Archibald S, Abbott P (2013) Parental knowledge and attitudes towards dental radiography for children. Australian Dental Journal 58: 163–9.
  11. Lee C, Haims A, Monico E, Brink J, Forman H (2004) Assessment of patient, physician, and radiologist awareness of radiation dose and possible risks. Radiology 231: 393–8.
  12. Ludwig R, Turner L (2002) Effective patient education in medical imaging: public perceptions of radiation exposure. Journal of Allied Health 31: 159–64.
  13. Purmal K, Alam M, Nambiar P (2013) Patients’ perception on dental radiographs. International Medical Journal 20: 235–8.
  14. Friedberg W, Copeland K, Duke F, O’Brien III K, Darden Jr. E (2000) Radiation exposure during air travel: guidance provided by the Federal Aviation Administration for air carrier crews. Health Physics 79: 591–5.
  15. Hwang H. Knowledge, attitude and perception on radiation imaging among children’s caregivers in pediatric dental clinic.: Boston University; 2017.
  16. Zavras J, Hwang H, Murray G, Zletni A, Shanmugham J (2018) Educational intervention to increase parental knowledge and acceptance of pediatric imaging. Journal of Pediatrics and Neonatal Care 8: 1–7.
  17. Aravind B, Joy E, Kiran M, Shrubin J, et al. Attitude and awareness of general dental practitioners toward radiation hazards and safety. Journal of Pharmacy and Bioallied Sciences. 2016;8(1):553–8.
  18. Chiri R, Awan S, Archibald S, Abbott P (2013) Parental knowledge and attitudes towards dental radiography for children. Australian Dental Journal 58: 163–9.
  19. Lumbreras B, Vilar J, Gonzalez-Alvarez I, Guilabert M, et al. (2017) Avoiding fears and promoting shared decision-making: How should physicians inform patients about radiation exposure from imaging tests? PLoS One 12: 1–14.
  20. Garcia R, Cadoret C, Henshaw M (2008) Multicultural issues in oral health. Dental Clinics of North America 52.
  21. Pei D, Liang B, Du W, Wang P, et al. (2017) Multimedia patient education to assist oral impression taking during dental treatment: A pilot study. International Journal of Medical Informatics 102: 150–5.
  22. Kazancioglu H-O, Dahhan A-S, Acar A-H (2017) How could multimedia information about dental implant surgery effects patients’ anxiety level? Medicina Oral, Patologia Oral y Cirugia Bucal 22: 102–7.
  23. Sharma R, Hebbal M, Ankola A, Murugabupathy V (2011) Mobile phone text messaging (SMS) for providing oral health education to mothers of preschool children in Belgaum city. Journal of Telemedicine and Telecare 17: 432–6.
  24. Levetown MaCoB (2008) Communicating with children and families: From everyday interactions to skill in conveying distressing information. American Association of Pediatrics 2008.

Maternal nutrition, social correlates and obstetric outcomes in northern Mymensingh, Bangladesh

Abstract

National indices of maternal health have improved in Bangladesh, but no data is available from rural Mymensingh where two non-government aid agencies have been working for years. Surveys were held to inform their planning.

Methods: In November 2018, aided by a research team from Western Sydney University, Australia, anthropometric, mortality and socioeconomic data was compiled from 25 sites around Haluaghat and Dhobaura, and compared with national figures.

Results: Of 1982 mothers surveyed: 15.5% were ‘stunted’(<145 cm) vs 15.7% in Sylhet, and 13.3% in Dhaka, correlating with poverty, reduced education, and stunting of offspring. 13% were underweight (BMI <18.5 kg/m2) vs 29.8% in Sylhet and 18.2% in Dhaka. Conversely, overweight was common. Of stunted mothers 14.4% were ‘at risk’, 26.1% overweight and 4.2% obese. 29.7% consumed betel nut. Stillbirth, Perinatal, Neonatal and Child Mortality rates were very high: 89.8, 108.8, 27.45, and 61.3 respectively. 63.5% of births occurred at home with untrained assistance. 33.2% of mothers were married < 16 years, and suffered higher Neonatal and Child Mortality Rates.

Conclusion: Rates of undernutrition and child mortality are very high. The dyad of stunting and obesity portends the metabolic syndrome.

Key words

Child Mortality Rates, Dyad of Stunting and Obesity, Home Births, Maternal Health, Stunting, Underage Marriage, Underweigth

Introduction

Although the maternal mortality rate in Bangladesh declined significantly from 322 per 100,000 live births in 1998–2001 to 194 in 2007–2010, it stalled at that level in 2016, despite an increase in deliveries attended by medically trained personnel and an increase in a continuum of care from before to after the birth. The reasons for this stalling are not clear, but the Bangladesh Maternal Morbidity Survey (BMMS) regrets ‘the quality of health care is generally poor in Bangladesh’ and ‘most facilities…are not fully ready to provide quality maternity care [1].

In a similar period, however, maternal nutrition is reported to have improved. The national rate of Body Mass Indices (BMI) <18.5 fell from 34 to 19% from 2004 to 2014, though 31% of ‘ever married women age 15–19’ were ‘undernourished’ with BMI <18.5 in 2014 [2].

Bangladesh Demographic and Health Surveys (BDHS) report periodically on Maternal and Newborn Health, and on Nutrition of Children and Women. They present data from representative sites throughout Bangladesh, but these have not included the rural region in the north of Mymensingh District where, for many years, two non-government organisations, Symbiosis International and the Mennonite Central Committee, have sought to improve women’s and children’s health. To review progress and assist planning, a survey was undertaken in November 2018 of indices of maternal and child health in 25 sites in an around the region of activity of the NGOs. The aim was to capture a ‘moment in time’ of major anthropometric data, clinical and historical status and social correlates of health, and to compare the findings with national data as found in BDHS. This report will concentrate on aspects of maternal health. Other reports will concentrate on children. The surveyed sites are on flat agricultural land along the border with India, with two commercial and administrative centres: Haluaghat and Dhobaura. Local roads are of poor quality, particularly in the rainy season, and transportation of women to the main birthing centre in Joyramkura Hospital may be delayed. Rice is the staple crop and most villagers are involved in agricultural labour. Ethnicity is predominantly Bengladeshi with a Garo minority.

Methods

The surveys were organised by two non-government aid organisations, Symbiosis International and Mennonite Central Committee, with assistance of a research group of senior medical students and supervisors associated with the School of Paediatrics, Western Sydney University, Australia. In preliminary visits to the villages, the aims and the process of the surveys were explained and participation invited. Surveyors were divided into two teams, each visiting one village a day where a line of ‘booths’ were established, first, to elicit historical data from the mother on her age, age at marriage, numbers of still and live births, numbers of childhood deaths, ages of children, participation in programmes of vaccination and worming, and social correlates including mothers’ education and family income, sanitation, and water supply. Then, heights and weights of the mothers and lightly dressed children were measured, and children were examined physically. Information regarding maternal deaths was not sought. Data was recorded on paper and later transcribed into a computer for analysis.

All participants did so voluntarily. Information was encoded by numbers but a master list was kept, in confidence, in case health reasons mandated subsequent contact. Maternal stunting was defined as height <145 cm. Maternal ‘underweight’ was defined as Body Mass Index (BMI) <18.5 Kg/m2. A BMI from 18.6 and 22.9 Kg/m2 was defined as normal: from 23–24.9 as ‘at risk for overweight’; from 25–29.9 Kg/m2 as ‘overweight’ and >30 Kg/m2 as obese [3]. Maternal anthropometry was compared with data contained in Bangladesh Maternal Morbidity Surveys (BMMS) and BDHS reports. Family income was graded into four categories: Band 1 had a monthly income of <5000 Taka; Band 2 between 5001–10,000; Band 3 between 10,001–15000 and Band 4 had>15,000. (US $1 = 84 Taka) Sanitation was categorised into open and closed latrines with the former discharging untreated effluent upon surrounding ground or water.

The Stillbirth Rate (SBR) was defined as the rate of deaths in utero after 28 weeks of gestation: The Perinatal Mortality Rate (PMR) as the number of Stillbirths plus deaths in the first week of life per 1000 total births; The Neonatal Mortality Rate (NMR) as the number of deaths in the first 28 days of life per 1,000 live births:; the Infant Mortality Rate (IMR) as the number of deaths in the first year of life per 1,000 live births; the Child Mortality Rate (CMR) as the number of deaths < 5 years of age per 1000 live births. Ethnicity was denoted by the mother: Bangladeshi or Garo.

Statistics

Data was cleansed and imported into a relational database enabling cross correlating queries to be executed. WHO anthropometric factors of Height vs Age (HAZ), Weight vs Age (WAZ), Weight vs Height (WHZ) were calculated using the WHO published mathematical algorithms.[1]

Outliers were identified according to WHO statements of limits and discarded as per WHO stated process. Data was converted to Z Scores and expressed as the standard deviation (SD) from the mean of the WHO reference standard population for both male and female.[2]

Continuous unpaired data was analysed using zTest,. Count data was analysed using Chi-Squared Best Fit assuming equal proportions and trend data analysed using Chi-Squared Tend Analysis. Correlations were performed using Pearson’s correlation. In all tests sample size was > 30 and the null hypothesis rejected for results > 95% confidence, resultant P-Values are reported. We perform all comparisons against the combined male-female scores, unless otherwise stated. We used Minitab Express for all statistical analysis.

Ethics

The surveys were approved by governance of both Symbiosis International and Mennonite Central Committees as quality assurance of current programmes and preparation for future activity. Representatives of those NGOs visited the sites in advance, explained the aims and the process, and invited participation. Mothers and their children attended voluntarily. Data was de-identified for analysis but a list was kept in confidence in case of need to contact the parents eg with regard to medical concerns.

Results

In the 25 sites, 1982 mothers were interviewed and measured, and 2987 children were measured and examined.

  1. Maternal Anthropometry

    Overall, 15.4% of mothers in northern Mymensingh were ‘stunted’, with height <145 cm, similar to the rate of 15.7% in rural Sylhet, the highest in the country, and greater than the 13.3% in Dhaka [2]. The overall rate in northern Mymensingh has stalled near the national rate of 16% reported in BDHS 2004, but the rate is rising within families. Of the 15.4% of stunted mothers, the rate in their children aged from 5–14 years increased to 25.6% and in those <5 years to 36.2%.

    Maternal stunting was greatest in the lowest Income Band (18.0%) from which it remained around 13% through higher Bands. These rates are worse than reported nationally in both the lowest (16%) and highest Income Bands (9%) [2]. Maternal stunting was associated with adverse outcome in offspring. First, it was strongly associated with stunting in the offspring: 47.9% compared to 33.2% from non-stunted mothers (PValue 0.0007). This effect was significant for female children (PValue 0.0013), but weaker for male children (PValue 0.1053). Second, the <5 CMR was increased in stunted mothers (74.0 vs 57.1 per 1,000, (PValue 0.0183). The CMR was higher in stunted mothers who were also overweight and obese (130.4 vs 64.4) compared with stunted mothers who were not (PValue 0.00394).

    As well as stunting, maternal underweight was common (12.7%), though less than in rural Sylhet (29.8%) and Dhaka. (18.2%) [2]. The rate decreased with rising income. Contemporaneous with maternal underweight in northern Mymensingh is a high rate of overweight: 23.7% of women had BMI> 25 kg/m2 and 5.6% a BMI >30 kg/m2, similar to those of Chittagong (27 and 5.6%), reported as the highest in the nation [2].

    Overall, the rates of maternal underweight decreased and the rates of overweight increased through rising Income Bands. See Figure 1. In all 25 sites, there were both underweight and overweight mothers. In 16 villages, more than 20% of mothers were overweight: in six, more than 40% were overweight.

    AWHC-19-138- John S Whitehall_ Australia_f1

    Figure 1. Bar graph revealing decreasing rates of underweight and increasing rates of overweight through increasing Income Bands.

    Many stunted mothers were overweight: though 12.9% were also underweight and 42.4% were appropriately weighted, 14.4% are ‘at risk’ of overweight, 26.1% were overweight and 4.2% obese Figure 2.

    AWHC-19-138- John S Whitehall_ Australia_f2

    Figure 2. Bar graph revealing high rate of association between stunting and overweight.

  2. Mothers’ fertility and income: The numbers of live births fell progressively through the income bands, from a mean of 2.63 per mother in the lowest to 1.97 in the highest.
  3. Child Mortality rates: The mothers reported 435 still and 4408 live births, of whom 275 children had died: 93 in the first week of life, 122 within the first month, giving an SBR of 89.8, a PMR of 109.0, an NMR of 27.7, and an <5 CMR of 62.4. The SBR in northern Mymensingh is almost four times higher than the national rate (89.8 vs 20.4) [4]4, and over twice that of the hitherto highest, Sylhet, (89.8 vs 36.3) [5]. PMR is over twice the national rate (109.0 vs 44), while NMR (27.7 vs 28) is comparable, and CMR is much higher (62.4 vs 46) [2].
  4. Site of birth: 63.2% of surveyed births occurred at home, revealing no improvement from the national rate of 63% reported in 2014 [2]. Overall, 56.3% occurred under the care of a family member or traditional birth attendant. Attendance by a ‘professional’ increased through the income bands from 37% in the lowest to 72% in the highest.

Breast Feeding

Overall, 96.9% of mothers initiated breastfeeding immediately after birth. Of those who did not, 47.8% were clustered in 3 of the poorest sites. The offspring of the mothers who did not breast feed immediately after birth were significantly more stunted (p-value 0.0304). Across all incomes, 14.1% of mothers breast fed for < 6 months, or not at all. Overall, 81% of mothers in the higher income Bands ceased feeding in the sixth or seventh month, compared with 11% in the lowest income Band. Most notably, 51% of mothers in Band 1 continued to feed beyond 12 months, with a large proportion (32%) continuing beyond 2 years. This conflicts sharply with the length of breastfeeding in all higher Bands in which only 6% continued beyond 1 year, and 3% beyond 2 years. In all income bands, the rate of breastfeeding was higher in Garo mothers (p-value 0.0001). Children in Income Band 1 who were breast fed for longer than 6 months were more stunted (PValue 0.0048) than those who were not. This association between prolonged breast feeding and stunting was not, however, observed in higher Income Bands.

Latrines

44.6% of families used an ‘open latrine’ compared with the national rate of 36%2. Their use was strongly associated with the lowest Income Band, and thus correlated with stunting of both mothers and children. Controlling for income within that Band, the rate of childhood stunting was much greater in families with open rather than sanitary latrines (40.8 vs 27%. P Value 0.0227). The effect was not seen in Band 2 and the number of open latrines sampled in Band 3 and 4 was too low for meaningful analysis.

Underage marriage of females

The mean reported age of marriage was 17.92 (SDev 3.48, n 1816). Overall, 42.5% were married <18 years, with 33.2% at or below 16 years, of whom 38.0% were Bangladeshi compared with 9.5% Garo. Bangladeshi youths are 3.98 times more likely to be married < 16 years than Garos. The youngest bride was 7. The percentage of child brides differed markedly by village, from 79% to 23%, with prevalence inversely correlating with household income (Pearson’s correlation = -0.17017, PValue <0.0001). Though BDHS 2014 reported 71% of girls were married <18 years, it claimed a substantial, and accelerating decrease in underage marriage in recent years. Our overall rate of 42.5%, together with a mean age of 17.92 and median of 18 years, might reflect that decline, but our data is skewed to a younger age, with an exceptional, outlying rate at exactly 18 years which may be misleading. See Figure 3.

AWHC-19-138- John S Whitehall_ Australia_f3

Figure 3. Histogram of ages of marriage, revealing a curve skewed to the left and a marked outlier at 18 years.

Overall, the proportion of younger age marriage was higher in families with the lowest income but, even within the income Bands, underage marriage was associated with specific disadvantage. Girls married at or before 16 years were 4.42 times less likely to obtain a basic education defined as Year 10 school certificate (10.33% vs 43.65% of their cohort, Chi Squared 202.46, PValue < 0.0001). They are 5.12 times less likely to obtain a Year 12 Higher School Certificate (2.2% vs 11.2% of their cohort, Chi Squared 42.282, PValue < 0.0001), and 16.3 times less likely to obtain a bachelor’s degree (0.7% vs 10.9% of their cohort, (Chi Squared 60.279, PValue <0.0001). Expressed differently, when controlled for income, for every 8.15 brides in the poorest income Band who obtains at least a basic school certificate, only 1 will have been married at or before 16 years.

Girls married at or under 16 years experienced higher rates of reproductive adversity: CMR was 1.4 times (78.2 vs 54.8, PValue 0.0008), and NMR 1.7 times higher (23.7 vs 13.7, PValue 0.0002) than those with older mothers. Offspring of under-aged mothers in income Band 1 were more frequently stunted (44.8% PValue 0.0204) than children of older brides in the same Band (34.9%) (PValue 0.0204). This effect was not seen in higher Bands.

Betel nut

28.6% of mothers declared they chewed betel nut during pregnancy. Consumption was more common in the lowest income group (37.7%), falling progressively to 1% in the highest.

Discussion

Compared to national data published by BDHS many aspects of maternal health have stalled in rural northern Mymensingh District. Our survey did not examine rates of maternal mortality but maternal stunting, underweight, overweight, home births, reproductive adversity, and underage marriage rival the highest in the country. The burden of maternal adversity is thus a major challenge in the region. The rate of maternal stunting in northern Mymensingh (mean of 15.4%) rivals that reported from Sylhet (15.7%), the highest recorded in BDHS 2014. Maternal stunting is a recognised risk factor for foetal growth restriction and adverse perinatal outcome [6] and for increased morbidity, mortality, underweight and stunting in offspring [7]. Foetal growth restriction is also known to predispose to the metabolic syndrome in adulthood, particularly when food intake is enhanced. Childhood stunting increases mortality rates in children and reduces their human capital and, thus, their ultimate contribution to national development. Maternal undernutrition confirmed by BMI <18.5 has similar adverse effects as stunting6 and was common in surveyed areas, but not as common as reported from rural Sylhet (13 vs 29.8%), though stunting rates are similar [2].

Our contemporaneous rates of overweight are remarkably high: with 14.4% of mothers at risk, 26.1% overweight and 4.2% obese, nearly half the female population is affected. Though ‘at risk’ pertains to BMI as low as 23 kg/m2, Asian populations have been reported susceptible to the development of cardiovascular disease and diabetes from that level, perhaps because of a higher percentage of body fat [3]. This propensity to being overweight may explain the lower rates of underweight between Mymensingh and Sylhet, despite similar rates of stunting. Thus, the higher rates of BMI (dependent on weight vs height) in Mymensingh confirm the unreliability of BMI as an index of healthy nutrition, especially in Asian populations [3]. Being overweight is associated with obstetric adversity [8] but the dyad of stunting and obesity compounds problems. Described as ‘The new obstetrical dilemma’ [9], the risk of cephalo-pelvic disproportion is increased when a small pelvis is presented with a macrosomic baby in a stunted but obese mother. Also described as a ‘double burden’ of malnutrition, the dyad is being recognised with increasing frequency in many developing countries, but causes remain debated [10–12]. Perhaps it is related to increasing wealth and, therefore, family consumption of high-density caloric foods which fatten the stunted mother but do not promote linear growth in the offspring. ‘Food consumption’ by itself, however, was not found to account for higher obesity in a poor region of Brazil [13]: reduction in urbanised maternal activity was considered contributory. Given the overlap of the high prevalence of both stunting and obesity, its correlation has even been dismissed as a statistical artefact, not a distinct entity [14].

Whatever the association, given the predisposition of stunting with overweight to the metabolic syndrome according to the Barker Hypothesis, increasing problems of cardiovascular disease and diabetes may be expected in northern Mymensingh. At present, however, only 10 cases of gestational diabetes and 15 cases of hypertension were associated with the 2532 births in 2018 in Joyramkura Hospital [15]. Doubtless, in-utero growth restriction contributed to the high rate of stunting but birth weights were unknown to most mothers in our survey. The 9% rate of babies born <2,500 gm in the private Joyramkura Hospital is much less than the national rate of 20% [16], and may reflect difficulty in attendance by the poorest, undernourished and stunted mothers.

Perinatal death rates appear to result from the lethal combination of vulnerable mothers undergoing home births with untrained attendants. The high rate of children living with cerebral palsy (11.8 per 1000 live births) found in the 25 sites (and reported elsewhere) [17] would confirm problems in labour and neonatal care. The high CMR probably reflects their later deaths. Childhood stunting was associated with prolonged breast feeding, especially in low income households, and appears associated with failure of diversification of diet from six months of age (personal communication). Further research is being undertaken but breast milk and unpolished rice appear fundamental. That the prevalence of stunting increased from mother to older and then younger child is hard to explain. There have been no financial or natural disasters in the region that could account for such a dramatic increase in childhood under-nutrition. Perhaps the prevalence of maternal obesity is related to the phenomenon: mothers are now consuming new foods whose density of calories causes them to gain weight, but whose sparsity of protein prevents linear growth in offspring. Perhaps, this diet explains the increased CMR in children of stunted and overweight mothers, whose stillbirth rate is not significantly increased.

Open latrines predispose to recurrent intestinal infection and infestation, and malabsorptive enteropathy. Our survey revealed childhood stunting to be related to their use in the poorest income Band. That many mothers will have grown up in those sites suggests open latrines contribute to inter-generational stunting. Marriage before the age of 18 is often considered a breach of human rights [18]18 but is common in many developing countries [19] especially in Asia [20,21], Its risks are publicised: mental, sexual and reproductive problems, violence, reduced education and sustained poverty [22]; as well as a higher risk of stunting, developmental delay18 and mortality in offspring [23]. Socio-cultural and financial factors are reported causative [24]. Our study did not pursue such factors, but noted the frequency of under-age marriage in northern Mymensingh and its association with poverty, reduced education and reproductive adversity. We relied on maternal reporting for age of marriage and did not distinguish between betrothal and co-habitation.

The actual rate is likely to be much greater than suggested by our survey. The great outlier of professed marriage at 18 years may suggest an awareness of its illegality at a younger age. Alternatively, girls could be waiting to be married at 18, but if that were case, there would be fewer marriages at 16 and 17 years, contrary to the expected distribution as revealed in Figure 3. Education programmes fostering female empowerment are claimed effective in reducing child marriage [25]. Consumption of ‘betel nuts’ ranks fourth in the world’s consumption of addictive substances, after alcohol, tobacco and caffeine [26]. Our survey revealed 29% of mothers, particularly the poorest, consumed it in pregnancy. The seeds of the Areca palm (Arecha catechu) are consumed in a ‘quid’ with tobacco leaf, to which calcium hydroxide has been added to promote extraction of alkaloids. Effects on the autonomic system as well as endothelial cell growth in the placenta [27] may contribute to intra-uterine growth restriction [28–30].

Our study cross sectional study has limitations. The birth dates, weights and gestations were rarely recorded in home births. As warned in BDHS 2014, memory of ages and causes of death, even of stillbirths themselves, dims with passing years in retrospective, cross sectional studies. Lack of memory predisposes to the next problem in data collection: the ‘heaping up’ of estimates to intervals of significance eg to one year of age. Third, information was gathered by several translators without calibration of skill. Our study reveals the need for further investigation. ‘Verbal’ post-mortems should probe the high rates of death. Practical issues need to be examined: how can traditional birth attendants be educated to recognise complications in the mother and care for the baby. What transportation is possible for a mother in difficulty? What obstetric facilities are available? Why is a population of over half a million not seeking help in the regional centres of Dhobaura and Haluaghat? In 2018, together, those hospitals reported 809 deliveries, 788 live births, 21 stillbirths and 62 neonatal deaths, with no Caesarian sections [31].

Conclusion

Our broad brush, cross-sectional survey reveals, for the first time, major problems in mothers’ health in northern Mymensigh. It emphasises the need for education on nutrition, early recognition of obstetric complications, neonatal care, disposal of sewage, betel nut consumption, under-age marriage and empowerment of women. It emphasises the need for improved obstetric care: from more and better trained attendants, to adequate transportation, to the ability to intervene when things go wrong. The scarcity of Caesarian sections in the regional government hospitals substantiates the introductory lament of BMMS that ‘most facilities…are not fully ready to provide quality maternity care’.

References

  1. Ahsan KZ, Ahmed S, Angeles G, Benson A, Chakraborty N, et al. (2017) (National Institute of Population Research and Training, International Centre for Diarrhoeal Disease Research, Bangladesh, MEASURE Evaluation). Bangladesh maternal mortality and health care survey 2016. Preliminary report. Dhaka (BD): Government of the People’s Republic of Bangladesh; 106 p. Report No.: TR-17–218.
  2. Ministry of Health and Family Welfare (2016) National Institute of Population Research and Training; Mitra and Associates; ICF International, DHS Program. Bangladesh demographic and health survey 2014. Dhaka (BD): Ministry of Health and Family Welfare, National Institute of Population Research and Training, Pg No: 328.
  3. WHO Expert Consultation (2004) Appropriate body-mass index for Asian populations and its implications for policy and intervention strategies. Lancet 363: 157–163.
  4. Halim A, Aminu M, Dewez JE, Biswas A, et al. (2018) Stillbirth surveillance and review in rural districts in Bangladesh. BMC Pregnancy Childbirth 18: 224. [crossref]
  5. Baqui AH, Choi Y, Williams EK, Arifeen SE, Mannan I, et al. (2011) Levels, timing, and etiology of stillbirths in Sylhet district of Bangladesh. BMC Pregnancy Childbirth 11: 25. [crossref]
  6. Black RE, Victora CG, Walker SP, Bhutta ZA, Christian P, et al. (2013) Maternal and child undernutrition and overweight in low-income and middle-income countries. Lancet 382: 427–451.
  7. Ozaltin E, Hill K, Subramanian SV (2010) Association of maternal stature with offspring mortality, underweight, and stunting in low- to middle-income countries. JAMA 303: 1507–1516.
  8. Black M, Bhattacharya S (2013) Maternal Obesity and the Risk of Stillbirth. In: Mahmood T, Arulkumaran S, (eds). Obesity. Oxford: Elsevier; Pg No: 371–382.
  9. Wells JC (2017) The New “Obstetrical Dilemma”: Stunting, Obesity and the Risk of Obstructed Labour. Anat Rec (Hoboken) 300: 716–731.
  10. Jehn M, Brewis A (2009) Paradoxical malnutrition in mother-child pairs: untangling the phenomenon of over- and under-nutrition in underdeveloped economies. Econ Hum Biol 7: 28–35.
  11. Lee J, Houser RF, Must A, de Fulladolsa PP, Bermudez OI (2010) Disentangling nutritional factors and household characteristics related to child stunting and maternal overweight in Guatemala. Econ Hum Biol 8: 188–196. [crossref]
  12. Lee J, Houser RF, Must A, de Fulladolsa PP, Bermudez OI (2012) Socioeconomic disparities and the familial coexistence of child stunting and maternal overweight in Guatemala. Econ Hum Biol 10: 232–241. [crossref]
  13. Florêncio TT, Ferreira HS, Cavalcante JC, Luciano SM, Sawaya AL (2003) Food consumed does not account for the higher prevalence of obesity among stunted adults in a very-low-income population in the Northeast of Brazil (Maceió, Alagoas). Eur J Clin Nutr 57: 1437–1446. [crossref]
  14. Dieffenbach S, Stein AD (2012) Stunted child/overweight mother pairs represent a statistical artifact, not a distinct entity. J Nutr 142: 771–773.
  15. Samper-González J, Burgos N, Bottani S, Fontanella S, Lu P, et al. (2018) Reproducible evaluation of classification methods in Alzheimer’s disease: Framework and application to MRI and PET data. Neuroimage 183: 504–521. [crossref]
  16. Khan JR, Islam MM, Awan N, Muurlink O (2018) Analysis of low birth weight and its co-variants in Bangladesh based on a sub-sample from nationally representative survey. BMC Pediatr 18: 100.
  17. Authors (2019) Child mortality, nutrition and cerebral palsy: a cross sectional survey in northern Bangladesh. Nutrients 2019.
  18. Efevbera Y, Bhabha J, Farmer PE, Fink G (2017) Girl child marriage as a risk factor for early childhood development and stunting. Soc Sci Med 185: 91–101. [crossref]
  19. Nour NM (2009) Child marriage: a silent health and human rights issue. Rev Obstet Gynecol 2: 51–56. [crossref]
  20. Raj A (2010) When the mother is a child: the impact of child marriage on the health and human rights of girls. Arch Dis Child 95: 931–935. [crossref]
  21. UNICEF (2011) Working towards a common goal: ending child marriage [Internet]. [2019 Jun 6]. Available from: https://www.unicefusa.org/stories/working-towards-common-goal-ending-child-marriage/7086.
  22. Parsons J, Edmeades J, Kes A, Petroni S, Sexton M, et al. (2015) Economic impacts of child marriage: A review of the literature. The Review of Faith & International Affairs 13: 12–22.
  23. Adhikari R (2003) Early marriage and childbearing: risks and consequences. In: Bott S, Jejeebhoy S, Shah I, Puriet C, editors. Towards adulthood: Exploring the sexual and reproductive health of adolescents in South Asia; 2000; Mumbai, India. Geneva: World Health Organization Pg No: 62–66.
  24. Chowdhury FD (2014) The socio-cultural context of child marriage in a Bangladeshi village. Int J Soc Welf 13: 244–253.
  25. Lee-Rife S, Malhotra A, Warner A, Glinski AM (2012) What works to prevent child marriage: a review of the evidence. Stud Fam Plann 43: 287–303. [crossref]
  26. Gupta PC, Ray CS (2004) Epidemiology of betel quid usage. Ann Acad Med Singapore 33: 31–36. [crossref]
  27. Kuo FC, Wu DC, Yuan SS, Hsiao KM, Wang YY, et al. (2005) Effects of arecoline in relaxing human umbilical vessels and inhibiting endothelial cell growth. J Perinat Med 33: 399–405. [crossref]
  28. Garcia-Algar O, Vall O, Alameda F, Puig C, Pellegrini M, et al. (2005) Prenatal exposure to arecoline (areca nut alkaloid) and birth outcomes. Arch Dis Child Fetal Neonatal Ed 90: 276–277.
  29. Senn M, Baiwog F, Winmai J, Mueller I, Rogerson S, et al. (2009) Betel nut chewing during pregnancy, Madang province, Papua New Guinea. Drug Alcohol Depend 105: 126–131.
  30. Yang MS, Lee CH, Chang SJ, Chung TC, Tsai EM, et al. (2008) The effect of maternal betel quid exposure during pregnancy on adverse birth outcomes among aborigines in Taiwan. Drug Alcohol Depend 95:134–139.
  31. Government of the People’s Republic of Bangladesh, Ministry of Health and Family Welfare. Dhubaura Upazila Health Complex Health Bulletin 2015 [Internet]. [Mohakhali, Dhaka]: Government of the People’s Republic of Bangladesh, Ministry of Health and Family Welfare; 2015 [cited 2019 Jun 6].

[1] de Onis M, et al. (2012) Worldwide implementation of the WHO Child Growth Standards. Public Health Nutrition 15: 1603–1610.

[2] de Onis M (2006) Reliability of anthropometric measurements in the WHO Multicentre Growth Reference Study. Acta Pædiatrica 95: 8–46.

Making Smiles in the Community

The Riser School Based Dental Hygiene Clinic was started in March 2006 with a grant from the Kellogg Foundation in association with the Glenwood School Based Health Clinic and the University of Louisiana at Monroe Dental Hygiene Program on the campus of Riser Elementary and Middle Schools in West Monroe, Louisiana. Initial funding paid for the renovation of a school building and purchasing of equipment and supplies. There are three dental hygiene operatories and one x-ray operatory with a panorex machine located at the Riser School Based Dental clinic. Since 2009, the Living Well Foundation has awarded the necessary funds for project supplies and supervision to operate the Riser School Based Dental Clinic.  Riser school is located in an underserved area in the West Monroe community. Above 80% of the students at Riser School are eligible for Medicaid and the free or reduced lunch program.  The fall semester of 2019 will signify the beginning of University of Louisiana of Monroe’s 13th year on the Riser campus. Approximately 30 ULM Dental Hygiene students, supervised by a licensed dental hygienist, provide preventive oral health services the equivalent of 2 days a week throughout the academic year.  In the past thirteen years, there have been more that 3000 dental visits at the Riser SBDHC to children ages 4-16 years old.  Services provided are: x-rays, fluoride treatments, prophylaxis, sealants, nutritional counseling, and oral health education.  Each student leaves with a goody bag filled with a toothbrush, toothpaste, floss, and a prize they get to pick out of the treasure chest.  For some students this is the first toothbrush they have received for their own personal use. Many times they ask for extras for their siblings or parents.

A visit to our clinic is an opportunity to change patients’ views of dentistry.  So many have had bad experiences because of decay and disease in their mouths that the only time they go to the dentist is when something hurts. Provision of these services meets a significant need as access to routine healthcare is limited for most of these children who may not understand the importance of good oral hygiene.   In addition to seeing patients in the clinic, the ULM Dental Hygiene students go into the classrooms and conduct oral health education. Our goal is to provide a positive environment focusing on the patient individually, satisfying their oral health needs and showing them how to prevent dental diseases. Provision of these services at Riser school has several benefits: underserved children receive clinical and educational services; oral health awareness is created for the entire family; and dental hygiene students receive valuable clinical experience.

Image

Public Health Responding to the Epidemic of Alzheimers Disease

In the course of my career I’ve written frequently about the needs of caregivers of people with dementia and the urgency for public health to address their health and stress issues to avoid a human and health crisis in our culture. Recent publications by the Centers for Disease Control and the Alzheimers Association highlight that these issues are even more critical [1,2]. The stress of caring for a vulnerable person with dementia, or other person with special needs is a major risk factor for developing numerous physical and emotional chronic conditions.

Let’s be clear, we’re experiencing an aging population trend and commensurate increase in age related conditions. Chief among these are the various forms of dementia that constitute the epidemic I reference above. Alzheimers disease is the most common form of dementia, and we now recognize it often appears along with other forms of dementia and related conditions. During the course of these diseases one aspect we humans lose is independence, this leads to the necessity of persons to care for those with dementia for their health, well-being and everyday needs. Much has been written about the empathy of these people; sometimes referring to them as “angels”, what I want to focus on today is the very real risk to their health and mental health that comes with the role of caregiver. The nature of this role often leads to risky health behaviors such as sedentary lifestyle, poor nutrition, social isolation, and overuse and abuse of substances such as alcohol or prescription drugs. Additionally, economic strain frequently occurs with the all too common absenteeism or presenteeism at/from work, additional costs related to obtaining healthcare for the patient with dementia, and selfless acts of putting the patient before the caregiver’s own needs. These stresses can also complicate otherwise strained relationships and result in increasing risks to health and mental health.

This important public health issue cuts both ways. First the person with needs who requires care is at risk, and second the role of caregiver causes risk as well. Given that this phenomenon relates to millions of Americans alone, the impact around the globe is multiples of the recently published data. In the US health and well-being of informal caregivers is in many ways the backbone of the system of long-term care. This includes the healthcare system and what serves as the system of long-term care services and supports. The everyday needs of those requiring care become dependent on a population at high risk of chronic conditions both physical and emotional [3].

Recent CDC data highlight that over 40% of caregivers report having two or more chronic diseases; 14.5% of caregivers report experiencing 14 or more mentally unhealthy days in the last month; and 36.7% report getting insufficient sleep. Given that these are self-reported statistics, arguably the actual numbers may be higher [1]. As I have frequently stated in the past [4–7], those of us in caring professions have a moral and ethical responsibility to find ways to support these hardworking caregivers and policy-makers must act on their responsibility to create policies and systems that enable caregivers to perform their duties without compromising their own health and economic well-being.

We know that caregivers with knowledge, access to support systems, ability to engage socially, and resources to make healthy choices live healthier and more fulfilling lives. They are also more likely to have the energy to continue caring for their vulnerable loved one, manage other family responsibilities (i.e., sandwich generation members — those caring for children and an aging parent), and maintain their occupation, thus limiting collateral impacts across families and communities.

One key element to ensuring that a caregiver has the information and access to support is an actively engaged health care provider — either the caregiver’s health care provider or the provider for the person receiving care. It should be both, but either should take some responsibility as a preventive measure. Today some practical suggestions for consideration include:

  1. In clinical and human service encounters we have a professional responsibility to tune in to the well-being of people who are caregivers. This tuning in can and should happen both informally (“So how are you doing today?”) and formally (“Let’s check your vital signs while you are here.”). These vital signs should include assessing the caregiver’s sleep, nutrition, physical activity, work/life balance, use of alcohol, and access to support services, including respite.
  2. Assessing knowledge and coping skills to reduce caregiving burden on multiple fronts. In the case of progressive disease like dementia, for instance, we can assess whether there is a plan for how to manage the increasing physical demands of that role.
  3. Plain language resources on respite and other resources should be repetitively available (in healthcare offices, social service settings, religious communities).
  4. Tips for caregivers should be similarly available (how to communicate, coping with common challenges such as hearing loss and limited mobility. Tips on managing common costs and available discounts and supports (for phone, cable, trash removal, food delivery).
  5. Expand proven strategies such as the New York State program referenced below and Naturally Occurring Retirement Communities that can provide formal and informal supports – and the key service of having multiple sources of “checking in” to reduce the feeling of isolation [4].

These are just a few suggestions, the critical issue today is the need for action on this challenge, especially where other additional challenges are present. In previous articles there have been many calls for action on these questions [6], including a call for a national plan. Today my call is for a systemic approach to address the health of vulnerable members of society who require care and the integral informal caregivers who attempt to address these needs in every community across the country. In my former role, with support of advocates like the Alzheimers Association and key policymakers, New York State invested significantly in both Centers of Excellence to educate professionals and provide high quality clinical services across the state and various Caregiver Support Programs strategically located to be accessible statewide. This program was built because using data like that from CDC referenced below, we were able to show that early diagnosis, aggressive quality clinical care and an array of proven caregiver support activities in addition to being lifesaving to patients and caregivers could also be cost effective. I recognize this doesn’t solve all the issues raised here, but this huge step forward can provide lessons for nations, states and other jurisdictions. Evaluation data on the program prepared by NYSDOH with a team at the Albany School of Public Health led by Dr. Mary Gallant can be reached at: https://www.health.ny.gov/health_care/medicaid/redesign/mrt_8004.htm

A new set of materials and data I reference above from the Centers for Disease Control and Prevention related to Alzheimer’s disease, including background information as well as additional suggested action steps for a variety of audiences can be found here:

References

  1. https://www.cdc.gov/aging/caregiving/caregiver-brief.html
  2. Alzheimer’s Association (2019) Alzheimer’s Disease Facts and Figures. Alzheimers Dement 2019 15: 321–387.
  3. Hoffman D, Zucker H (2016) A Call to Preventive Action by Health Care Providers and Policy Makers to Support Caregivers. Prev Chronic Dis 13: 160233. [crossref]
  4. Masotti PJ, Fick R, Johnson-Masotti A, MacLeod S (2006) Healthy Naturally Occurring Retirement Communities: A Low-Cost Approach to Facilitating Healthy Aging.  Am J Public Health 96: 1164–1170. [crossref]
  5. Hoffman D (2014) Alzheimers Disease Legislation and Policy, Now and in the Future. Health Aff (Millwood) 3: 561–565. [crossref]
  6. Khachaturian AS, Hoffman DP, Frank L, Petersen R, Carson BR, et al. (2017) Zeroing out preventable disability: Daring to dream the impossible dream for dementia care: Recommendations for a national plan to advance dementia care and maximize functioning. Alzheimer’s Dement 13: 1077–1080. [crossref]
  7. Hoffman D (2015) Looking at The Future of Alzheimers Disease Policy. Health Affairs Health Policy Lab JULY 14, 2015.10.1377/hblog20150714.049333

Is there a Role for Complementary Medicine in the Management of Patients with Breast Cancer?

Editorial

Breast cancer is the most frequent cancer among women and one of the three most common cancers worldwide, along with lung and colon cancer [1]. The survival of patients with breast cancer has increased in recent years due to earlier diagnosis and also due to advances in the treatment of this common disease [2]. However, half of million patients die each year from breast cancer, highlighting the need for further improvements in the management of these patients [3]. Moreover, survivors of breast cancer often exhibit poor quality of life as a result of the complications of treatment [4].

In this context, complementary medicine might be a useful option is selected patients with breast cancer as an addition to the established treatment options. Complementary medicine includes 5 major categories of treatment: a) traditional medical practices, such as whole medical systems, b) mind-body interventions, c) biological substance–based practices, d) manipulative and body-based practices, and e) energy medicine [5]. Several preclinical studies showed that various herbs used in complementary medicine, including turmeric and black cumin, inhibit breast cancer cell proliferation and induce apoptosis [6, 7]. A number of traditional Chinese medications, including Xihuang, shikonin and bakuchiol, also showed anticancer potential in in vitro studies [8, 9]. However, there are no clinical studies that evaluated the safety and efficacy of these traditional herbs and medications in patients with breast cancer.

Complementary medicine might also have a role in the management of complications of breast cancer treatment. In a randomized, controlled study in 30 patients with breast cancer-related chronic lymphedema, warm acupuncture improved lymphedema, range of motion and quality of life more than placebo treatment and had no adverse effects [10]. In another uncontrolled, pilot study (n = 9), Saam acupuncture, a Korean variation of acupuncture, also improved lymphedema [11]. In a meta-analysis of 9 randomized controlled trials (n = 322), tai chi improved handgrip strength and elbow mobility in patients with breast cancer but had no effect on pain, physical, social or emotional well-being or on general health-related quality of life [12]. In another meta-analysis of 13 studies (n = 606), arts therapy, including music therapy interventions, various types of art therapy, and dance/movement therapies, improved anxiety but had no effect on depression or quality of life in patients with breast cancer [13]. Several studies also showed that yoga improves anxiety, depression, perceived stress, psychological distress, fatigue, functional, social and spiritual well-being as well as global health-related quality of life in this population [14, 15].

In conclusion, complementary medicine appears to be useful for the improvement of well-being in patients with breast cancer. In addition, preclinical data suggest that several traditional herbs might exert antiproliferative and proapoptotic effects on breast cancer cells. However, randomized clinical trials are needed to establish the safety and efficacy of these herbs.

References

  1. Ferlay J, Soerjomataram I, Dikshit R, et al. (2015) Cancer incidence and mortality worldwide: sources, methods and major patterns in GLOBOCAN 2012. Int J Cancer 36: 359–86.
  2. Malvezzi M, Carioli G, Bertuccio P, et al (2016) European cancer mortality predictions for the year 2016 with focus on leukemias. Ann Oncol 27: 725–31.
  3. Torre LA, Bray F, Siegel RL, Ferlay J, Lortet-Tieulent J, Jemal A (2012) Global cancer statistics, 2012. CA Cancer J Clin 65: 87–108.
  4. Edward KL, Chipman M, Giandinoto JA, Robinson K (2019) Quality of life and personal resilience in the first two years after breast cancer diagnosis: systematic integrative review. Br J Nurs 28: S4-S14.
  5. Saquib J, Madlensky L, Kealey S, et al (2011) Classification of CAM use and its correlates in patients with early-stage breast cancer. Integr Cancer Ther 10: 138–47.
  6. Sun XD, Liu XE, Huang DS (2012) Curcumin induces apoptosis of triple-negative breast cancer cells by inhibition of EGFR expression. Mol Med Rep 6: 1267–70.
  7. Sutton KM, Doucette CD, Hoskin DW (2012) NADPH quinone oxidoreductase 1 mediates breast cancer cell resistance to thymoquinone-induced apoptosis. Biochem Biophys Res Commun 426: 421–6.
  8. Zheng W, Han S, Jiang S, et al (2016) Multiple effects of Xihuang pill aqueous extract on the Hs578T triple-negative breast cancer cell line. Biomed Rep 5: 559–66.
  9. Li L, Chen X, Liu CC, Lee LS, Man C, Cheng SH (2016) Phytoestrogen bakuchiol exhibits in vitro and in vivo anti-breast cancer effects by inducing S phase arrest and apoptosis. Front Pharmacol 7: 128.
  10. Yao C, Xu Y, Chen L, et al (2016) Effects of warm acupuncture on breast cancer-related chronic lymphedema: a randomized controlled trial. Curr Oncol 23: 27–34.
  11. Jeong YJ, Kwon HJ, Park YS, Kwon OC, Shin IH, et al (2015) Treatment of lymphedema with Saam acupuncture in patients with breast cancer: a pilot study. Med Acupunct 27: 206–15.
  12. Pan Y, Yang K, Shi X, Liang H, Zhang F, Lv Q. Tai chi chuan exercise for patients with breast cancer: a systematic review and meta-analysis. Evid Based Complement Alternat Med 2015: 535237.
  13. Boehm K, Cramer H, Staroszynski T, Ostermann T (2014) Arts therapies for anxiety, depression, and quality of life in breast cancer patients: a systematic review and meta-analysis. Evid Based Complement Alternat Med 2014: 103297.
  14. Cramer H, Lange S, Klose P, Paul A, Dobos G. Can yoga improve fatigue in breast cancer patients? A systematic review. Acta Oncol 51: 559–60.
  15. Cramer H, Lange S, Klose P, Paul A, Dobos G (2012) Yoga for breast cancer patients and survivors: a systematic review and meta-analysis. BMC Cancer 12:412.

Impact on Bones and Joint during Pregnancy and Breastfeeding: A Short Note

Short Commentary

Bone is the name given to hard extremely dense connective tissue that forms the human skeleton. Individual bones may be classed as long, short, flat or irregular. Bones not only form the skeleton but also act as stores for mineral salts and play an important part in the formation of blood cells. Haematopoiesis is the process of production of blood cells and platelets which continues throughout life, replacing aged cells (which are removed from the circulation). In healthy adults, haematopoiesis is confined to the bone marrow, but in embryonic life and in early infancy, as well as in certain diseases, it may occur in other sites (extramedullary haematopoiesis). Joint is the point when two or more bones are connected. The opposing surfaces of bone are lined with cartilaginous fibrous or soft (synovial) tissue. The three main classes of joint are diarthrosis (freely movable), amphiarthrosis (slightly movable) and synarthrosis (unmovable). Between the causes that can damage the bones and joints are: (i) pregnancy; and (ii) breastfeeding. Here, our objective is: 1- summarized (presents) those causes and their effects based on publications that we consider relevant, for divulgation of the impact on bones and joints during pregnancy and breastfeeding, for physicians and other health personnel to bear in mind this when assisting mothers of babies and infants.

In [1] the authors have” identified 35 women who have developed osteoporosis during or shortly after pregnancy and in only six of them could a recognized underlying cause be suggested. These findings would suggest that idiopathic osteoporosis associated with pregnancy may be more common than the current literature suggests”.

In [2] the authors suggest “that calcium needed for fetal skeletal growth during pregnancy was gained from maternal trabecular and cortical sites and that calcium needed for infant growth during lactation was drawn mainly from the maternal trabecular skeleton in our patients. The effect of pregnancy and lactation on the maternal bone mass was spontaneously compensated after weaning”.

In [3], the authors, in their investigation, have “evaluated (1997–1999) a total of 193 Mexican women, in the first, second and third trimesters of pregnancy, to test the hypothesis that maternal bone lead burden is associated with increasing maternal whole blood and plasma lead levels over the course of pregnancy and that this association is modified by rates of maternal bone resorption.

The results confirm previous evidence that bone resorption increases during pregnancy, with consequential significant release of lead fromda bone, constituting an endogenous source of prenatal exposure”.

In [4], it is indicated -1- in pregnancy and bone health, that: (i) “pregnant women absorb calcium from food and supplements better than women who are not pregnant. This is especially true  during the last half of pregnancy, when the baby is growing quickly and had the greatest need for calcium”; (ii) “during pregnancy, women produce more estrogen, a hormone that protects bones; (iii) “any bone mass lost during pregnancy is typically restored within several months after the baby’s delivery (or several months after breastfeeding has stopped); -2- in breastfeeding and bone health, that: “studies have shown that women often lose 3 to 5 percent of their bone mass during breastfeeding, although they recover it rapidly after weaning. This bone loss may be caused by the growing baby’s increased need for calcium, which is drawn from the mother’s bones. Women also may lose bone mass during breastfeeding because they are producing less estrogen, which is the hormone that protects bones”.

In [5], we have, in our opinion, an excellent revision on “the influence of pregnancy and lactation on maternal bone health” where are considered several topics including each one of them a conclusion. Here, we indicate the title of some of these topics and respective conclusions: (i) – Bone metabolism during pregnancy and lactation – high calcium demand and estrogen deficiency stimulate bone metabolism during pregnancy and lactation; (ii) – Pregnancy, lactation and bone – because of a potent correlation between lactation and pregnancy, both are considered as a combined risk factor; (iii) –Parity and bone – several investigations showed log-term supportive effect of parity on bone. For example, it was observed less bone mineral density decrement in multiparous women compared with primiparous; (iv) – Lactation and bone – bone metabolism is higher in lactating mothers with longer period of breastfeeding than that of non-lactating mothers [6]; “it is hypothesized that after discontinuing breast feeding bone resorption returns to normal while bone formation continues [7]; (v) – Pregnancy, lactation and risk of fracture – “bone loss predisposes patients to bone fractures which may cause disabilities, and work loss and imposes high cost to the society [5].

In conclusion, we are in agreement with authors [5]:” it seems that pregnancy itself may lead to bone loss but if followed by lactation, it will have a protective effect on bone density while the duration of lactation and parity may modulate its effects. Further investigation on this topic by considering the study limitations, contributory factors and using new safe techniques such as quantative ultrasometry is highly recommended.”

Key words

Pregnancy; Breastfeeding; Gynecology; Obstetrics; Bones and Joint

References

  1. Dunne F, Walters B, Marshall T, Health DA (1993) Pregnancy associated osteoporosis. Clinical Endocrinology 1993: 487–490.
  2. More C, Bettembuk P, Bhattoa HP, Balogh A (2001) The effects of pregnancy and lactation on bone mineral density. Osteoporos Int 12: 732.
  3. Téllez-Rojo MM, Hernández-Avila M, Lamadric-Figueroa et al (2004) Impact of bone lead and bone resorption on plasma and whole blood lead levels during pregnancy. American Journal of Epidemiology 160: 668–678.
  4. Pregnancy, breastfeeding and bone health/NIH Osteoporosis and related bone diseases National Resource Center. WWW.bones.nih.gov
  5. Salari P,  Abdollahi M (2014) The influence of pregnancy and lactation on maternal bone health: a systematic review.  J Family Reprod Health 8: 135–148
  6. Holmberg-Marttila D, Leino A, Sievânen H (2003) Bone turnover markers during lactation postpartum amenorrhea and resumption of menses. Osteoporos Int 14: 103–109
  7. Sowers M, Eyre D, Hollis B, Randolph JF, Shapiro B Jannaush ML et al (1995) Biochemical markers of bone tumover in lacting and nonlacting potpartum women, J Clin Endocrinol Metab 80: 2210–6.

Relationship between Melatonergic and Thyroid Systems in Depression

Summary

Although melatonergic and thyroid system dysregulations are often observed in depression, it remains largely unknown whether these abnormalities are interrelated. Plasma melatonin concentrations were evaluated between 2100 h and 0800 h in 12 DSM-5 major depressed euthyroid inpatients; light (2,000 lux) was administered at midnight for one hour with a portable light device. On the following day, thyrotropin (TSH) responses to 0800 h and 2300 h protirelin (TRH) tests were measured.  Melatonin profiles exhibited a wide interindividual variability. Light induced a reduction in melatonin concentrations. Melatonin suppression (MEL-S) values (expressed as percentage of change between concentration at midnight and lowest concentration after light) were correlated with 2300 h TRH-TSH responses (∆TSH) and ∆∆TSH values (difference between 2300h-∆TSH and 0800h-∆TSH). Post-light rise in melatonin (MEL-PLR) values (expressed as percentage of change between lowest concentration after light and concentration at 0400 h) were correlated with 2300 h-∆TSH and ∆∆TSH values. Moreover, patients with reduced ∆∆TSH values (< 2.5 mU/L) showed a trend toward lower MEL-S and MEL-PLR values than patients with normal thyroid function. Together, our results suggest close functional relationships between melatonergic and thyroid systems in depression.

Keywords:

Depression, melatonin, light, Hypothalamic-Pituitary-Thyroid (HPT) axis, Thyrotropin-Releasing Hormone (TRH) test, thyrotropin (TSH).

Introduction

Depression is often associated with disrupted circadian rhythms. The neurohormone melatonin, synthesized by methylation of serotonin in the pineal gland, provides a robust circadian message to the organism (for review see Pevet, 2014) [1]. Given an inhibitory effect of light, melatonin secretion increases after dusk and terminates by dawn. It has been previously reported in healthy humans that melatonin secretion is suppressed at night with light of 500 lux or greater [2,3]. In depression it was found, but not unanimously, abnormalities of circadian rhythm of melatonin with advanced phases and/or decrease in nocturnal amplitude [4–6], and increased, decreased, or normal sensitivity to light [2].

On the other hand, while the vast majority of depressed patients have thyroid function tests within the euthyroid range, most inpatients exhibit a chronobiological Hypothalamic-Pituitary-Thyroid (HPT) axis dysregulation. Indeed, it has been consistently found that circadian thyrotropin (TSH) secretion is altered in depression (i.e., failure of the normal nocturnal surge of TSH, and lower and less variable 24-hour TSH levels compared to controls [5]) associated with blunted TSH response to protirelin (TRH) and reduced difference in TSH response between 2300 h and 0800 h TRH tests (∆∆TSH) (for review see Duval and Mokrani, 2018) [7]. In depression, the ∆∆TSH test represents a very sensitive chronobiological index since it is reduced in about 70% of inpatients [7].

Preclinical studies have demonstrated complex interactions between melatonergic and HPT systems. Different experimental models suggest inhibitory effects of melatonin on thyroid secretion [8,9]. In humans, it has been hypothesized that melatonin could act on the HPT axis by a “feed-sideward” effect that diminishes or increases responses when stimuli are respectively too high or too low [10]. To date, very few studies have focused on the links between melatonergic and HPT systems in depressed patients. Souêtre et al. [5] reported a positive correlation between amplitudes of melatonin and TSH circadian rhythms. Kjellmann et al. [11] found no significant correlation between nocturnal melatonin and morning ∆TSH levels.

The main goal of our exploratory pilot study was to investigate the possible pineal-thyroid functional relationship in euthyroid depressed inpatients, by examining in the same subjects the melatonin response to light administered at midnight, and the TSH response to TRH challenge at 0800 and 2300 h, performed on the following day.

Methods and Material

Subjects

Twelve inpatients (5 male and 7 female; aged 38 to 58 years; mean age ± SD, 50.6 ± 6.2 years) meeting DSM-5 criteria for major depressive disorder participated in this study. They were recruited from the inpatient units of the Pole 8/9, Psychiatric Hospital of Rouffach (France). None had a history of recent suicidal behavior (in 5 patients the last suicide attempt occurred > 1 year prior to evaluation). They were free of all drugs for a minimum of 1 week; this washout was supervised in hospital. Patients were evaluated by means of at least two unstructured clinical interviews conducted by an experienced research psychiatrist (F.G.L., or V.D.) and a structured interview (Schedule for Affective Disorders and Schizophrenia—Lifetime Version)—conducted by a separate psychiatrist (A.E). The final diagnoses were made by consensus of two psychiatrists blind to endocrine results. Severity of depression was measured with the 17-item Hamilton Rating Scale for Depression (HAM-D); inclusion in the study required a baseline HAM-D of 18 or greater (mean ± SD, 23.5 ± 4.0).

The protocol was approved by the local ethical committee (Comité de Protection des Personnes Est IV, Hôpital Civil Strasbourg) and performed according to the Declaration of Helsinki. All participants gave their informed and written consent.  Routine blood tests and physical examination excluded subjects with medical illnesses. All patients had normal basal thyroid hormone values (TSH, free T4 [FT4] and free T3 [FT3]), and normal body mass index (18.5< BMI <24.9 kg/m2). Subjects with a history of thyroid or other endocrine diseases; alcoholism or drug abuse; previous treatment with lithium salts, carbamazepine, long-acting neuroleptics, fluvoxamine, monoamine oxidase inhibitors or electroconvulsive therapy within one year of testing; and women taking oral contraceptives were excluded. We also excluded from the study patients with ocular disease, including cataract, glaucoma, retinitis pigmentosa, diabetic retinopathy, macular degeneration, or Stargardt disease.

All subjects were on a caffeine-restricted diet for at least three days before testing and their environment was synchronized, with diurnal activity from 0800 h to 2300 h, and nocturnal rest (sleep).

Procedures and Measurements

Light was administered with Luminettes® (Lucimed Company, Villers-le-Bouillet, Belgium). This portable LED device precisely focuses the light rays onto the lower half of the retina no matter the incline angle of the eye. During the session, performed in a room lighted below 50 lux, subjects were sitting in their bed. Light (2000 lux) was administered at midnight for one hour using Luminettes®. Subjects could sleep after light administration, but only in a sitting position to eliminate the influence of posture on melatonin levels. The intensity of 2000 lux and the duration of light exposure (one hour) were chosen to obtain a significant degree of melatonin suppression [3]. An indwelling cannula was inserted at 2000 h into a forearm vein and kept open with a slow drip of heparinized saline (5,000 IU heparin/l). Blood was sampled for melatonin determination at 2100h, and then every 20 minutes between 2320 h and 0500 h, a last sample was taken at 0800 h.

On the following day, the first TRH stimulation test was carried out at 0800 h—blood was drawn for assay of TSH at -15, 0, 15, 30, 60 minutes after injection of 200 µg TRH intravenously (TRH Ferring®, Ferring Pharmaceuticals, Kiel, Germany)—and the second TRH test was performed at 2300 h, on the same day, using the same previously depicted procedure [12].  Given that high cortisol secretion could decrease melatonin production, a Dexamethasone Suppression Test (DST) was carried out at midnight with oral ingestion of 1 mg of dexamethasone (Dectancyl, Laboratoires Roussel, Paris, France) followed by the assay of plasma cortisol at 0800 h, 1600 h and 2300 h on the next day. After the tests, blood samples were immediately centrifuged at 3000 rpm and 4°C; plasma samples were then stored at -20°C until assay.

Hormonal concentrations were determined by Radioimmunoassay (RIA) techniques (melatonin) and immunometric techniques based on enhanced luminescence (TSH, cortisol). Average intra-assay and inter-assay coefficients of variation were respectively: melatonin: <7%-8/3%, sensitivity < 3 ng/L [3,4]; TSH: 3.4 % – 4.8 %, sensitivity < 0.01 mU/L (Access Hypersensitive hTSH Assay, Beckman Coulter, Inc., Fullerton, CA, USA); Cortisol: 5.1 – 6.8%, sensitivity < 11 nmol/L (Access Cortisol Assay, same supplier).

Results

Melatonin profiles exhibited a wide interindividual variability. Light induced a reduction in melatonin concentrations and lowest values were observed at 0113 h ± 30 minutes (mean ± SD). Melatonin suppression (MEL-S) to light was expressed as percentage of change between concentration at midnight and lowest concentration after light according to the formula: MEL-S = ([melatonin concentration at 2400 h (immediately prior to phototherapy; i.e., baseline) – minimum melatonin concentration after light]/melatonin concentration at 2400 h) × – 100; mean ± SD, 31.9 ± 23.5 %. Post-light rise in melatonin (MEL-PLR) was expressed as percentage of change between lowest concentration after light and melatonin value at 0400 h according to the formula: MEL-PRL = ([minimum melatonin concentration after light (i.e., baseline) – melatonin concentration at 0400 h]/ minimum melatonin concentration after light) × 100; mean ± SD, 102 ± 103 %. The calculation of the percentage of melatonin changes (during and after light exposure) eliminated the baseline effect, although the inter-subject variations remained very large.

MEL-S and MEL-PLR values were not significantly correlated (rs [Spearman] = 0.43, n = 12, p = 0.16). However, there was a positive relationship between MEL-S and MEL-PLR values and evening TSH responses to TRH (Figure 1)—expressed as the maximum increment above the baseline value after TRH injection (2300h-∆TSH), and the difference between 2300 h-∆TSH values and 0800 h-∆TSH (∆∆TSH). Correlations between MEL-S and MEL-PLR and 0800h-∆TSH values were not significant. In our population, MEL-S, MEL-PLR, and TSH (baseline, ∆TSH, and ∆∆TSH) values were unrelated to age, gender, severity of depression and post-DST cortisol values.

EDMJ 2019-120 - Fabrice Duval France_F1

Figure 1. Relationships between maximum increment in plasma TSH level above baseline (∆TSH) after TRH injection at 2300h, and difference between 2300 h-∆TSH and 0800 h-∆TSH values (∆∆TSH), and (A) melatonin suppression (MEL-S) to light, expressed as percentage of change between concentration at midnight and lowest concentration after light, and (B) post-light rise in melatonin (MEL-PLR), expressed as percentage of change between lowest concentration after light and melatonin value at 0400 h, in 12 depressed patients. rs: Spearman rank coefficient.

We further classified the patients on the basis of their ∆∆TSH test status, since reduced ∆∆TSH values reflect chronobiological HPT axis alterations (for review see Duval and Mokrani, 2018) [7]. The first group showed reduced ∆∆TSH values (i.e. less than 2.5 mU/L [Duval et al. 2015]) (n=5; 3 male and 2 female; mean age, 51.6 ± 3.1 years). The second group showed normal ∆∆TSH values (n=7; 2 male and 5 female; mean age, 49.9 ± 7.9 years). Statistical analysis employing generalized Friedman rank sum test for rough melatonin data (sampled between 2320 h and 0500 h) showed a significant time effect in patients with normal ∆∆ TSH values (p < 0.9 10–7), but not in patients with reduced ∆∆TSH values  (p = 0.11). MEL-S and MEL-PLR values tended to be lower in patients with reduced ∆∆TSH values compared to patients with normal HPT activity (Figure 2).

EDMJ 2019-120 - Fabrice Duval France_F2

Figure 2. Nocturnal melatonin profiles (A) and responses to light (B) in 12 depressed patients classified according to the presence (∆TSH < 2.5 mU/L, n=5) or absence (∆∆TSH ≥ 2.5 mU/L, n=7) of HPT dysregulation. Raw data are expressed as mean ± SEM. The histograms (±SEM) represent the mean melatonin suppression (MEL-S) and post-light rise in melatonin (MEL-PLR). P values are obtained by Mann-Whitney two-tailed test.

Discussion

The main findings of this study are as follows: (1) light-induced melatonin amplitude suppression and post-light rise in melatonin are positively correlated to nocturnal TRH-TSH responses (i.e, 2300h-∆TSH and ∆∆TSH) in depressed patients; and (2) patients with HPT axis dyregulation show a trend toward decreased melatonin responses to light. The present results provide some evidence that melatonergic and thyroid systems are interrelated, suggesting the involvement of common mechanisms.

Pineal and thyroid activity follows a circadian rhythm closely connected to the hypothalamic Suprachiasmatic Nuclei (SCN), which house the master circadian clock. In preclinical studies SCN ablation resulted in marked alteration in both melatonin and HPT axis hormones rhythms. Thus, a downward trend in nocturnal responses of melatonin (to light) and TSH (to TRH) could possibly result from a weakened output of the SCN in depression. Moreover, since reduced ∆∆TSH values may reflect altered TRH receptor chronesthesy on pituitary thyrotrophs secondary to endogenous TRH hypersecretion (for review see Duval and Mokrani, 2018) [7], our findings could also suggest that decreased melatonin function may act at the hypothalamus by disinhibiting TRH release. Indeed, some animal studies reported that decreased pineal activity enhanced secretion of TRH, while injected melatonin altered the secretion and production of TRH [13,14].  Conversely, in vitro studies demonstrated that TRH could antagonize the effects of melatonin [15]. Therefore, another intriguing possibility is that increased TRH secretion in depression could lead to altered melatonin functionality. These latter two hypotheses are not mutually exclusive. However, future studies are needed to confirm these assumptions.

Limitations of the Present Study

Some shortcomings in our study require discussion. Firstly, owing to the lack of healthy comparison subjects we cannot demonstrate that plasma melatonin levels before and after light exposure are abnormal in depression. However, it is noteworthy that we used the same melatonin radioimmunoassay as Claustrat et al. [3] who administered light with eyeglass LED delivery systems (Somnavue® and Lumino®) in 10 healthy individuals; in comparison, the mean melatonin profile of our patients appears diminished. Secondly, given the exploratory nature of our research we studied a rather small sample of depressed inpatients. This may have reduced the statistical power of our analyses (performed with nonparametric methods) since results, although suggestive of an impaired functionality of the melatonergic system in patients with abnormal HPT axis activity, did not achieve statistical significance. Thus, our findings must be considered preliminary until replicated in a larger patient population.

In conclusion, our pilot study suggests that pineal and thyroid systems exert mutual interregulation. In the future, it will be important to understand the mechanisms underlying links between melatonin, HPT axis, circadian rhythms, and sleep-wake regulation in order to provide novel insight into the pathophysiology of affective disorders.

Aknowledgment

The authors express their gratitude to the nurses of the pole 8/9, Centre Hospitalier, Rouffach, France

Role of the Funding Source

Funding of this study was provided by inner sources (Association Pour la Formation et la Recherche de Rouffach [APF2R], Centre Hospitalier, Rouffach). No outside parties had any role in study design; in the collection, analysis, and interpretation of data; in the writing of the report and in the decision to submit the paper for publication.

References

  1. Pévet P (2014) the internal time-giver role of melatonin. A key for our health. Rev Neurol (Paris) 170: 646–652.
  2. Nurnberger JI, Adkins S, Lahiri DK, Mayeda A, Hu K, Lewy A, et al (2000) Melatonin suppression by light in euthymic bipolar and unipolar patients. Arch Gen Psychiatry 57: 572–579.
  3. Claustrat B, Brun J, Borson-Chazot F, Cohen-Tannoudji D, Claustrat F, et al (2010) Suppression of melatonin secretion in healthy subjects with eyeglass LED delivery system. Neuro Endocrinol Lett 31, 330–335.
  4. Claustrat B, Chazot G, Brun J, Jordan D, Sassolas G (1984) A chronobiological study of melatonin and cortisol secretion in depressed subjects: plasma melatonin, a biochemical marker in major depression. Biol Psychiatry 19: 1215–1228.
  5. Souêtre E, Salvati E, Belugou JL, Pringuey D, Candito M, et al (1989) Circadian rhythm in depression and recovery: evidence for blunted amplitude as the main chronbiological abnormality. Psychiatry Res 20: 263–278.
  6. Crasson M, Kjiri S, Colin A, Kjiri K, L’Hermite-Baleriaux M, et al (2004) Serum melatonin and urinary 6-sulfatoxymelatonin in major depression. Psychoneuroendocrinology 29: 1–12.
  7. Duval F, Mokrani MC (2018) Thyroid axis activity in depression. Ann Thyroid Res 4: 166–171.
  8. Wright ML, Cuthbert KL, Donohue MJ, Solano SD, Proctor KL (2000) Direct influence of melatonin on the thyroid and comparison with prolactin. J Exp Zool 286: 625–631.
  9. Prendergast BJ, Pyter LM, Kampf-Lassin A, Patel PN, Stevenson TJ (2013) Rapid induction of hypothalamic iodothyronine deiodinase expression by photoperiod and melatonin in juvenile Siberian hamsters (Phodopus sungorus). Endocrinology 154: 831–841.
  10. Mazzoccoli G, Giuliani A, Carughi S, De Cata A, Puzzolante F (2004)The hypothalamic-pituitary-thyroid axis and melatonin in humans: possible interactions in the control of body temperature. Neuro Endocrinol Lett 25: 368–372.
  11. Kjellman BF, Ljunggren JG, Beck-Friis J, Wetterberg L (1985) Effect of TRH on TSH and prolactin levels in affective disorders. Psychiatry Research 14: 353–363.
  12. Duval F, Mokrani MC, Erb A, Gonzalez Lopera F, Alexa C, et al (2015) Chronobiological hypothalamic-pituitary-thyroid axis status and antidepressant outcome in major depression. Psychoneuroendocrinology 59: 71–80.
  13. Relkin R (1978) Use of melatonin and synthetic TRH to determine site of pineal inhibition of TSH secretion. Neuroendocrinology 25: 310–318.
  14. Mitsuma T, Nogimori T (1985) Effects of various drugs on thyrotropin secretion in rats. Horm Metab Res 17: 337–341.
  15. Naftalin RJ, Cunningham P, Afzal-Ahmed I (2004) Piracetam and TRH analogues antagonise inhibition by barbiturates, diazepam, melatonin and galanin of human erythrocyte D-glucose transport. Br J Pharmacol 142: 594–608.

New Directions in Cancer Therapy – Peptide Targeting Therapy

Mini Review

About 10% of the world’s population each year is dying of cancer; if appropriate treatment is improved, it may delay and reduce this situation. From 60 to 70 years ago, the way to treat cancer, chemotherapy, is chemotherapy using a strong toxic drug, such as Endoxan (or doxorubicin) or other chemotherapy drugs to treat cancer patients. Due to the strong side effects of these anticancer drugs, after a few weeks of treatment, the patient is often subjected to great pain and even needs to stop taking the drug immediately.

Although many people have come up with alternative treatments such as interferon or interleukin-2 (IL-2) to treat a small number of tumors, such treatments also have strong side effects. Later, there was a so-called “cancer immunotherapy”, which is only 20 to 30% efficient, not only expensive, but also often accompanied by lethal side effects. In order to avoid side effects, the author team proposed another type of cancer therapy, which hopes to inhibit and kill cancer cells without causing damage to normal cells. In the process, the team designed a peptide length consisting of 12 amino acids, using a peptide library presented by phage to screen out specific peptides; this peptide can be used without binding to normal cell membranes. It binds to the cancer cell membrane. According to this method, the team first identified a peptide sequence, L-peptide, whose C-terminus binds to more than 8 cancer cells, but does not bind to normal cells [1, 2].

Not only that, but the team also covalently bonded the N-terminus of the L-peptide to the liposome containing the chemotherapeutic drug, and the other end of the L-peptide was still able to adhere to the cancer cell membrane. Through this action, chemotherapy drugs can be brought into cancer cells to kill cancer cells. Immediately afterwards, the team continued to use the phage to displayed random peptide library, and successively identified “SP94 peptide” and “PC5-59 peptide”, which can bind to the cancer cell membrane and the microvascular cell membrane in the tumor. After confirming its ability to bind to various cancer cell lines, the team has further experimented with peptide-targeted therapy, which has been shown to inhibit tumor growth and reduce the side effects of chemotherapy drugs [3].

Dr. Wu Hang-chung, Dr. LeeTong-Yound and Dr. Zhang Dekuan continued their efforts in the laboratory of the author team and several other graduates who graduated from the laboratory. The peptide biomarker research has achieved 13 international patents. With a very high evaluation; from the beginning of the research, the laboratory has accepted more than 35 cancer associations and research institutes from all over the world to give a speech. Only time is limited, and finally only choose Soviet Russia, Japan, China, Taiwan Pathology Medical Association, Singapore, Italy, the Czech Republic and the United States to communicate. Among them, 60% of the invited units arranged for the author to be the keynote speaker of the seminar.

Currently, Dr. Wu Hang-chung, a researcher at the Academia Sinica, is dedicated to the research of cancer and infectious diseases. In the research of dengue virus, he has successfully developed four in vitro detection kits that identify four dengue virus antibodies and have high sensitivity and specificity. The reagent is more effective than the currently available fast screening reagents; and its immunotarget anticancer drug delivery system research has great clinical potential, not only breaks through the bottleneck currently facing cancer treatment, but its innovation research has also led internationally. Among the research results, there are 13 technical licenses (including 36 patents) for the biotechnology industry, and the total transfer amount of technology transfer exceeds NT$250 million, which is expected to become one of the important future research and development achievements of the country.

References

  1. Lee TY, Wu HC, Tseng YL, Lin CT (2004) A novel peptide specifically binding to nasopharyngeal carcinoma for targeted drug delivery. Cancer Res 64: 8002–8008.
  2. Chang DK, Lin CT, Wu CH, Wu HC (2009) A Novel Peptide Enhances Therapeutic Efficacy of Liposomal Anti-Cancer Drugs in Mice Models of Human Lung Cancer. PLOS ONE.
  3. Jon-Kai Hsial, Hang-Chung Wu, Hon-Man Liu, Alice Yu, Chin-Tarng Lin (2015) A multifunctional peptide for targeted imaging and chemotherapy for nasopharyngeal and breast cancers. Nanomedicine: Nanotechnology, Biology, and Medicine 11: 1425–1434.

Different Interactions and Different Selves: A Mind Genomics Exploration of Social Theory

Abstract

The study presents a cartography of the ‘self’ from the point of view of experimental psychology, applied to social theory. We explore how people describe themselves in their interactions with others, using experimentally designed vignettes of descriptive statements, constructed according to the prescriptions of Mind Genomics. The pattern of deconstructed responses to the vignettes and the weighting factors of the descriptive statement suggest that people divide into three mind-sets one group focusing on people, one group focusing on games, and one group hard to define. The study presents a tool, the six-question PVI, personal viewpoint identifier, which allows the researcher to assign a new person to one of the three mind-sets based upon the pattern of response to the six questions. The study failed to find a strong co-variation of age with membership in the mind-set, but does suggest that response time to the different descriptive statements may show the hypothesized relation of personality to age.

Introduction

Philosopher George Herbert Mead wrote that the self emerges from the internalized interactions with others. Of course, heredity is a kind of base from which to build the self, but it is not the ongoing architect of the self. Rather, beginning with internalized interactions with parents, the self can be said to be formed over time. Following this idea, one can think of a person’s self as a kind of congeries of internalized others, thinking and action are a result of a sort of internal discussion among those “others.”

The theoretical thinking behind this study can be summarized in these nine points:

  1. The human personality is not fixed.  It is a kind of ongoing internal conversation, sometimes placid, and directed, sometimes excited and divergent.
  2. Personality is constructed on a base of face to face interactions when very young, usually primarily with parents, somewhat later with other meaningful others [1].
  3. These interactions are internalized into a kind of picture of the world with which the person acts.  Mead called this the “generalized other” [2].
  4. As the person ages, he or she integrates others, bits and pieces of the meanings and attitudes of peers, teachers, buddies, enemies.  That means that the person is always changing, although the evolving personality builds on that early base [3].
  5. Even though the person does change over time those changes slow as the person ages.
  6. Interaction with these others is most effective and meaningful when they are directly made, not mediated by such things as telephones, the internet, or writing.
  7. Other important inputs come from the worlds of advertising, marketing, the media, education, video games, and word of mouth. DeCerteau [4] called these “fragments.”  These fragments are less ordered and, as they are integrated, lead to less organized and connected personae.
  8. In addition, the media (and the new social media) have become more salient in people’s lives. A middle-class white person may spend up to seven hours a day immersed in commercial media or the new social media.  A French commentator [5] even believed that the action, color, and fury of the commercial media can become “hyperreality”, displacing the dull, often degrading, everyday reality. If true, then man of us live at least in part in dream worlds,
  9. Assuming all this is true, we can expect that the forms of connection among different people will reflect in their behavior.  That is, that people will internalize their interactions with “others”. These internalized “others” form a “self.  Thought in that “self” is a kind of internal discussion. What those “others” are like may vary dramatically across people [6].

Mead could not envision the complex communications world today.  Beginning in early childhood, other kinds of communications have augmented and replaced face-to-face interactions.  The telephone, texting, Facebook exemplify of mediated interactions.   Television is an example of one-way interaction mediated by images on a screen. Games and AI (artificial intelligence) are examples of two-way interactions with non-humans, even interactions with those who/which are sometimes wiser and more correct than mere humans.

What kinds of selves result from this change in the life-worlds of people now? A core hypothesis is that people formed in the world of mediated communication are less likely, less able to immerse themselves in direct interpersonal communication.  Why be bound by time and space when one can text?  Why argue with someone else when you can cut him (or her) off on Facebook?

The ideal way to answer this and other questions is to do a massive longitudinal study.  Some preliminary answer can be uncovered in a survey using these assumptions:

  1. People can identify their own behavior adequately without delving into precise measures of time spent of that activity.
  2. Age can serve as an adequate substitute for longitudinal research.  Older people internalize the effects of less mediated interpersonal relations; younger people will have internalized the effect of more mediated, less-interpersonal relations.

Subjecting Mead’s conjecture to empirical analysis using a Mind Genomics experiment

One of the key tools of sociology is the survey, wherein the respondent is asked a variety of relevant questions about a topic, responds, and then the answers are tabulated, and, in some cases, compared to exogenous behavior, so-called ‘real world’ behavior.  This approach is the sociological approach, working with large numbers, and seeking covariations between and among variables, covariations which should be relevant and strong, so that the relations emerge out of the background ‘noise.’ From this emergence, the results, usually from noisy cross-sectional analysis, show significant relations, occasionally sufficient to falsify the hypothesis, but not necessarily strong enough to force acceptance of the hypothesis.

Mind Genomics provides sociological theory with a different way to think of the problem, one which works with systematically varied stimuli, phrases, obtains responses, reveals strong relations where they exist, and thus more rapidly drives to accepting or falsifying the conjecture.

In the study reported here, people were instructed to judge the extent to which a series of combinations of forms of communication (vignette) described them. These vignettes comprised statements about the actual communication as well as statements about their own wishes and desires with respect to others. The responses to these combinations were deconstructed to see what messages within the vignettes truly defined the respondent. The rationale for using vignettes comprising combinations, rather than the more common ‘isolated, single idea’ that ‘mixtures’ of messages provide a more ‘natural’ type of stimulus, a compound description of the type one typically encounters, Furthermore, the systematized mixing of different descriptions into vignettes, make it impossible for the respondent to ‘game’ the system, to be politically correct, and in doing allow one’s an internal mental editor to skew the results.

Method

The study used Mind Genomics, a newly emerging branch of psychological science with roots in mathematical psychology, marketing, and statistics [7–11]. Mind Genomics focuses on the experimental analysis of the everyday, the quotidian aspects of our lives. The ingoing principle of Mind Genomics, the world-view it presents, the methods it uses, the conclusions it draws, can be likened to the exploration of new worlds, telescopes when these new worlds are galaxies, cartography when these new worlds are lands, and the microscope and MRI (Magnetic Resonance Imagery) when the new worlds are biological tissue. In other Mind Genomics can be likened to mapping a world in terms of its granular specifics, without obeisance to the twin standard scientific efforts of ‘minimizing noise, and ‘falsifying an ingoing hypothesis. Mind Genomics looks for patterns and stops there.

Mind Genomics proceeds in a series of steps. We follow these steps with the data presented here.

Step 1 – Define the topic:  The topic here is the nature of social interaction, in a world of pervasive electronics which compete for people’s time and which allow a person to interact with others in many ways, or not interact at all with people. The person may even to choose to interact with the increasingly realistic ‘world’ generated by the electronic device.  The topic here is the ‘nature of one’s response to different forms of communication in an era of enhanced electronics’

Step 2 – Create the ‘raw material’ using the Socratic approach of question and answer(s):  The raw material comprises a set of statements about the topic, statements which paint a ‘word picture.’ The research requirement is that the investigator work within the scope of the topic, asking four questions which ‘tell a story’ and then for each question, provide four ‘answers.’ The answers are simple stand-alone phrases. Table 1 presents these questions and answers.

Table 1. The ‘raw material’ for the study, comprising four questions, and four answers to each question.

Question A: How do I communicate with people?

A1

Talk directly with people a lot

A2

Talk on the phone a lot

A3

Use Skype What’s App even dating chats a lot

A4

Text and email a lot

Question B: How do I communicate with non-people?

B1

Often work alone on computer

B2

Often play games on smartphone or computer

B3

Research look up facts, e.g., Google or Siri

B4

Read a lot on the screen. e-books or blogs

Question C: How do I care for others?

C1

I want to be mainly with my friends

C2

I want to be mainly with my co workers

C3

I want to be mainly with my family

C4

I want to enjoy meeting new people A LOT

Question D: What do I want ?

D1

I would feel great when Ieft alone

D2

I would feel great when I’m known as a friendly person

D3

I would feel great when I’m known as successful and well off

D4

I would feel great when I’m respected

The Socratic method of questions and answers becomes a simple way of organizing different types of ideas. The questions will never be used in the actual respondent-facing experiment. Rather, the questions (also known as silos or categories) are simply there to drive the production of the different answers (also known as elements.)  It is far easier to break the preparation into the two parts of developing questions which ‘tell a story’ (often considered the harder step), and then answering those questions with four alternative answers to each question (often considered the easier step.)

Step 3 – Use an Underlying Experimental Design to Specify the Combinations of Answers:  Mind Genomics works by mixing/matching answers from the different questions. The underlying experimental design ensures that the effort to create the combinations is successful, in a manner which is both not onerous to the respondent and enables the data to be analyzed using OLS (ordinary least-squares) regression [12].

The underlying design has been presented previously [13], the design is a single structure, which, for this study calls for 24 different combinations or vignettes. Each combination comprises at most one answer from a question, but in many of the vignettes one or two questions do not contribute answers. These are incomplete combinations but tested alongside the complete combinations comprising exactly one answer from each question.

The experimental design ensures that each of the answers appears equally often across the set of 24 vignettes, and that the 16 answers are statistically independent. Furthermore, the incompleteness of some vignettes in the design prevents multi-collinearity. Furthermore, the incompleteness of the vignettes ensures that coefficients emerging from the OLS regression will have absolute properties, not relative ones. If the vignettes were all to have exactly one answer from each question, a practice of most individuals using ‘conjoint measurement’ and experimental design, then the regression coefficients would be relative, not absolute, and the exercise would have very little value for an archival science where the values of the coefficients are to have meaning as the science grows.

The actual creation of the experiment is done by transferring these questions and answers to a computer app. Figure 1 shows and example of what the researcher does to set up this Mind Genomics experiments. The entire process is ‘templated’ turning the ‘thinking’ part into the most effortful part of the project. The researcher need only ‘fill in the blanks,’ but must think strenuously about framing the topic as questions and answers.

Mind Genomics-024 - ASMHS Journal_F1

Figure 1. Example of the templated approach to doing the study. The figure shows the screens requiring the researcher to select four questions, and then provide four answers to the first of the four questions.

Mind Genomics-024 - ASMHS Journal_F2

Figure 2. The five-point rating scale, incorporating two smaller scales within.

Step 4 – Create the Respondent Orientation Page:  Social research with questionnaires is often done using simple scales, such as degree of feeling, from no feeling to strong feeling, or degree of agreement from disagree to agree. The first, degree of feeling, is an assessment of the attitude or behavior as it stands by itself, such as the strength of one’s belief in the attitude. The second is the degree to which the attitude or behavior ‘fits’ or ‘describes’ a person or a situation. The second, therefore, calls into play both one’s perception of the attitude or behavior, first as it exists, and then as it describes something or someone. There are two judgments in the second, albeit combined into one.

A good analogy of this division of questions comes from the world of food, specifically the area of sensory evaluation of a product, such as a pickle. One can rate the sourness of the pickle, a presumably ‘objective rating’, albeit one mediated by the sensory system. Or, in contrast, one can rate the degree of liking of that sourness, requiring the respondent to do two things when evaluating. The first is perceive the sourness, an action which is never observed. The second is judge the perception, an action which is observed.

The foregoing, evaluation of liking, was the motivator for the use of a modified scale, shown in Figure 2. The scale comprises five points. The scale really comprises two scales, a scale of approval (do not approve, approve) and a scale of reference (not like me, like me, exactly like me). In statistics the scale is known as a nominal scale. We will not use the numerical values of the scale, which are simply placeholders. Rather, in the analysis of the scale data we will look at the scale from three different points of view:

4a. Define the person – exactly me (select 5) versus not exactly me (select 1,2, 3 or 4).  When we look at defining the person, a rating of 5 will be converted to 100 (plus a very small random number to ensure that the regression doesn’t crash.) A rating of 1,2,3 or 4, respectively, will be converted to 0 (plus a very small random number

4b. Define Like ME. Remove all vignettes with a rating of 5. For the remaining vignettes,  assign a value of ‘100’ when the rating is 2 or 4, and assign a rating of ‘0’ when the rating is 1 or 3. This strategy creates a new variable which becomes ‘100’ when the rating is ‘like me’

4c. Define APPROVAL. Remove all vignettes with a rating of 5. For the remaining variables, assign a value of ‘100’ for ratings of 2 or 3, respectively. These were ratings of approval. Assign a value of ‘0’ for ratings of 1 or 4, which signaled disapproval.

Step 5 – Execute the study in the field:  The Mind Genomics studies have been ‘templated’ so that they are easy to create, and to deploy. The traditional methods of market research have been to ask people to participate, encouraging participation by such anodynes as ‘your opinion counts.’ Waiting for the respondents to participate without any coercion such as membership in a panel has, in the past decades, become increasingly an exercise in futility. The Mind Genomics APP is equipped with a module allowing the researcher to select the target group and pay for the respondents who participate from that group. The payment fee, nominal at $2.60/respondent for a four-minute interview, virtually guarantees that the study of 50 respondents as shown here will be entirely completed, and rapidly, automatically summarized with an accompanying report approximately one-two hours after the study has been launched to the public.

Step 6 – Prepare the Data for Analysis: The data are recoded and prepared for regression analysis. The scale ratings are converted to a binary scale, 0/100. The response time remains as measured, the number of seconds (to the nearest tenth of a second) between the time the vignette appears on the screen and the time that the respondent keys in a rating.

The nature of the rating scale and the analysis required that the data be recoded, and then analyzed by OLS (ordinary least-squares) regression. The five-point scale shown in Figure 2 was deconstructed into the following sets of variables:

  1. Each of the five rating points became its own attribute (R1, R2, R3, R4, R5). For vignette only one of the five newly created attributes corresponded to a rating that had been chosen. For example, when the respondent selected R5, the newly created variable of R5 was converted to 100, and the other four newly created variables were converted to 0.
  2.  A new variable ‘NET ME’ was created. NET ME had the following structure: Ratings ‘2’ and ‘4’ were converted to 100; Ratings ‘1,’ ‘3,’ were converted to 0.
  3. A new variable ‘NET APPROVE’ was created. Ratings ‘2’ and ‘3’ were converted to 100. Ratings ‘1’ and ‘4’ were converted to 0
  4. For analysis of the relation between the presence/absence of the 16 elements and both ME and APPROVE, all vignettes assigned a rating ‘5’ were removed from the database

Step 7 – Build the model for EXACTLY ME: Our data comprised 50 respondents x 24 responses to the 24 systematically created vignettes for each respondent. Every respondent evaluated a unique set of 24 such vignettes, so we cannot average the ratings of the vignettes to get a sense of what ideas or messages work, and what do not work. The more appropriate way is to create a model, either for the total panel, or for the relevant subgroup (e.g., a specific age group). The model is expressed by the simple linear equation: EXACTLY ME = k0 + k1(A1) + k2(A2) … k16(D4).  The coefficients show the contribution of each element to the likelihood that the vignette will be rated ‘5’, i.e., EXACTLY ME.’ The additive constant, k0, is a purely estimated parameter, showing the expected probability of a vignette will be rated ‘5’, EXACTLY ME in the absence of elements. The additive constant, purely theoretical, serving a purpose, but not necessary to the understanding of the comparative performance of the elements.

Step 8 – Lay out the data in a matrix form and identify patterns in terms of which particular elements ‘drive’ the response EXACTLY ME: Table 2 shows us the results from the analysis of EXACTLY ME.  Each column of data represents the coefficients for the model estimated by putting ALL relevant respondents in the subgroup into a single pool of data, and then running ONE OLS regression on all the data of the group of relevant respondents. Thus, for Age 15–24, we compute only one OLS regression, incorporating all the relevant data.

Table 2. How the 16 answers ‘drive’ the selection of EXACTLY ME (Rating of 5 transformed to 100; Ratings 1,2,3,4 transformed to 0.

Total

Age

Mind-Set


Model based on relating the binary scale from R5 (Exactly ME) to the 16 answers or elements

Total

A15–24

A25–39

A40+

3C- Games

3D – Other

3E – People

Base size

50

14

17

19

17

17

16

Additive constant

27

24

24

28

26

33

26

B2

Often play games on smartphone or computer

5

5

0

11

10

1

3

C3

I want to be mainly with my family

3

-1

4

5

4

0

6

D2

I would feel great when I’m known as a friendly person

1

1

2

4

4

-11

10

D4

I would feel great when I’m respected

0

8

-4

0

-2

1

1

B1

Often work alone on computer

-1

4

-6

1

-2

2

-5

B4

Read a lot on the screen… E-books or blogs

-1

-3

-5

4

-4

2

-2

C1

I want to be mainly with my friends

-1

4

0

-3

-1

0

0

C4

I want to enjoy meeting new people A LOT

-1

2

4

-6

1

0

-2

B3

Research look up facts e.g. Google or Siri

-2

-6

-8

8

-2

-6

1

D1

I would feel great when Ieft alone

-2

10

-8

-3

-2

-2

-2

A1

Talk directly with people a lot

-3

-13

5

-1

-15

0

3

A4

Text and email a lot

-3

-8

10

-9

-9

-9

7

D3

I would feel great when I’m known as successful and well off

-3

4

-5

-3

-1

-6

-1

A2

Talk on the phone a lot

-5

-4

1

-11

-11

-2

-7

C2

I want to be mainly with my co workers

-5

6

-6

-10

1

-8

-8

A3

Use Skype What’s App even dating chats a lot

-10

-8

-2

-16

-11

-17

-7

The respondents from the different age groups and different mind-sets show similar additive constants (24–33). The low additive constant suggests that, in the absence of elements, a purely hypothetical situation, we might expect a quarter to a third of the responses to be ‘Describes EXACTLY ME. The additive coefficient is a good baseline. It will the task of the individual elements to drive the perception of ‘EXACTLY ME’

There are no strong performing elements for Total Panel. This failure for any single element to drive a strong rating of EXACTLY ME may result either from the fact that no elements describe the respondent, or more likely, from the fact that there are countervailing forces which cancel each other.   In contrast, key subgroups show dramatic differences

Total Panel

No strongly performing element

Age 15–24

I would feel great when Ieft alone
I would feel great when I’m respected
I want to be mainly with my co workers

Age 25–39

Text and email a lot

Age 40+

Often play games on smartphone or computer
Research look up facts e.g. Google or Siri

Step 9 – Uncover Mind-Set segments from the total population, based on EXACTLY ME: One of the key objectives of Mind Genomics is to uncover new-to-the-world groups of ideas or people, which provide a unique and identifiable focus. We introduce mind-sets here, as part of the way we classify the respondents. We create these mind-set segments by clustering coefficients. We begin by creating the EXACTLY ME model for each respondent, so that we create 50 individual models. This is made possible by the way we set up the study, which was to create the vignettes from each respondent using an underlying experimental design. The benefit is that now we create a model for each respondent separately. We store the 16 coefficients, not the additive constant, and then cluster the 50 respondents using the pattern of their 16 coefficients.

We generated two and then three clusters, so-called mind-set segments.  The two-cluster solution did not make sense, and was difficult to interpret, so we discarded it. The three-cluster solution made sense in terms of interpretation, and so it becomes the basis for the subsequent analysis of ‘what these data suggest about personality.’  Clustering is a well-established approach [14]. The final three data columns one the right side of Table 2 shows the coefficients for the three emergent mind-sets.

From the response patterns based on the linkage between the 16 answers and the rating of EXACTLY ME we can also assign names to the mind-sets

Mind-Set 3C – Focuses on games

Often play games on smartphone or computer

Mind-Set 3D

Nothing

Mind-Set 3E – Focuses on people

I would feel great when I’m known as a friendly person
Text and email a lot
I want to be mainly with my family

Finding these mind-sets in the general population

Traditional research has often assumed, whether explicitly or implicitly, that people who are similar to each other should be the basis of groups to be studied. The corollary to that is that people who are similar should think in similar ways. That is, we think of groups of people in terms of who they ARE and assume that how they THINK will be the same. Table 2 shows clearly that there are different patterns of thinking and different criteria for the same topic. Table 3 shows that these three groups of people, mind-sets, distribute in similar ways across the population. If we were to expand this study to be a thousand times larger, with 50,000 respondents rather than 50 respondents, it is quite likely that we would still be faced with a flat distribution of mind-sets cross the traditional groupings in the populations.

Table 3. Distribution of the three mind-sets across age, gender and the choice of what is most important (from the self-profiling classification at the start of the Mind Genomics experiment).


MS 3C Games

MS 3D Other

MS 3E People

Total

Total

17

17

16

50

Gender

Male

9

7

9

25

Female

8

10

7

25

Age

A15–24

6

4

4

14

A25–39

4

8

5

17

A40–82

7

5

7

19

What is most important

Being with other people

11

4

8

23

Where I live

3

2

2

7

What I own

0

2

1

3

Work I do now

2

5

3

10

No answer

1

4

2

7

In order to assign a new person to the appropriate mind-set we engage the new person in a short interaction, with a set of questions, designed to predict membership. The approach is known as the PVI, the personal viewpoint identifier. The six questions are those which best differentiate among the three mind-sets. The questions are taken for the set of 16 answers or elements, recast as questions, and given to possible answers. The 64 different patterns that could be created from the set of six questions are mapped to the three mind-sets, so that each response pattern assigns the person who produces that pattern to one of the three mind-sets.

Figure 3 shows the six-question PVI for this study. Figure 4 shows the feedback for the three different patterns. The feedback can be given to the new individuals or stored in a database for further research or for application in later deployment, such as sales or voter communication.

Mind Genomics-024 - ASMHS Journal_F3

Figure 3. Example of the personal viewpoint identifier, showing the six questions, and the two-point rating scale. The pattern of responses assigns the person to one of the three mind=-sets.

Mind Genomics-024 - ASMHS Journal_F4

Figure 4. Three feedback pages, showing the mind-set to which the new person belongs, as what to say and what not to say to the respondent.

Beyond EXACTLY ME to LIKE ME, and I APPROVE, respectively

The rating scale was set up to represent a graded scale in two dimensions, with two levels. These two dimensions have been captured in the four remaining scale values. It becomes straightforward to relate the presence/absence of the 16 answers to either ME or APPROVE by eliminating all vignettes with rating 5, and then creating two new dependent variables. The two new dependent variables are ME (defined 100 when the rating is either 2 or 4; defined as 0 when the rating is either 1 or 3) and APPROVE (defined as 100 when the rating is either 2 or 3; defined as 0 when the rating is either 1 or 4).

The foregoing recoding allows us to create two equations for any subgroup. The two dependent variables capture different types of judgments (WHO vs JUDGE).  Table 4 shows the coefficients for the two models.  In general, respondents say that they can be described as people-oriented (I want to be mainly with my family; I want to enjoy new people A LOT), and most approve of talking on the phone.  In other words, people see themselves as social, at least in general.

Table 4. Coefficients of the equations relating the presence/absence of the 16 answers/elements to judgments of ‘Like ME’ and ‘Approve’

Total Panel

ME

APPROVE

Additive constant

43

61

C3

I want to be mainly with my family

10

-4

C4

I want to enjoy meeting new people A LOT

6

-1

A2

Talk on the phone a lot

-3

9

A1

Talk directly with people a lot

-1

1

A3

Use Skype What’s App even dating chats a lot

-8

0

A4

Text and email a lot

0

-2

B1

Often work alone on computer

-4

-4

B2

Often play games on smartphone or computer

2

-1

B3

Research look up facts, e.g. Google or Siri

1

-5

B4

Read a lot on the screen. e-books or blogs

1

-7

C1

I want to be mainly with my friends

1

-1

C2

I want to be mainly with my co workers

4

1

D1

I would feel great when Ieft alone

-2

-1

D2

I would feel great when I’m known as a friendly person

4

-7

D3

I would feel great when I’m known as successful and well off

3

0

D4

I would feel great when I’m respected

0

-4

Response patterns by Age Groups

When we break down the respondents to the three age groups three patterns emerge:

  1. The youngest respondents (age 15–24) do not find much which resembles them. They approve of being sociable yet also approve of playing games and being left alone. They talk in two different ways, social and alone.
  2. The middle group of respondents (age 25–39) strongly feel that they are social, talking with people. They give blanket approval to what they read (additive constant 78).  They are agreeable.
  3. The oldest group (age 40+) also describe themselves as both social yet play a lot of games on the computer. They very strongly approve of direct contact with people, either in person or on the phone.

Response patterns by the previously uncovered group of three mind-sets

  1. Mind-Set 3C (gamers) feel that they are social and like to meet people. They strongly approve of talking on the phone, but that is all.
  2. Mind-Set 3D (other) feel that they are family oriented. They strongly approve of being social, being considered successful, yet also approve of being alone. They do not use the computer for information.
  3. Mind-Set 3E (people-oriented) say that they are people-oriented but also say that they like to play games on the computer. They primarily approve of talking on the phone a lot.
  4. The division of respondents into mind-sets generates mind-sets which overlap. That is, people divide into different groups, but these groups have much in common. This is not surprising, since people are more alike than different, so we are dealing with nuances of difference. In contrast, when we apply the Mind Genomics methods to issues outside personality, such as preferences for the products, such as a line of pasta sauces, we see radical differences, with some people liking spicy products, others liking chunky products, and so forth.

Step 10 – Link Response time to the elements: In the history of experimental psychology, the measurement of response time (also known as reaction time) occupies a venerable place. First suggested by the pioneering experimental psychologist, Wilhelm Wundt [15], response time was thought to signal something about the underlying psychological processes. Long response times were believed to be associated with unknown internal mechanisms, such as consideration of the message, efforts to block the message, and so forth.  Often, however, the specific internal mechanisms were not elaborated.

Mind Genomics incorporates the measure of response time in order to assess the degree to which the message ‘engages attention,’ resulting increased processing time, and thus increasing the response time. Once again, the benefit of experimental design at the level of the individual respondent becomes apparent. One can measure the response time to a set of vignettes.  Knowing exactly how the vignettes were structured enables one to relate the presence/absence of the individual elements to the response time. The outcome is the estimated number of seconds of response time that can be traced to the presence of the answer or element in the vignette.

The model for response time is the same as that used to relate the binary value of EXACTLY ME to the presence/absence of the 16 answers. The only differences are that the response time now becomes the dependent variable, and there is no additive constant in the equation. The rationale for abandoning the additive constant is that in the absence of answers (elements in the vignette) there is no response, and therefore the dependent variable is always 0.

Table 5. How age groups differ. Coefficients of the equations relating the presence/absence of the 16 answers/elements to judgments of ‘Like ME’ and ‘Approve’.

A15–24

A25–39

A40+

A15–24

A25–39

A40+


ME

APPROVE

Base Size

14

17

19

14

17

19

Additive Constant

58

42

31

48

78

57

B4

Read a lot on the screen. e-books or blogs

13

-11

1

-9

-9

-5

C4

I want to enjoy meeting new people A LOT

-10

24

6

14

-13

-6

C3

I want to be mainly with my family

-7

23

11

16

-13

-10

C1

I want to be mainly with my friends

-15

17

2

16

-3

-12

A4

Text and email a lot

0

12

-6

-15

-6

9

C2

I want to be mainly with my co workers

-2

12

6

9

0

-10

D2

I would feel great when I’m known as a friendly person

-5

8

9

-6

-8

-6

A2

Talk on the phone a lot

0

7

-12

2

0

23

D3

I would feel great when I’m known as successful and well off

-3

-9

17

-2

-2

5

B2

Often play games on smartphone or computer

-3

-7

11

9

-1

-9

B3

Research look up facts; e.g. Google or Siri

-5

-5

8

-9

-17

6

D4

I would feel great when I’m respected

-3

0

5

-3

-6

-6

D1

I would feel great when Ieft alone

-4

-10

4

8

4

-9

B1

Often work alone on computer

-16

-2

1

3

-11

-3

A1

Talk directly with people a lot

-1

-1

-3

-13

2

13

A3

Use Skype What’s App even dating chats a lot

-3

-5

-12

2

0

0

Table 6. How mind-sets different in the pattern of coefficients of the equations relating the presence/absence of the 16 answers/elements to judgments of ‘Like ME’ and ‘Approve’


ME

APPROVE

MS 3C

MS 3D

MS 3E

MS 3C

MS 3D

MS 3E

Games

Other

People

Games

Other

People

Additive constant

51

45

33

59

57

64

D2

I would feel great when I’m known as a friendly person

10

-2

4

-7

3

-16

D3

I would feel great when I’m known as successful and well off

8

-7

8

-2

6

-3

A1

Talk directly with people a lot

6

-10

-2

-5

6

4

C4

I want to enjoy meeting new people A LOT

6

-7

18

4

6

-16

C3

I want to be mainly with my family

4

11

14

3

-7

-7

C2

I want to be mainly with my co workers

5

-7

14

4

6

-10

B2

Often play games on smartphone or computer

-1

2

7

-6

6

0

C1

I want to be mainly with my friends

-4

1

6

4

-4

-7

D4

I would feel great when I’m respected

-2

2

5

-10

2

-5

B4

Read a lot on the screen. e-books or blogs

1

-1

5

-12

-3

-4

B3

Research look up facts e.g. Google or Siri

5

-7

4

-7

-3

-4

D1

I would feel great when Ieft alone

-5

-2

2

-8

8

2

B1

Often work alone on computer

-13

1

1

-1

-1

-6

A4

Text and email a lot

-5

3

0

-2

-2

0

A2

Talk on the phone a lot

-10

4

-4

9

5

17

A3

Use Skype What’s App even dating chats a lot

-7

-9

-10

5

2

-5

Table 7 presents the coefficients for the response time model. We look at all 1200 vignettes in the analysis, the 24 vignettes for each of the 50 respondents. The longer the response time, the more the message ‘engages.’ By ‘engages’ we mean the respondent appears to spend MORE TIME reading the answer when the answer is part of the vignette.   Engage is not the same as EXACTLY ME, and in fact the two variables do not correlate with each other.

Table 7. Response Time of elements by Total Panel and key subgroups. Response times of 1.5 seconds or longer are shown as cells which are shaded and the response time in bold numbers.


Response Time (seconds) based upon relating the response time of the vignette to the presence/absence of the answers/elements contained in the vignette

Tot

A1524

A2539

A40+

MS3C – Games

MS3D – Other

MS3E – People

A1

Talk directly with people a lot

1.1

0.5

1.4

1.2

1.3

0.3

1.6

A2

Talk on the phone a lot

1.0

1.2

0.7

1.0

0.9

0.7

1.3

A3

Use Skype What’s App even dating chats a lot

0.7

0.8

0.5

0.7

0.5

0.5

1.0

A4

Text and email a lot

1.1

1.0

0.8

1.4

1.4

0.3

1.6

B1

Often work alone on computer

1.0

0.5

0.9

1.3

1.3

0.7

1.0

B2

Often play games on smartphone or computer

1.1

0.8

0.8

1.6

1.6

1.1

0.6

B3

Research look up facts, e.g. Google or Siri

1.2

1.1

0.8

1.5

1.7

1.0

0.7

B4

Read a lot on the screen. e-books or blogs

0.9

0.5

1.0

1.2

1.3

0.6

0.9

C1

I want to be mainly with my friends

1.2

0.5

1.1

1.7

1.6

0.5

1.4

C2

I want to be mainly with my co workers

1.3

0.7

1.1

1.8

1.5

1.0

1.3

C3

I want to be mainly with my family

1.1

0.1

1.1

1.7

1.4

0.5

1.2

C4

I want to enjoy meeting new people A LOT

1.0

0.1

0.6

1.8

1.7

0.1

1.1

D1

I would feel great when Ieft alone

1.2

0.9

0.9

1.6

1.0

1.5

1.1

D2

I would feel great when I’m known as a friendly person

0.9

0.3

1.0

1.5

1.1

0.5

1.4

D3

I would feel great when I’m known as successful and well off

1.2

0.3

1.5

1.6

1.2

1.1

1.3

D4

I would feel great when I’m respected

1.0

0.2

1.0

1.6

0.6

1.1

1.4

To make it easier to understand the relation between answer/element and response time, we have shaded all cells with response times of 1.5 seconds or longer. There are no norms to guide us in the definition of what is a meaningful ‘engagement response time’ and so we arbitrarily choose a value for a long response time, based upon previous studies.  We note here that in many studies of the same sort, but with commercial products rather than personality descriptions, we find response times to be very short. The response times there are often a few tenths of a second for individual answers/messages embedded in the vignette.

The data suggest that there are differences in response time, especially by age, with the older respondents taking longer times to read and make their decisions. It may be that older respondents take a long time to react to the messages, whereas the younger respondents react quite quickly. That is not the only story to emerge, however. What is remarkable about the response time is that the older respondents appear to pay more attention to phrases which talk about their own aspirations as persons. It may well be that some of the conjectures about personality put forward by Mead might be supportable from the behavior of the older people, focusing on interpersonal reactions through their response times.

Here are the key groups, and the elements which ‘engage,’ i.e., which generate long response times.

Total Panel:

Nothing engages

Age 15–24:

Nothing engages

Age 25–39

I would feel great when I’m known as successful and well off

Age 40+

I want to enjoy meeting new people A LOT
I want to be mainly with my co workers
I want to be mainly with my friends
I want to be mainly with my family
Often play games on smartphone or computer
I would feel great when I’m known as successful and well off
I would feel great when Ieft alone
I would feel great when I’m respected
Research look up facts e.g. Google or Siri
I would feel great when I’m known as a friendly person

Mind-Set 3C – Focuses on games

I want to enjoy meeting new people A LOT
Research look up facts, e.g., Google or Siri
I want to be mainly with my friends
Often play games on smartphone or computer
I want to be mainly with my co workers

Mind-Set 3D – Other

I would feel great when Ieft alone

Mind-Set 3E – Focuses on people

Text and email a lot
Talk directly with people a lot

Discussion and Conclusion

The origins of this study come from an attempt to merge a theory of personality (G.H. Mead) with an empirical analysis of how people think of themselves (Mind Genomics.)  The ingoing hypothesis was that there would be an age-related change in personality, coming in part from the process of socialization and the way people interact with each other in a world of emerging electronic intermediations.  The Mind Genomics data suggest that there are differences in the way people describe themselves, but there does not appear to be a simple age-relation.

Mead’s conjecture about age might, however, play a role in the pattern of response times, the ‘engagement’ time that it takes for a respondent to make a decision. The older respondents appear to pay more attention than do the younger respondents, a pattern that might at first be construed as a simple age difference. There is a deeper aspect to the difference. The gap in the response time differs by the nature of the phrase. The longest response times for those ages 40+ come from phrases which talk about the person and who the person is.  Response time, a measure of engagement or time to process the information, may constitute a fertile new area for the understanding of issues of personality. The focus changes from insights based on ratings to insights based on active ‘mental processing.’ The insight is worthy of more investigation to understand how much may be gleaned by a deeper understanding of the dynamics of response time in Mind Genomics when the latter is applied to issues of personality.

Acknowledgement

Attila Gere thanks the support of Premium Postdoctoral Research Program of the Hungarian Academy of Sciences.

References

  1. Strauss A (1956) “Introduction” in The Social Psychology of George Herbert Mead. Pp. iv-xvi. Chicago: University of Chicago Press.
  2. Mead GH (2013) [1934]. Mind, Self & Society. Berlin: Heptagon.  Kindle Edition
  3. Carreira da Silva F (2007) G.H. Mead A Critical Introduction. Cambridge, UK: Polity.
  4. deCerteau M (1984) The Practice of Everyday Life. Berkeley: University of California Press.
  5. Baudrillard J (1994) Simulacra and Simulation. Ann Arbor: University of Michigan Press
  6. Cook GA (1993) George Herbert Mead: The Making of a Social Pragmatist. Urbana, IL: University of Illinois Press.
  7. Green PE, Rao VR (1971) Conjoint measurement for quantifying judgmental data. Journal of marketing research 8: 355–363.
  8. Green, P.E. & Srinivasan, V., 1990. Conjoint analysis in marketing: new developments with implications for research and practice. The journal of marketing, 54, 3–19.
  9. Luce, R.D. & Tukey, J.W., 1964. Simultaneous conjoint measurement: A new type of fundamental measurement. Journal of mathematical psychology, 1, 1–27.
  10. Moskowitz, H.R., Gofman, A., Beckley, J. and Ashman, H., 2006. Founding a new science: Mind genomics. Journal of sensory studies, 21, 266–307.
  11. Moskowitz, H.R. and Gofman, A., 2007. Selling blue elephants: How to make great products that people want before they even know they want them. Pearson Education.
  12. Box GE, Hunter WG, Hunter JS (1978) Statistics for experimenters, New York, John Wiley
  13. Gofman A, Moskowitz H (2010) Isomorphic permuted experimental designs and their application in conjoint analysis. Journal of Sensory Studies 25: 127–145.
  14. Dubes R, Jain AK (1980) Clustering methodologies in exploratory data analysis. Advances in Computers 19: 113–238.
  15. Boring EG (1929) A History of Experimental Psychology. The Century Company, NY

Hair Coloring: Mind Genomics Cartography of the World of Beauty

Abstract

The study investigated consumer responses to message about hair coloring, as one of the ongoing cartographies by Mind Genomics of the world of consumer beauty. Respondents evaluated short, systematically designed combinations of messages about hair coloring (vignettes), these vignettes talking about the rationale for coloring one’s hair, the feelings about changing one’s color, beliefs about the ‘downside’ of hair coloring, and a comparison of different methods for beautifying one’s hair (e.g., coloring versus cutting), respectively. The deconstruction of the vignettes into their components suggests an underlying core of at least three emergent mind-sets (Follow the prescription of others; Coloring is a personal expression; Focus on self-care). The paper presents the PVI, personal viewpoint identifier, to assign new people to one of these three mind-sets, for subsequent use in research or sales.

Introduction

Little of the published literature in ‘experimenting science; is devoted to questions of a ‘more broad nature.’ Most experiments deal with questions about a small sliver of human daily life. A search of the literature of beauty, especially the quotidian use of products and services for daily and ordinary purposes, quickly reveals that there is little in the way of archival scientific literature on study of beauty as a topic, except perhaps in the world of sociology and social ethnography.  There is some data on beauty products and services, but not the plethora of information that would be expected, given the important role that beauty plays. The reality of ‘beauty’ as a topic is that it plays a major role in civilizations which have moved beyond the subsistence stage.

If one were to comment on today’s information about consumers and beauty, it would be almost impossible to assemble a world of scientific papers on beauty, and indeed nothing in comparison to the massive wealth of written material about beauty from the point of view of people and situations. The information, often purporting to be from scientific laboratories but presented in a high style, ‘glitzy’ fashion, would have us believe that we can be the masters of beauty, controlling it for our own uses.

A search through the literature of beauty suggests very little serious information regarding the way people think about beauty products and beauty services, especially hair, except for the most superficial information. We deal here with one topic, the psychological consideration of hair coloring, a topic which suffers a death of information, other than the insistent packages of home hair color, and occupying a lot of ‘trade real estate’ to feature the different colors. The reason for such dearth of information may lie in the fact that coloring one’s hair is not considered to be a topic of major scientific interest, nor in fact is it, when presented in such sterile terms. The reality is that the entire spectrum of behavior with respect to hair is typically considered from one of two rather distinct areas, neither of which deals with the deep psychology of cosmetics as one would have thought from the popular press:

  1. Hair specifically, then skin, as a substrate for the science of the product, usually studied by chemists.  Hair products in general and hair coloring in particular, enjoy a reasonable number of papers in the world of chemistry, noticeably cosmetic chemistry, some of which appear in journals dealing with cosmetics from the point of view of science. The articles in this world deal with the science of the physical product, the performance, and the interaction with the substrate, namely the human body. The topics in journals dealing with these aspects of cosmetic chemistry can scarcely be distinguished in their manner of presentation from topics of in other chemistry journals; namely chemistry first, cosmetics second, and the human experience scarcely considered, if at all e.g., Trueb 2005 [1].
  2. Beauty as a subject of behavior, primarily social behavior. The objective of such study is ethnographic, looking at behaviors of normal people in society, as a reflection of the society and its mores. In other words, cosmetics as a topic in anthropology, namely the person’s search for (Bloch, 1993; Cash 1987; Graham & Jouhar, 1981) [2,3,4].

The World of Hair Coloring

Hair coloring in the salon has excited the interest of researchers, not just because of its fundamental behavior in the world of beauty but rather it is an aspect of behavior upon which people spend a fair amount of money. Talking care of one’s hair eventuates in psychological rewards. People receive certain things in return, certain values from the experience, which reveals a great deal about the respondent’s values as an individual, and society’s values [5,6]. In a period suffused with various ways to spend money on oneself, and demonstrate one’s values, the world of beauty represents one of the key areas wherein deep investigation is likely to deliver far more than one expects [7]. The value of cosmetics and cosmetic behavior as a lens’ into a person’s emotions and social mind has been a topic having a history of decades, far earlier than the emerging third decade of this century [4,8].

Hair coloring comprises aspects of self-preservation and health, focusing on oneself, and the pursuit of ‘wow,’ the influencing of other, and so forth.  The topic of beauty in general, and hair care, including hair coloring, provides an extraordinary opportunity to understand the human mind, in an area where the outer world and the inner world collide, compensate for each other or simply endlessly dance around as the consumer, the individual, the outer-focused and the inner focused halves  emerge and recede (Datamonitor, 2005; Euromonitor, 2005, 2013a, 2013b, 2014) [9–13].

The inner experience of beauty has been explored, but not as much as it should be, Any prolonged time exploring the internet will reveal that that the really ‘interesting, meaty stuff’ about one’s experience with beauty may have already been pre-empted those using such personal stories and accounts of experience to gain readers, provide excitement, and sell products, ‘hope in a jar’ [14].

The Emerging Science of Mind Genomics and Its Cartography of the Mind for the Experience of Beauty

Mind Genomics can be considered cartography of everyday experience, exploring and understanding the dimensions, the aspects of experience. In the case of beauty, and specifically hair coloring, Mind Genomics would explore the different topics in the experience. These are the category of questions to be answered, studies best answered by cosmetic science or sociology, or even studies of communication. But then there is the human element, the response of people to these systematically arranged ideas, the use of ‘experiment’ to identify how these elements of beauty ‘function.’ This study of function is done by taking the ‘what’, the questions and answers about the search for beauty, specifically about hair coloring, and asking the respondent to evaluate these different answers using a predefined criterion

As an aside, it is instructive to trace the antecedents of Mind Genomics back to two early ‘schools’ of experimental psychology. The early science of experimental psychology embodied two competing approaches, Structuralism versus Functionalism. Structuralists were interested in the basic dimensions of the mind, classifying perceptions, behaviors, and so forth into different groups. From that classification scheme they believed that the structures would show the nature of what they were studying. The logic was Aristotelian. Classify, organize, and one will learn. The other science of psychology, Functionalism, posited that is that it is the way things operate which inform us about what we are studied. Just knowing the different classifications of perceptions does not tell us how we perceive something (Boring, 1929) [15].

The beginnings of Mind Genomics come both from the experimental psychology of a century ago and  from today’s unique confluence of experimental design, internet communication, need for speed, and the incessant push for faster, better, cheaper, and ultimately the push for ‘utterly effective.’  In other words, from the world of business, pushed back to the world of the scientist.

Mind Genomics began with the efforts of statisticians to understand the complexities of the world, but not from the hallowed methods of isolation and study, that gift of the enlightenment, and of the empirical Francis Bacon before the enlightenment.  Isolation and study of single phenomena is fine, but in the world of beauty we deal with many variables interacting, swirling about, and creating patterns to be understood, but understood only in a general way.  Experimental design simplifies that swirling complex cloud, showing relations between variables which interact to drive a response [16]. The development of Mind Genomics, continued with the pioneering work of Luce & Tukey [17], seeking to put their approach, conjoint measurement on a firm theoretic footing. The late Professor Paul Green of the Wharton School, University of Pennsylvania, and his associates over four decades, brought conjoint measurement into the world of business [18], which in the next evolution spawned Mind Genomics [19–22].

The ‘project’ of Mind Genomics, as explicated here, begins with an aspect of everyday life, proceeds to dissect that aspect into four questions which ‘tell a story,’ generate four answers to each question, and the present combinations of these answers in short, easy-to-read vignettes. Each vignette or combination comprises as many as four answers, or as few as two answers. No question ever contributes more than one answer to a single vignette.  Over the course of 24 vignettes, each respondent is exposed to the same answer or message 5x, albeit in the context of other answers. The respondent rates the vignette on an attribute provides. The subsequent statistical analysis ensures that one can read the vignette, the respondent will see combinations of the element, albeit different combinations [23].

The Raw Materials

The raw material for the Mind Genomics study comprises a set of four questions, with each question generating four answers. Both the questions and the answers come from the researcher. There is no ‘fixed set of questions and answers.’ Rather, the questions are guides which tell a story. The answers are the communications, the messages.

The four questions in Table 1 focus on the externals of the coloring process, on what the respondent can be told by a professional. This Mind Genomics study deals with the process, and what is important about the process. It does NOT deal with feelings, except feelings affected by technology.

Table 1. The raw material, comprising the four questions, and the four answers to each question.

Question A: Why do you color your hair?

A1

Coloring hair hides the gray

A2

Coloring hair gives a person a chance to ‘change’ the look – for fun, temporarily

A3

Coloring hair is trendy today

A4

Coloring hair lets the person ‘show off’

Question B: How do you feel when you change the color?

B1

Coloring hair instills confidence

B2

It takes a little time to get accustomed to a new hair color

B3

To prevent a feeling of insecurity, the coloring has to be ‘just right’

B4

Coloring makes hair beautiful

Question C: Do you think the color damages your health, your scalp, or your hair?

C1

Hair dye can affect health

C2

Hair dye can damage hair

C3

Hair dye can damage scalp

C4

Hair dye damages nothing

Question D: What do you find more beneficial coloring, treatment or cutting?

D1

Treatment on hair should be done regularly

D2

Coloring hair should only be done every other haircut

D3

It’s important to get hair cut properly

D4

Hair should be natural… cut when needed, nothing else

Finally, the four questions in Table 1 and the 16 answers are set up in a Socratic fashion. That is, the questions are real questions, and the four answers are couched in sentences. The answers or elements suffice to stand by them, and can be mixed and matched in the vignettes, as we will see below.  Researchers who do these Mind Genomics studies often volunteer their observation that the method forces them to think in a new way, one which is structured and defined by the question and answer structure. Furthermore, participation in many dozens of these studies over the past years suggests that the hardest part of the exercise comes when the researcher must formulate the four questions so that they ‘make sense’ and present the questions in the proper order to ‘tell a story’. In contrast the answers to the questions, the phrases which will become the building blocks of the vignettes, are far simpler to create. The answers are simple phrases that will be put together in a format, one atop the other, without the effort to make sense. That effort was already expended in the creation of the questions.

Combining the Answers or Elements into Easy-To-Read Vignettes or Test Concepts

If we were to stop at this point with the 16 answers to the four questions, we could subject the 16 answers to a set of rating scales, and feel that we have done adequate research, namely testing the raw materials. There might not be any thought of an experimental design in which we embed combinations of vignettes.  The foregoing ‘one-at-a-time’ approach characterizes most of science. That process produces the image of the scientist focusing on one isolated aspect of reality, then studying it with sufficient passion and concentration until the aspect of reality yields ‘its secrets.’

The reality of experience is quite different, especially when we deal with the topic of beauty. Human experience comprises combinations of features, of ideas, of stimuli, as well as expectations, the individual’s history, and the specific nature of the combination. The traditional methods relying upon ‘isolation to understand’ simply cannot work. The researcher must deal with combinations of variables, and from the reaction to these combinations identify what works, and what doesn’t work

Mind Genomics works by using the technique of experimental design, prescribing the systematic combinations of the variables [16]. The combinations are set up so that we begin with a topic, ask four questions, and for each question provide four answers. This was already presented in Table 1. The experimental design specifies 24 combinations, with the property that each unique experimental design is a permutation of a basic, underlying ‘kernel’ design.  This property is known as a permuted design [23].  The design ensures that the 16 answers are statistically independent of each other, allowing for regression analysis. The permutation means that no two respondents ever see the same combinations.

The combinations are generated, and put into a vignette, such as the vignette shown in Figure 1. The respondent who evaluates the 24 systematically generated combinations has no idea about an underlying design. The respondent may begin by trying to be ‘consistent,’ but the combinations end up putting a stop to that effort, and in turn the respondent simply assigns an answer in an intuitive way, following what Nobel Economist Daniel Kahneman called System 1 [24].

Mind Genomics-023 - AWHC Journal_F1

Figure 1. Example of a vignette prescribed by the experimental design and put into a test combination shown on either the screen of a smartphone (shown in Figure 1) or shown on the face of a tablet or PC.

The respondent evaluated each of the 24 vignettes on a single scale, shown in the middle of Figure 1 and in Figure 2.  The five scale points deal with two aspects, first an emotional one (nervous versus interested) and second an action one (wouldn’t do it versus would do it). The two questions deal with hair coloring.

Mind Genomics-023 - AWHC Journal_F2

Figure 2. The labelled five-point scale, covering two aspects of the hair coloring experience, emotion and action, respectively.

Creating Binary Variables from the Five Scale Points in the Rating Scale

Mind Genomics studies provide a plethora of data. Each respondent evaluates 24 vignettes, doing so on a five-point scale. The single scale provides two measures; degree of feeling (nervous versus interested) and degree of intent (will not do versus will do.), respectively The Mind Genomics system also records the response time, defined as the number of seconds between the time that the vignette appears on the screen and the selection of the rating

We are fortunate to work with an underlying, ‘permuted’ experimental design, creating a unique set of 24 vignettes for each respondent, and in turn allowing us to discover the linkage between each element and both the 5-point rating and the response time. The algorithm [23] ensures the ability to understand the patterns in in a deep way.

Even before the application of modeling, we do a ‘surface analysis,’ looking at the average rating assigned by the respondents, for the 5-point scale, as well as for transformed aspects of the scale, such as ‘netting’ ‘nervous’ versus ‘enthusiastic.’ The logic of these derived variables will be presented below in the discussion of what the different variables are.

  1. Rating = Average rating of the labelled 5-point scale. The scale comprises two different underlying scale (feeling, action): 1= Not at all; 2=Nervous/Not Do; 3=Interested/Not Do; 4=Nervous/Do; 5=Interested/Do
  2. RTseconds – Response time in seconds, or in other words, how quickly the respondent makes his or her decision.
  3. R1NotAtAll, R2NervousNotDo, R3InterestedNotDo, R4 NervousDo, R5InterestedDo – the five rating scale points converted to binary.  That is, when the rating is R1, for example, then the newly created variable, R1NotAtAll, is converted to 100, and the remaining four binary variables (e.g., R2NervousNotDo) are all converted to 0.  In effect, only one of the five binary variables created from the one five-point scale can ever have the value 100. The remaining four binary variables created from that one five-point scale must have the value 0, at least for that vignette.
  4. Net Nervous = sum of both the two binary variables, R2NervousNotDo and R4NervousDo. This is a ‘netted’ variable. We look at the two responses which incorporated ‘nervous’ when either one is selected, we say that the respondent feels nervous We are not interested in whether the respondent will color hair, but only whether the respondent feels nervous.
  5. Net Do = the sum of two binary variables, R4NervousDo and R5NotNervousDo. The same logic applies. This time the newly created Net Do picks up the response of ‘Do’, whether the respondent feels nervous or not nervous.

Surface Analysis (Average Ratings) Comparing Groups

Table 2 presents the averages of these variables, by Total Panel, Gender, Age Group, Self-defined stage of hair coloring (from the third classification question), and finally the averages when the set of 24 vignettes was divided into four mutually exclusive, complementary groups of six vignettes each.

Table 2. Average ratings by groups of respondents, for the vignettes that they evaluated. The 5-point rating scale was divided into five distinct scale values (R1-R5). Four new variables were also created beyond those five, variables combining scale values of Nervous, of Interested, of No Do, and of Do, respectively. All averages of 40 or more are shown in shaded cells.

 Averages

5-Point RATING

RT SECONDS

R1 NOT AT ALL

R2 NERVOUS NOT DO

R3 INTERES NOT DO

R4 NERVOUS DO

R5 INTERESTED DO

NERVOUS (NET)

INTERESTED (NET)

NOT DO (NET)

DO (NET)

Total

3.3

3.8

16

11

22

28

23

39

45

33

51

Female

3.6

4.0

6

12

21

32

29

44

50

33

61

Male

3.0

3.6

26

9

24

24

16

33

40

33

41

A16–24

3.1

3.3

19

15

21

30

15

44

37

36

45

A25–44

3.6

3.5

6

10

26

32

25

43

51

37

57

A45–60

3.5

3.8

10

11

22

29

28

41

50

33

57

A61+

2.4

4.7

45

9

17

18

12

27

29

26

30

Coloring Now

3.9

4.1

3

9

19

34

36

43

54

28

69

Thinking of it

3.7

3.7

3

10

28

35

24

45

52

38

59

Not Interested

2.3

3.7

44

13

20

15

8

28

28

33

24

Vignettes 01–06

3.3

5.8

19

9

20

29

23

38

43

29

52

Vignettes 07–12

3.3

3.6

16

12

23

28

22

40

45

35

50

Vignettes 13–18

3.3

3.1

16

11

23

30

20

41

43

34

50

Vignettes 19–24

3.4

2.8

15

11

24

26

25

36

49

34

51

Arrays of data such as those in Table 2 five a sense of the overall feelings of the respondent groups, as well as uncovering any specific issues or patterns with repeating the study, such as the faster response times for vignettes beyond the first six, or increased level of interest (e.g., the net variable “INTERESTED” is low among the younger respondents (age 16–24), but also low, and surprisingly so, among the older respondents (age 61+.)

We see general patterns from the averages in Table 2, such as the surprisingly resilience of the average rating across the four sets of six vignettes. We also see averages which make sense, such as the lower value for the rating for those respondents not thinking of coloring their hair (average rating = 2.3) versus those respondents already coloring their hair (average rating = 3.9.)

Within Table 2 lie a great deal of so-called ‘insights,’ data organized in such a way as to provide an idea of how people respond to the idea of hair coloring. These data reflect the ‘bread and butter’ information provided by conventional market research. There is a sense of knowing something about people, the notion of ‘insight.’ The reality, however, remains that we know far less than we could know about the respondents than we could know. We know their average responses but cannot yet ‘get into their mind.’  It is that ‘getting into the mind’ to which we now turn in the next sections.

Recoding: Structuring the Mind Genomics Data for Subsequent Analyses

The essence of Mind Genomics is the relation between the response and the specific messages or ‘answers’ to the questions. Mind Genomics system forces decision, but at the same time mirrors reality, by embedding the necessary information in vignettes, wherein the features or answers ‘fight’ with each other. The second aspects of Mind Genomics is the recognition that, for the most part, people are often unaware of ‘why’ they do certain things of an everyday nature. That is, people react quickly, and do not think about what they are doing for much of their behavior. This ‘System 1’ according to Nobel Laureate Daniel Kahneman, is intuitive, ‘at the gut level.’ The research must mirror this quickness [24]. When asked ‘WHY,’ most people can give a reason, but in everyday life the judgments are so rapid that the person is operating on ‘automatic.’

The vignettes were constructed according to an underlying experimental design, complete for each person, but different from person to person in the specific combinations. Mind Genomics then works at the level of the individual respondent, who evaluates the precise but unique set of combinations need to build a model or equation for that person. The metaphor is the MRI, magnetic resonance image, used in medicine to take various snapshots of the individual’s tissue, such as brain, combine these by computer, and create the full 3-dimensional picture of the brain, from which one can detect abnormalities, and so forth.

Each respondent evaluated 24 unique vignettes, created by the design.  The result is a database comprising 24 vignette structures x 100 people (our respondents) or a rectangular matrix of 2400 rows, one row per respondent per vignette. In turn, the data begins with 18 columns, the first 16 columns corresponding to one column for each of the ‘elements’ or ‘answers’, our test stimuli, the 17th column for the rating and the 18th column for response time, RT.  An additional set of nine columns was then created, five columns for the five responses, RT1 to RT6, and four columns for the newly created “NET” variables (Net Nervous, Net Interested, Net Not Do, Net Do), respectively

The matrix is designed for regression analysis. The independent variables, A1 to D4, are coded to tell the regression program about the status of the elements. When the variable has the value ‘1’ the value denotes the fact that the vignette contained that element or answer. The remaining four independent variables cells in that row will have the value 0 to denote the fact that the vignette did not feature answer or element.

Moving over to the 17th column we see the actual assigned rating which is 1, 2, 3, 4 or 5, depending upon the value chosen. The 18th column shows the response time to one decimal point.

Moving beyond the 18th column we see nine newly created variables. The first five correspond to R1-R5, respectively. When a variable is selected by the respondent, e.g., R2, that newly created variable is assigned the value 100, and the remaining newly created variables (R1, R3, R4, and R5) are assigned the value 0. Finally, the four ‘NET” variables are created by the appropriate addition.

As a matter of course, we add a very small random number to each cell, so that the cell is not 0 or 100, but sum small number a bit larger than 0 or a bit large than 100, respectively. The rationale for adding the small random number is that it prevents the underlying regression program from crashing, were the respondent to never have used 5 or always to have used 5. In the latter situations, there would be no variation in the dependent variable, and in turn the regression analysis could not work. Adding the very small random number barely affects the parameters emerging from OLS (ordinary least-squares) regression model, but avoids the possible crash were the ratings to be all 0 or 100 at the start of the regression.

The data matrix has now been put into a format that the statistical analysis program can ‘process.’ It is an inconvenient but exceptionally widespread, virtually universal reality that much of the effort in the analysis of data to discover patterns is not so much the actual statistical processing, but rather the thinking about how to represent the data in a way that make the data amenable. The restructuring of the data for the regression analysis is as much part of the analysis as are the computations. Indeed, we may say that the up-front thinking IS the analysis, the rest, the computations, simply being the drone work, the busy work. By the time we conceptualize the system as a set of 1’s and 0’s we can be said to have analyzed the data, although not yet to have computed the parameters.

Relating the Key Evaluative Criterion (R5 Interested/Do) To the 16 Answers

We apply OLS (ordinary least-squares) regression to our data. There are research purists who will aver that OLS Regression is not the best approach with data which is ‘binary’ both in the independent variables (the 0/1 representation of the 16 answers as predictors), and dependent variable (0 if the rating is not 5, and 100 if the rating is 5.)  Author HRM has consistently use the OLS regression to make the results easy to understand as we see below.

For each dependent variable, and each group of respondents, the OLS regression makes one ‘pass’ through the data. Table 3 shows the results. The table begins with the title of the dependent variable, and the binary expansion.  The dependent variable is 5. The data come from the 2400 vignettes evaluated by the total panel. As noted above, the rating of 5 was converted to 100. The complementary ratings of 1–4 were converted to 0.

Table 3. Results from modeling the contribution of the 16 answers to the binary transformed rating of ‘Rating 5’ (Interested and will do.)

Dependent variable = binary expansion focusing on R5; INTERESTED and WILL DO

Total


Additive constant

25

A2

Coloring hair gives a person a chance to ‘change’ the look – for fun, temporarily

6

A1

Coloring hair hides the gray

5

D1

Treatment on hair should be done regularly

5

B4

Coloring makes hair beautiful

4

D3

It’s important to get hair cut properly

4

B2

It takes a little time to get accustomed to a new hair color

3

D4

Hair should be natural… cut when needed, nothing else

2

D2

Coloring hair should only be done every other haircut

1

A3

Coloring hair is trendy today

0

A4

Coloring hair lets the person ‘show off’

-1

B1

Coloring hair instills confidence

-1

B3

To prevent a feeling of insecurity, the coloring has to be ‘just right’

-2

C4

Hair dye damages nothing

-2

C2

Hair dye can damage hair

-11

C1

Hair dye can affect health

-12

C3

Hair dye can damage scalp

-13

The regression was done on the entire set of 2400 observations, the so-called ‘Total Panel.’ We proceed to the Additive Constant, which is the estimated percent of responses of exactly ‘5’ in the absence of any elements.  The additive constant is a purely estimated parameter, since all vignettes by design comprised 2–4 answers or elements.  Nonetheless, we compute the regression with the additive constant.

We treat the additive constant as a baseline, the measure of tendency to be interested in hair coloring and ready to color one’s hair without any additional information. In other words, we assume an underlying tendency to respond ‘Interested and Will Do’ for a given topic, just based upon the name of the topic, but without any other specifics. The OLS regression takes this tendency into account, showing it as the ‘additive constant.’  The additive constant for our study of 100 respondents and hair coloring achieves a value of  25 when the dependent variable is ‘R5,’ after R5 is converted into a binary value which takes on the value 0 (R5<>5) or takes on the value 100 (R5=5).

The low additive constant of 25 means in ‘technical talk’ that in only 25% of the time may we expect to see a rating of 5 in a vignette without elements. Respondents are simply not interested in the notion of hair coloring as a topic. They do color their hair, but they would not say ‘interested and will do’ as a basic matter of course. It is the elements, the answers, which must drive the response.

Table 3 also shows us that for the most part the coefficients are low, the highest coefficients achieved by A2 and A2 (changing the look; hiding the gray.)  These low coefficients should alert us to the possibility that either people are not particularly interested in the notion of hair coloring, even at the level of specifics, or more likely, there are different mind-sets which cancel each other.

The negatives push people away from the positive of interested/will do. We don’t know whether these are truly negative. They are simply non-positive. We simply know from our recoding that they are not positive, not 5. The negatives are the answers which talk about the issues and problems. We should not be surprised; the problems are the issues of dye, injuring hair, health, scalp, respectively.  Even saying that there is no damage is a negative, perhaps because no damage, no untoward accident, is not a positive.

Respondent Data Are Reliable – Evidence From Looking At The Starting Versus The Ending Test Vignettes

The criticism is often raised that respondents cannot actually do the task. Despite the emergence of clear patterns, there are purists who believe that the five-minute experiment with 24 vignettes is simply too fatiguing, and that what one sees is the analysis of rather meaningless data, assigned by respondents who are tired, bored, and angry.

To assess reliability, we divide the vignettes into those appearing in positions 1–6, 7–12, 13–18 and 19–24. We do not look at the respondents, but simply create four databases, and do the regression modeling for each of the four sets of position. We do so by OLS, ordinary least-squares regression, and force the equation through the origin by not having an additive constant, a slight departure from the OLS regression for the ratings, but one which allows us the ability to compare coefficients without the interference of the additive constant. OLS returns with estimates of the 16 coefficients. Figure 3 shows the scatterplot, the ordinate showing the coefficients emerging when we look only at the set of ratings obtained from responses to vignettes 19–24, the last six vignettes tested. The abscissa shows the coefficients emerging when we look only at the set of ratings obtained from responses to vignettes 01–06, the first six vignettes tested. They are quite similar, overall, albeit with some natural noise to destroy the otherwise very high correlation.

Mind Genomics-023 - AWHC Journal_F3

Figure 3. Scatterplot showing the 16 coefficients estimated from vignettes at the first part of the experiment (vignettes 01–06) versus the vignettes from the last part of the experiments (vignettes 19–24),  The 16 coefficients were estimated after the binary transformation of Rating 5 (interested/will do).

A parenthetical note is appropriate here: The negative reactions to the Mind Genomics effort is most often heard from professionals who participate in a study, only to return with a host of negatives ranging from ‘I didn’t know what I was doing, I just guessed’ to ‘The graphics are so 20th century, and fail to make the experience engaging, in turn failing to make the experience even valid.  The pattern of coefficients presented here refutes the accusations, almost always from professionals, almost never from ‘real people.’

Differences in the Performance of Elements among Complementary Subgroups

The poor showing of most elements or answers in Table 3, presenting the Total Panel’ may surprise the reader, since hair coloring is a very popular topic. The surprise only comes when we realize that for virtually everything, there are at least two or more points of view, stances when ‘human judge.’ Our quotidian existence is replete with aphorism driving home the individuality of judgment, the tacit recognition that people differ.  It’s not only the recognition that they exist but accepting and enshrining those differences as a mainstay of an enlightened point of view.

The dramatic nature of the group difference can be seen in Table 4. The table shows many more elements performing better, at least at the level of statistical significance. The elements show those elements which perform well in at least one group. The operational definition of ‘perform well’ is a coefficient greater than 7.51, which is both statistically significant and corresponds to elements which have been observed to represent ‘effective’ in the outside world of daily experience.  Table 4 suggests that looking at key subgroups increases the likelihood of at least one element performing strongly.

Table 4. Coefficients from the model for complementary subgroups. The dependent variable is the binary transformation of Rating5 (Interested / Will Do).

Gender

Age

Current status re hair coloring

Dependent variable = binary transformation of Rating R5
 (Interested, Will Do).

Male

Female

A16–24x

A25–44x

A45–60x

A61Plus

Coloring   Now

Thinking about it

Not Interested


CONSTANT

22

28

12

31

28

13

38

24

15

A1

Coloring hair hides the gray

3

8

4

3

7

7

7

8

1

A2

Coloring hair gives a person a chance to ‘change’ the look – for fun, temporarily

7

6

16

8

3

3

3

12

4

A3

Coloring hair is trendy today

0

1

10

3

-1

-5

-1

1

0

B2

It takes a little time to get accustomed to a new hair color

-1

7

-12

8

3

-2

3

5

1

C4

Hair dye damages nothing

-2

-3

8

-7

-2

1

-3

4

-8

D1

Treatment on hair should be done regularly

4

6

4

1

9

6

9

5

1

D2

Coloring hair should only be done every other haircut

1

2

9

1

1

0

3

-1

1

D3

It’s important to get hair cut properly

5

4

0

5

4

8

5

3

3

D4

Hair should be natural… cut when needed, nothing else

3

1

2

0

0

9

1

2

2

The data in Table 4 suggest that many of the elements simply ‘do not work.’ They only show a slight- increase in the coefficients. Two elements, however, performed well, with coefficients about 10 in at least one subgroup.

Coloring hair gives a person a chance to ‘change’ the look – for fun, temporarily

Coloring hair is trendy today

Creating Mind-Sets as a Way to Dive Deeply Into the Cosmetic Mind

Mind Genomics provides a tool by which one can create divisions, groups, among respondents based on how the people think, not who they are, not what they believe.  Traditional research with customers often labels this approach psychographic segmentation, in which one divides people by what they think (general attitudes; Wells, 2011 [25]) versus dividing people by WHO THEY ARE OR WHAT THEY DO.  The technique used is clustering, a well-established approach in statistics to explore data with the hope of finding groups of similar ‘objects’, similarity based upon the pattern of properties of those objects [26].

Mind Genomics carries psychographic segmentation one step further, beyond attitudes and beliefs, and into the response pattern to messages crafted to be specific for a topic, and thus precisely appropriate for that topic. A typical psychographic segmentation involving hair coloring would incorporate the entire gamut of cosmetics, and beauty-seeking behavior. The goal in Mind Genomics is to work at the very ‘micro-level,’ with language most closely associated with the topic. Thus, the data emerging from the clustering or segmentation may be said to be laser-focused on the topic of hair coloring, and perhaps even more focused on the reasons for coloring hair versus not coloring hair.  Discoveries from the clustering and segmentation are thus both limited but often extremely novel, often ready to turn into both scientific insights and business actions.

The clustering performed on the data for this study looked at the respondents based upon the coefficients emerging from the regression analysis, wherein the dependent variable is R5 (Interested / Will Do). Each respondent generated an individual model. The 16 coefficients were used as the basis for clustering the respondents twice, first into two mind-sets or clusters, second into three mind-sets or clusters.  The two-segment solution could not be interpreted. A cluster or mind-set comprised different elements which could not be the basis of a simple ‘description.’  In contrast, dividing the respondents into three clusters or segments made it simple to assign names. We simply looked at the elements which scored the highest in each cluster. Table 5 presents the three mind-sets.

Table 5. Three segments for hair coloring emerging from segmenting the respondents by the pattern of coefficients for R5, Interested/Do.

MS1

MS2

MS3

Dependent variable = binary transformation of Rating R5 (Interested, Will Do).

Follow prescription

Coloring is a  personal expression

Focus on self-care


Additive constant

27

21

25

Mind-Set 1 – Follow the prescriptions of others

D1

Treatment on hair should be done regularly

8

4

4

D4

Hair should be natural… cut when needed, nothing else

7

-3

2

Mind-Set 2 – Coloring is self-expression

A2

Coloring hair gives a person a chance to ‘change’ the look – for fun, temporarily

6

13

-1

A1

Coloring hair hides the gray

4

10

2

A3

Coloring hair is trendy today

-1

7

-6

Mind-Set 3 – Self Care

D3

It’s important to get hair cut properly

4

1

8

Does not strongly appeal to any mind-set

B4

Coloring makes hair beautiful

4

3

4

D2

Coloring hair should only be done every other haircut

2

0

3

B2

It takes a little time to get accustomed to a new hair color

6

2

1

A4

Coloring hair lets the person ‘show off’

-4

3

-3

C4

Hair dye damages nothing

-4

2

-3

B1

Coloring hair instills confidence

1

3

-5

B3

To prevent a feeling of insecurity, the coloring has to be ‘just right’

0

0

-6

C2

Hair dye can damage hair

-16

-5

-11

C1

Hair dye can affect health

-17

-5

-12

C3

Hair dye can damage scalp

-16

-4

-18

Finding Respondents in the Population – the PVI (Personal Viewpoint Identifier)

The premise of Mind Genomics is that the mind-sets exist but need not be correlated with WHO the respondents are, or even what, in general, the respondents BELIEVE. (see Table 6). Yet, these mind-sets have a very important role to play, both for knowledge and for application. When one works with these mind-sets, it becomes possible to explore more deeply the roots and foundations, if any, undergirding one’s membership in a mind-set.

Table 6. Cross tabulation of mind-set membership by self-profiled group membership. Numbers in the body of the table represent numbers of respondents out of the total group of 100 respondents.


MS1 – Follow prescription

MS2   – Coloring a personal expression

MS3 – Focus on self-care

Total

Total

37

33

30

100

Mind-Sets by Gender

Male

16

14

20

50

Female

21

19

10

50

Mind-Sets by Age

A16–24

4

2

4

10

A25–39

15

10

8

33

A40–55

9

11

11

31

A56+

9

10

7

26

Mind-Sets by Hair coloring behavior

Coloring Now

10

15

7

32

Thinking About It

14

9

12

35

Not Interested

5

7

11

23

No Answer

8

2

0

10

If, as continuing research suggests, there are no general co-variations of membership in a mind-set, especially age and gender, as well perhaps in one’s behavior in the category (question 3), then the next thing is to create a tool by which to assign new people to one of three mind-sets. Author Gere has created the PVI, the personal viewpoint identifier, using as a base the pattern of responses to different and jet differentiating   questions.  Figure 4 shows the six questions constituting the PVI. The pattern of answers to the six questions are used to assign a new person to one of the three mindsets, with the feedback shown in Figure 5.

Mind Genomics-023 - AWHC Journal_F4

Figure 4. The PVI (personal viewpoint identifier) created from the hair coloring study to assign new people to one of the three mind-sets.

Mind Genomics-023 - AWHC Journal_F5

Figure 5. Feedback screens from the PVI. The feedback can go to the respondent, the hair salon, or to guide the messaging by merchants who advertise, either at point of sale in stores or on the Internet in e-commerce.

The PVI as shown in Figures 4 and 5 enable the use of the knowledge for either business applications or for continuing social research. One need only deploy the PVI at a salon or on the web, in order to understand the mind of the person, and relate mind-set membership for hair coloring to different forms of knowledge such as WHO and WHAT the person is an does, in the three mind-sets. Or the researcher can move more deeply into understanding how mind-set covaries with shopping behaviors.

At the level of application, one need only realize the business power of knowing the mind-set of a person with respect to hair coloring. Such knowledge, perhaps obtained quickly on the internet or in person, can be used to drive marketing efforts.  The PVI enables the sales messages to be those which are similar in content and tonality to the messages which would appeal to the mind-set to which the prospective customer appears to belong.

Response Time

Our final topic concerns the deconstruction of the messages into those which engage, based upon long response times, versus those messages which do not appear to engage, based upon short response time.  It is important to note that response time IS NOT ACCEPTANCE. Rather, response time is an empirical measure of the expected number of seconds (to the nearest tenth) that one appears to ‘read’ and thus process the element.

It is impossible to measure the response time to the individual answers, but it is very straightforward to measure the response time to the vignette and then use OLS regression to deconstruct the response time into the contribution of the individual elements or answers. The regression model is simple, similar to the model used for R5, except that the dependent variable is the response time, and the model has no additive constant. That is, the ingoing assumption is that in the absence of phrases, no one reads, and therefore there is no processing time.

Tables 7A and 7B show the estimated response times to the different elements or answers, this time by total panel, by gender, age, thoughts about coloring hair, mind-sets, and finally starting versus ending vignettes. To make the table easier to read, those response times of 1.5 seconds or longer are shown in shade and in bold face.   One can look across the table or downward, looking across a person, to discover what engages the respondent.

Mind Genomics works with ‘cognitively meaningful’ stimuli. That is, the elements have real meaning in the world, and thus our analysis to find a strong performer and interpret why, is made much easier. We are struck with a few observations, mainly qualitative ones when we look at the patterns of shaded cells, the intersection of an element or answer (row) and a subgroup (column),

  1. We begin with the fact that the nature of the information is the same, messages about hair color. The information differs both in the morphology (length of the answer in words and letters), and in meaning (what the answer conveys.)
  2. There appears to be a greater similarity of response times within a column (same group), rather than within a row (same answer or message.)  This is a qualitative observation only.  The implication for subsequent research is that the response time may be hinting at differences in the way people process nature.
  3. Some questions, such as Question A ‘Why do you color your hair?’ show relatively short response times associated with their answers.  In contrast, other questions, such as Question D ‘What do you find more beneficial; coloring, treatment or cutting?’ show long response times associated with their answers. The differences, again, are qualitative, and should be considered against the background of dramatic variation both in the response times of different groups, and the response times to different answers.

Discussion and Conclusion

Relevance of Mind Genomics Knowledge to Understanding People in Society:  The experiment on attitudes or mind-sets about hair coloring suggests that science need not be relegated to large-scale studies, the norm today in the hard sciences, but increasingly so in the psychological and social sciences. Today’s attitudes towards science stress the deadly combination of doing research in an acceptable way to the academic community, often picking topics to validate or disprove small points in a larger theory,  while working with surveys which fail to give a sense of the immediacy of the experience.

By couching the test stimuli in the language of the everyday, by making studies possible with as few as 50 respondents, and by allowing a research project to take perhaps no more than a few hours, Mind Genomics presents the scientific and business community with a new tool, one to understand people in society. One may think of Mind Genomics as a combination of quantitative ethnography (albeit ethnography of the mind’s interaction with the world), and a Technical Aid to Creative Thought, a term coined by Harvard computer professor, Anthony Gervin Oettinger, more than 55 years ago,

Applications of the Mind-Sets: Once the mind-sets are revealed, the reactions are quite predictable. The first reaction is a delighted wonderment. The reaction cannot be controlled nor suppressed, at least for long. There is an innate, almost child-like delight in the discovery of something new.  The second reaction, however, is perplexity. The individual or group of individuals encountering the mind-sets for the first time begins to wonder ‘what do we do with this information.’ The mind-sets are too compelling to be ignored in the way many other ‘factoids’ emerging from an experiment are ignored.

Table 7A. Response time as a function of element, showing complementary subgroups of WHO respondents ARE.

Gender

Age

Response Time – Total panel and ages

Total

Male

Female

A16–24

A25–44x

A55–60x

A61+

Question A: Why do you color your hair?

A1

Coloring hair hides the gray

0.6

0.8

0.4

0.7

0.3

0.6

1.3

A2

Coloring hair gives a person a chance to ‘change’ the look – for fun, temporarily

0.8

0.7

0.9

0.3

0.6

1.1

1.0

A3

Coloring hair is trendy today

0.7

0.7

0.6

-0.2

0.4

0.8

1.1

A4

Coloring hair lets the person ‘show off’

1.2

1.2

1.1

1.3

1.1

1.2

1.4

Question B: How do you feel when you change the color?

B1

Coloring hair instills confidence

1.1

1.0

1.2

2.0

1.1

1.1

0.8

B2

It takes a little time to get accustomed to a new hair color

1.4

1.4

1.3

1.2

1.2

1.6

1.2

B3

To prevent a feeling of insecurity, the coloring has to be ‘just right’

1.5

1.4

1.6

1.7

1.1

1.7

1.9

B4

Coloring makes hair beautiful

1.2

1.3

1.1

2.1

1.0

1.4

1.2

Question C: Do you think the color damages your health, your scalp, or your hair?

C1

Hair dye can affect health

1.1

1.0

1.3

1.7

1.1

0.9

1.2

C2

Hair dye can damage hair

1.2

0.9

1.5

1.5

1.4

0.9

1.3

C3

Hair dye can damage scalp

1.1

0.9

1.3

1.5

1.0

1.0

1.3

C4

Hair dye damages nothing

1.1

1.0

1.2

1.4

0.9

1.1

1.3

Question D: What do you find more beneficial:  coloring, treatment or cutting?

D1

Treatment on hair should be done regularly

1.0

1.0

1.0

-0.1

1.1

1.0

1.4

D2

Coloring hair should only be done every other haircut

1.1

1.0

1.3

-0.7

1.1

1.4

1.5

D3

It’s important to get hair cut properly

1.2

1.1

1.4

0.7

1.3

1.1

1.6

D4

Hair should be natural… cut when needed, nothing else

1.5

1.4

1.6

0.4

1.9

1.0

2.2

The applications of the mind-sets range from understanding to sales, from science to application. The key to application is recognizing that people are different in the way they think about the same topic, knowing the specific ways that they think for a topic (the mind-set segmentation), and then having a tool to assign a new person to a mind-sets (the above-mentioned PVI, personal viewpoint identifier.)

The applications abound:

  1. Specific knowledge:  create an entire science of a topic of the everyday (e.g., the science of the beauty experience),
  2. Co-variation of mind-sets with external behaviors: understand the nature of how people in different mind-sets of the same topic behave in their actual choices,
  3. Persuade: Assign a new person (sales prospect) to a mind-type in a short interaction, and presenting that person with the appropriate sales material

Prospects for databases and understanding interactions between WHO, WHAT, and the Mind

The ability to create a database about a specific topic with as few as 50–100 respondents, and then create the PVI (personal viewpoint identifier) means that it becomes possible to profoundly understand a small and clearly defined topic of experience, and then expand that topic through the PVI. The analogy is inexpensively created color science, and a colorimeter to measure the color for millions upon millions of objects.

The same thinking can be applied to Mind Genomics. We can take the topic of beauty care, divide it into 20 or even more topics, dimensionalize each topic (four questions, four answers per question), and run the study with 100 people. The emergent mind-sets can then be captured for new people using the PVI. With 20 studies, we have a grand PVI of 20 topics, each topic comprising 6 questions. It is only a matter of motivating a respondent to participate, answering the 120-question PVI, perhaps over a period of two or three sessions. The data, along with the respondents’ age, gender, and other details of a standard self-profiling questionnaire, provides the necessary information to ‘mind-type’ the world.

The analysis then proceeds in a very simple fashion. The PVI exercise has generated the profile of a person’s mind with respect to beauty care. We need only relate the ‘sequenced profile’ of a person’s 20 mind-sets in beauty care to other measures of the person, whether these be WHO the person is, or WHAT the person does.

Table 7B. Response time as a function of element, showing complementary subgroups what the respondents think about hair coloring, different mind-sets, and a comparison response time at the start of the experiment (vignettes 1–6) and at the end of the experiment (vignettes 19–24).

Q3: Coloring hair behavior

Mind-Sets

Order of testing

Coloring my hair now

Thinking about it

Not interested

 Follow the prescriptions
of others

Coloring –
 A personal expression

Focus on self-care

 Vignettes 01–06

Vignettes 19–24

Question A: Why do you color your hair?

A1

Coloring hair hides the gray

0.2

0.7

0.9

0.5

0.7

0.7

1.0

0.3

A2

Coloring hair gives a person a chance to ‘change’ the look – for fun, temporarily

1.2

0.9

0.5

1.1

0.8

0.6

1.3

0.6

A3

Coloring hair is trendy today

0.8

0.6

0.5

0.6

0.7

0.7

1.4

0.4

A4

Coloring hair lets the person ‘show off’

1.4

1.3

0.9

1.1

1.3

1.2

2.3

0.9

Question B: How do you feel when you change the color?

B1

Coloring hair instills confidence

1.1

1.2

0.9

1.3

1.0

1.0

1.5

1.0

B2

It takes a little time to get accustomed to a new hair color

1.4

1.1

1.6

1.6

1.3

1.1

2.3

1.2

B3

To prevent a feeling of insecurity, the coloring has to be ‘just right’

1.8

1.1

1.6

1.6

1.5

1.3

2.0

1.2

B4

Coloring makes hair beautiful

1.2

1.0

1.4

1.4

1.2

1.0

1.9

1.0

Question C: Do you think the color damages your health, your scalp, or your hair?

C1

Hair dye can affect health

1.4

1.0

1.0

1.4

1.0

1.0

1.8

0.8

C2

Hair dye can damage hair

1.3

1.3

1.0

1.4

1.3

0.9

2.0

0.6

C3

Hair dye can damage scalp

1.2

1.2

0.9

1.2

1.3

0.7

1.8

0.0

C4

Hair dye damages nothing

1.3

0.8

1.1

1.2

1.1

1.0

1.5

1.1

Question D: What do you find more beneficial coloring, treatment or cutting?

D1

Treatment on hair should be done regularly

1.0

0.9

1.1

0.9

0.9

1.2

0.8

1.2

D2

Coloring hair should only be done every other haircut

1.3

1.1

1.0

1.2

0.8

1.3

1.4

0.9

D3

It’s important to get hair cut properly

1.3

1.2

1.3

1.1

1.1

1.6

1.6

1.0

D4

Hair should be natural… cut when needed, nothing else

1.3

1.8

1.3

1.9

0.7

1.8

2.1

1.0

Acknowledgement

Attila Gere thanks the support of Premium Postdoctoral Research Program of the Hungarian Academy of Sciences.

References

  1. Trueb RM (2005) Understanding Hair Biology European Hair Research Society, 11th Meeting, Zurich, July 2005: Abstracts and Selected Reviews.
  2. Bloch PH (1993) Involvement with adornment as leisure behavior: an exploratory study. Journal of Leisure Research 25: 245–262.
  3. Cash TF (1987) The psychology of cosmetics: A review of the scientific literature.  Social and Behavioral Sciences Documents 17: MS No2800.
  4. Graham JA, Jouhar AJ (1981) The effects of cosmetics on person perception. International Journal of Cosmetic Science 3: 199–210.
  5. Moore L (2005) The Personal Beauty Care Market Outlook: NPD and Consumer Trends in Haircare and Skincare. Business Insights.
  6. Zhao X (2014) Salon hair coloring in the United States: A consumer perceived value analysis of Gen Y consumers. International Journal of Arts and Commerce 3: 105–115.
  7. Mitchell VW (2003) Generation Y female consumer decision-making styles. International Journal of Retail & Distribution Management 31: 95–106.
  8. Souiden N, Diagne M (2009) Canadian and French men’s consumption of cosmetics: a comparison of their attitudes and motivations. Journal of Consumer Marketing 26: 97 – 109.
  9. Datamonitor (2004) Haircare in the United States. Datamonitor USA, Reference Code: 0072–2242 Retrieved September 2, 2005 from http://www.datamonitor.com
  10. Euromonitor (2014) The Divergent Worlds of Hair Care: Global Strategies for Growth Euromonitor. Passport February, Retrieved April 16, 2014 from http://www.euromonitor.com
  11. Euromonitor (2005) The World Market for Cosmetics and Toiletries. Euromonitor International Retrieved October 1, 2005 from http://libproxy.uncg.edu:2798/Reports.aspx Euromonitor
  12. Euromonitor (2013a) Rethinking Beauty: Exploring New Growth Models Euromonitor Passport October, Retrieved May 12th, 2014 from http://www.euromonitor.com
  13. Euromonitor (2013b) Hair Care in China. Euromonitor Passport April, Retrieved May 12th, 2014 from http://www.euromonitor.com Euromonitor (2013c) Hair Care in the US Euromonitor Retrieved May 12th, 2014 from http://www.euromonitor.com
  14. Bloch PH, Richins ML (1992) You look “Marvelous”: the pursuit of beauty and the marketing concept Psychology and Marketing 9: 3–15.
  15. Boring EG (1929) A history of experimental psychology Prentice-Hall.
  16. Box GE, Hunter WG, Hunter JS (1978) Statistics for experimenters, New York, John Wiley
  17. Luce RD, Tukey JW (1964) Simultaneous conjoint measurement: A new type of fundamental measurement. Journal of mathematical psychology 1: 1–27.
  18. Green PE, Srinivasan V (1990) Conjoint analysis in marketing: new developments with implications for research and practice. The journal of marketing 54: 3–19.
  19. Moskowitz HR (2012) ‘Mind genomics’: The experimental inductive science of the ordinary, and its application to aspects of food and feeding. Physiology & Behavior 107: 606–613.
  20. Moskowitz HR and Gofman A (2007) Selling blue elephants: How to make great products that people want before they even know they want them. Pearson Education.
  21. Moskowitz HR, Gofman A, Beckley J and Ashman H (2006) Founding a new science: Mind genomics. Journal of sensory studies 21: 266–307.
  22. Moskowitz HR, Gofman A, Itty B, Katz R, Manchaiah M, Ma Z (2001) Rapid, inexpensive, actionable concept generation and optimization: the use and promise of self-authoring conjoint analysis for the food service industry. Food Service Technology 1: 149–167.
  23. Gofman A, Moskowitz H (2010) Isomorphic permuted experimental designs and their application in conjoint analysis. Journal of Sensory Studies 25: 127–145.
  24. Kahneman D, Egan P (2011) Thinking, fast and slow. New York: Farrar, Straus and Giroux.
  25. Wells WD (2011) Life style and Psychographics, Chapter 13: Life Style and Psychographics: Definitions, Uses, and Problems. Marketing Classics Press.
  26. Dubes R, Jain AK (1980) Clustering methodologies in exploratory data analysis. Advances in Computers 19: 113–238.