Author Archives: dev

High Energy CdZnTe 3D-Detectors for Spectroscopy and Polarimetry

Introduction

The semiconductor detectors technology has dramatically changed the broad field of X- and γ-rays spectroscopy and imaging. Semiconductor detectors, originally developed for particle physics applications, are now widely used for X/γ-rays spectroscopy and imaging in a large variety of fields, among which for example, X-ray fluorescence, γ-ray monitoring and localisation, non-invasive inspection and analysis, high energy astronomy, and diagnostic medicine. The success of semiconductor detectors is due to several unique characteristics as the excellent energy resolution, the high detection efficiency and the possibility of development of compact and highly segmented detection systems. Among the semiconductors device, silicon (Si) detectors are the key detectors in the soft X-ray band (<15 keV). Si-PIN diode detectors and silicon drift detectors (SDDs) [1], operated with moderate cooling by means of small Peltier cells, show excellent spectroscopic performance and good detection efficiency below 15 keV. On the other side germanium (Ge) detectors are unsurpassed for high resolution spectroscopy in the hard X-ray energy band (>15 keV) and will continue to be the first choice for laboratory-based high performance spectrometers [2].

However, in the last decades, there has been an increasing demand for the development of room temperature detectors with compact structure having the portability and convenience of a scintillator but with a significant improvement in energy resolution and/or spatial resolution. To fulfill these requirements, numerous high-Z and wide band gap compound semiconductors have been exploited [3,4]. In fact, as demonstrated by the impressive increase in the scientific literature and technological development around the world, cadmium telluride (CdTe) and cadmium zinc telluride (CdZnTe or simply CZT) based device are today dominating the room temperature semiconductor applications scenario, being widely used for the development of X/γ-ray instrumentations [5,6].

In this paper we will focus on a particular type of detectors based on sensitive elements of CZT namely, spectrometers with spatial resolution in three dimensions. These, in fact, represent the new frontiers for applications in different fields that require increasing performance such as high energy astrophysics, the environmental radiation monitoring, medical diagnostics with PET and inspections for homeland security. The advantages offered by the possibility to reconstruct both the position of interaction of the incident photons in three dimensions (3D) and the energy deposited by each interaction are of fundamental importance for applications that require a high detection efficiency even at high energies (> 100 keV), i.e. in the Compton scattering regime, as well as a wide-field localization of the direction of incidence and a uniform spectroscopic response throughout the sensitive volume. In fact the possibility to reconstruct the photon interaction position in 3D will allow to correct from signal variations due charge trapping and material non uniformity and therefore allow to increase the sensitive volume of each detector unit without degrading the spectroscopic performance.

Principles of Operation

The typical operation of semiconductor detectors is based on collection of the charges, created by photon interactions, through the application of an external electric field. The choice of the proper semiconductor material for a radiation detector is mainly influenced by the energy range of interest. Among the various interaction mechanisms of X-rays and gamma rays with matter, three effects play an important role in radiation measurements: photoelectric absorption, Compton scattering and pair production. In photoelectric absorption the photon transfers all its energy to an atomic electron, while a photon interacting through Compton process transfers only a fraction of its energy to an outer electron, producing a hot electron and a degraded photon; in pair production a photon with energy above a threshold energy of 1.02 MeV interacts within the Coulomb field of the nucleus producing an electron and positron pair. Neglecting the escape of characteristic X-rays from the detector volume (the so called fluorescent lines), only the photoelectric effect results in the total absorption of the incident energy and thus gives useful information about the photon energy. The interaction cross sections are highly dependent on the atomic number. In photoelectric absorption it varies as Z4,5, Z for Compton scattering and Z2 for pair production.

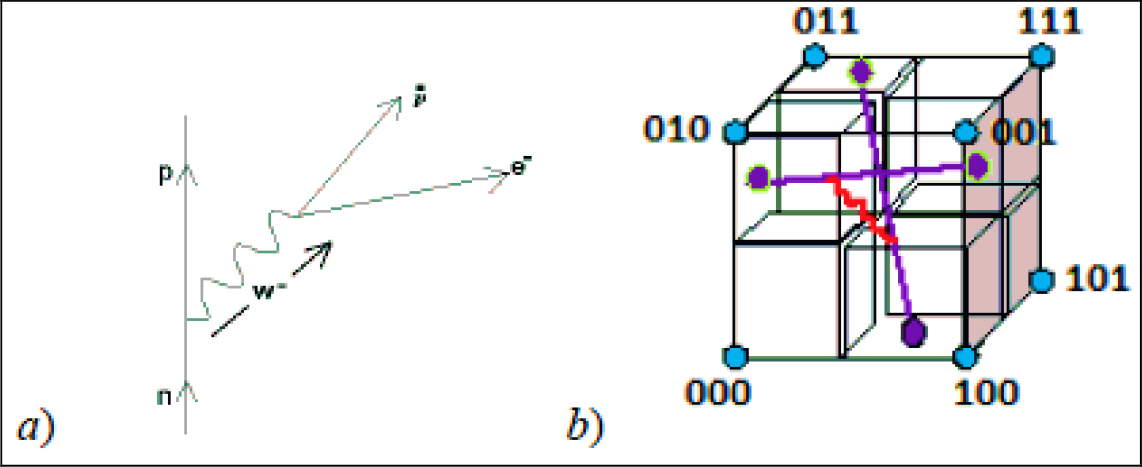
Semiconductor detectors for X-ray and γ ray spectroscopy behaves as solid-state ionization chambers operated in pulse mode. The simplest configuration is a planar detector i.e. a slab of a semiconductor material with metal electrodes on the opposite faces of the semiconductor (Figure 1). Photon interactions produce electron-hole pairs in the semiconductor volume through the discussed interactions. The interaction is a two-step process where the electrons created in the photoelectric or Compton process lose their energy through electron-hole ionization. The most important feature of the photoelectric absorption is that the number of electron-hole pairs is proportional to the photon energy. If E is the incident photon energy, the number of electron-hole pairs N is equal to E/w, where w is the average pair creation energy. The generated charge cloud is Q0 = eE/w. The electrons and holes move toward the opposite electrodes, anode and cathode for electrons and holes, respectively (Figure 1).

NAMS 2019-109 - Stefano del sordo Spain_F1

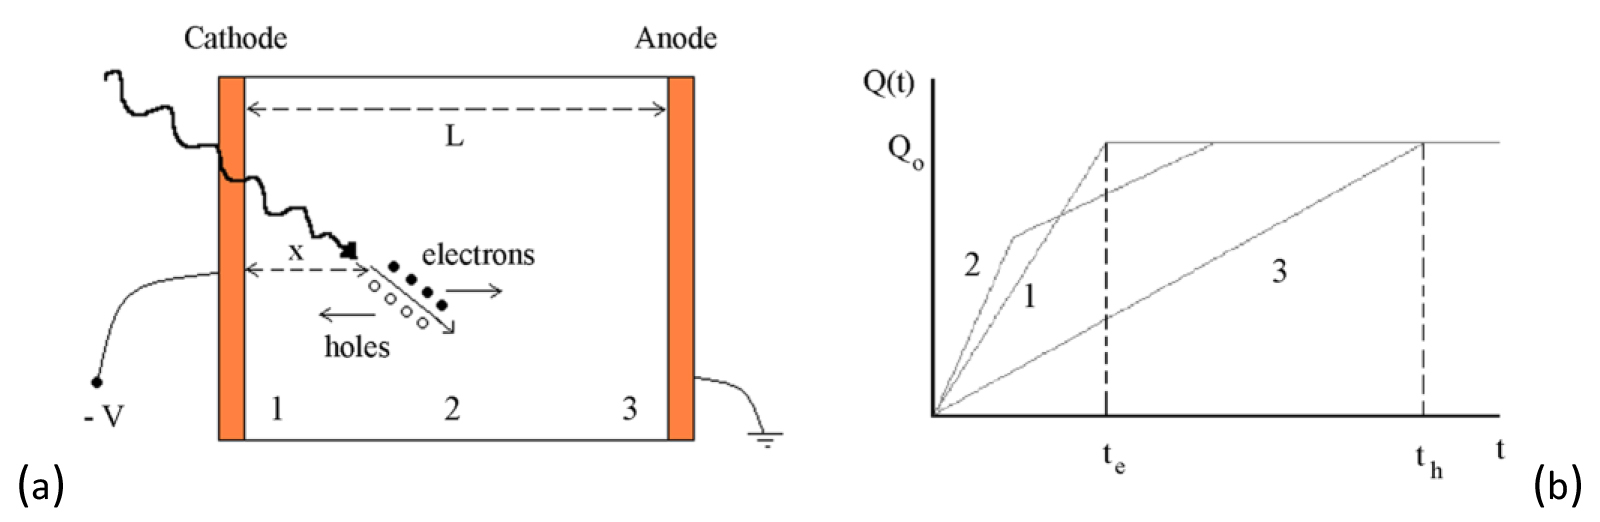
Figure 1. Planar configuration of a semiconductor detector: (a). Electron–hole pairs, generated by radiation, are swept towards the appropriate electrode by the electric field; (b) the time dependence of the induced charge for three different interaction sites in the detector (positions 1, 2 and 3). The fast rising part is due to the electron component, while the slower component is due to the holes

The movement of the electrons and holes, causes variation ΔQ of induced charge on the electrodes and it is possible to calculate the induced charge ΔQ by the Shockley–Ramo theorem [7]. The charge collection efficiency is a crucial property of a radiation detector and affects the spectroscopic performances and in particular the energy resolution. High charge collection efficiency ensures good energy resolution which also depends by the statistics of the charge generation and by the noise of the readout electronics. Therefore, the energy resolution (FWHM) of a radiation detector is mainly influenced by three contributes:

NAMS 2019-109 - Stefano del sordo Spain_F4

The first contribution is the Fano noise due to the statistics of the charge carrier generation. In semiconductors, the Fano factor F is much smaller than unity (0.06–0.14) [8]. The second contribute is the electronic noise which is generally measured directly using a precision pulser, while the third term takes into account the contribution of the charge collection process. Different semi-empirical relations have been proposed for the charge collection contribution evaluation of different detectors [9]. (Figure 2) shows a typical spectroscopic system based on a simple semiconductor detector. The detector signals are amplified by a charge sensitive preamplifier (CSP) and then shaped by a linear amplifier (shaping amplifier). Energy spectra are obtained by a multichannel analyzer (MCA) which samples and records the shaped signals.

NAMS 2019-109 - Stefano del sordo Spain_F2

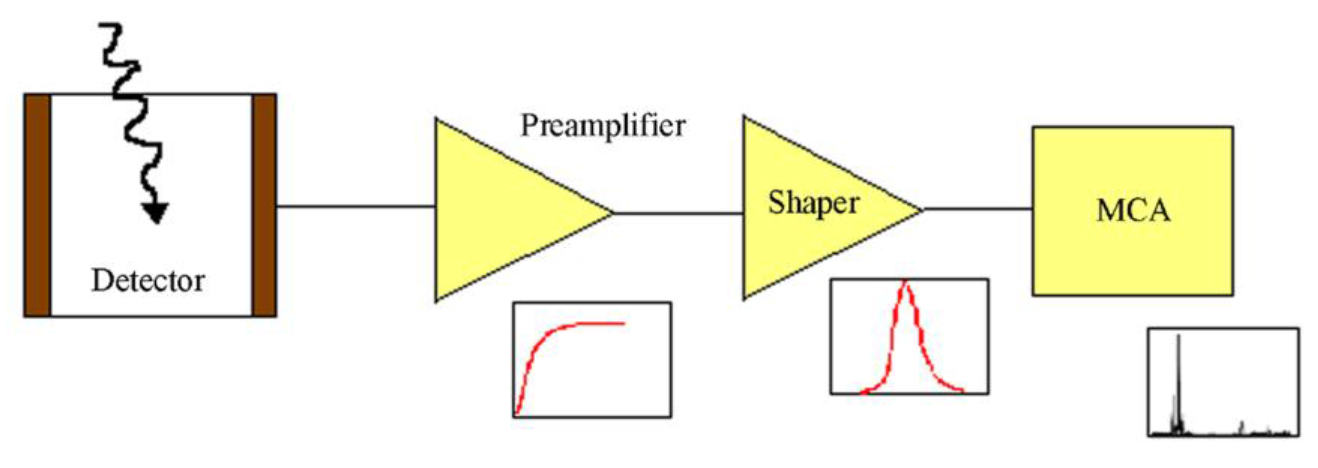
Figure 2. Block diagram of a standard spectroscopic detection system for X- and γ-rays.

3D CZT Sensor Configurations and Developments

One of the most recent development in this field regards the so called three dimensional (3D) detectors. A 3D spectrometer is, in principle, a detector divided into volume elements (voxels), each operating as an independent spectroscopic sensor. The signal produced in each voxel by the interaction of an incoming X/γ photon must be able to be is read and converted into a voltage signal proportional to the energy released. If the readout electronics of the detection system implements a coincidence logic, it will be possible to determine to some extent the history of the incident photon inside the sensitive volume by associating the energy deposits in more voxels to the same incident photon. The need for this type of sensors comes from the applications requirements. For example, in the field of hard X- and soft γ-rays astrophysics (10–1000 keV), there are promising developments of new focusing optics operating for up to several hundreds of keV, through the use of broadband Laue lenses [10] and new generation of multilayer mirrors [11]. These systems make it possible to push the sensitivity of a new generation of innovative high energy space telescopes at levels far higher (100–1000 times) than current instrumentation. To obtain the maximum return from this type of optics up to MeV, then you it is required the use of focal plane detectors with high efficiency (> 80%) even at higher energies and with that shall have also the ability to measure the energy spectrum with good spectroscopic resolution and also to localize accurately (0.1–1 mm) the point of interaction of the photons used for the correct attribution of their direction of origin in the sky.

In fact the realization of 3D spectrometers by a mosaic of single CZT crystals is not as easy as for the case of bi-dimensional imagers, mainly because to the small dimension of each sensitive unit necessary to guarantee the required spatial resolution and also for the intrinsic difficulty of packaging in 3D sensor units in which each one requires an independent spectroscopic readout electronics chain. A solution is offered by the realization of stack of 2D spectroscopic imagers [12, 13]. This configuration, is very appealing for large area detector, but has several drawbacks for application requiring fine spatial resolution in three-dimension and compactness. Indeed the distance between each 2D layer of the stack limits the accuracy and the sampling of the third spatial coordinate as well as passive materials are normally required for mechanical support.

To solve this kind of problems, in the last 10–15 years, there have been several groups that have focused their activity on the development of sensors based on high volume (1–10 cm3) crystals of CZT/CdTe capable of intrinsically operating as 3D spectrometers and therefore able to meet the requirements for certain applications, or to make more efficient and easy the realization of 3D detectors based on matrices of these basic units. The main benefits are: a limited number of required readout channels to achieve the same spatial resolution, packing optimization and a reduction of passive material between sensitive volumes. In these developments, a key role is played by the adopted electrode configurations. Various electrode configurations have been proposed and studied to improve both the spectroscopic performance and the uniformity of the response of CZT detectors compensating and correcting problems related to trapping and low mobility of the charge carriers in these materials. In fact, these electrode configurations, with the implementation of appropriate logical reading of the signals, makes it intrinsically able to determine the position of interaction of the photon in the direction of the collected charge (depth sensing) and therefore are particularly suited to the realization of 3D monolithic spectrometers without requiring a drastic increase of the electronics readout chains. In the framework of a project recently funded by the Italian Space Agency we are working on the development of a 3D CZT prototype for astrophysical applications and, in particular, on the realization of an advanced front-end electronics based on the RENA3 ASIC suitable for a flexible qualification and characterization of several CZT crystal samples. Here we report some detail about the development of this electronics.

Electronic chain for selection and qualification of 3D CZT detectors

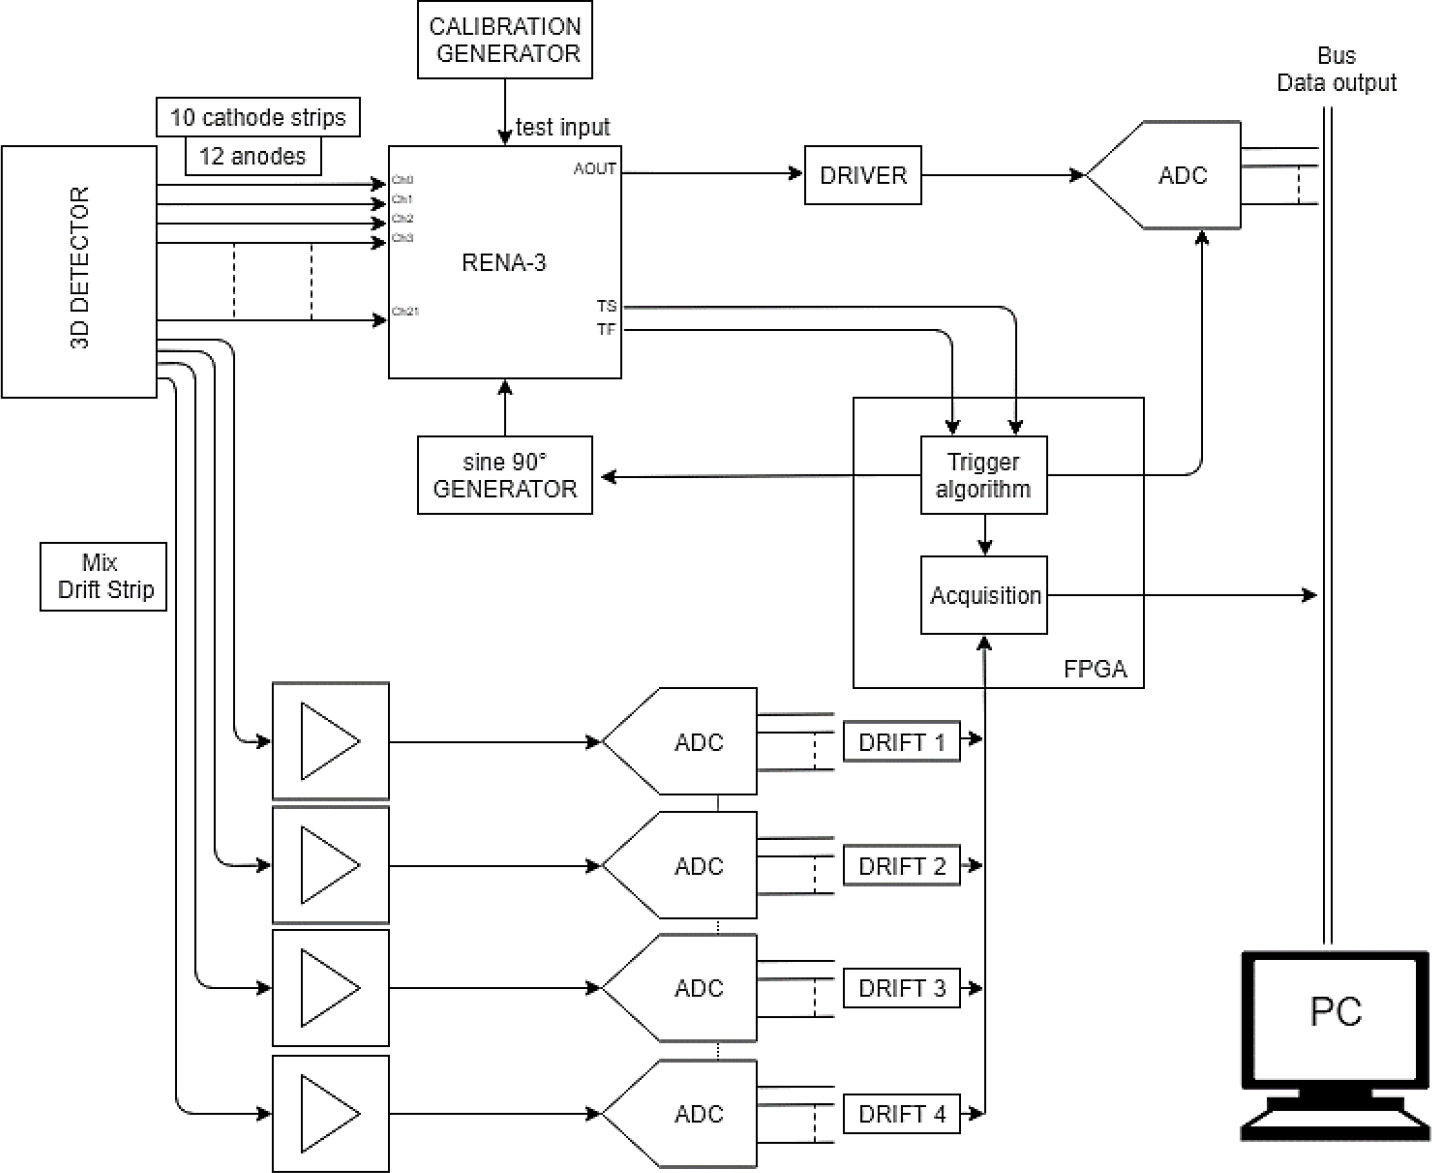
The processing of the signals provided by a 3D CZT detector required to obtain an imaging-spectroscopy device needs sophisticated electronics. The detector treated here, for example, is biased so as to provide the signals through three different types of electrodes: anodes, cathodes and drift strips. For this reason the front-end electronics has to be able to process signals of both polarities, positive and negative, in the case of cathodes and anodes, and of a polarity unknown in the case of the drift strip. The main function of the analogue front-end electronics (AFEE) is to connect the 12 anode strips and the 10 cathodes to a RENA-3 ASIC from NOVA R&D Inc. (CA, USA) used as signal readout device (RENA-3TM IC User Specifications Rev 1.31, May 11, 2015). The RENA-3 ASIC is a 36- channel charge sensitive amplifier self-triggering. Each channel includes a low-noise preamplifier, a shaper with sample/hold, and in addition a fast shaper that gives a trigger signal for coincident event detection. The signal range is selectable channel by channel over two full scales (equivalent to 200 keV and 1.3 MeV for CZT) as the peaking time that ranges from 0.1 to 40 μs. The comparator thresholds can be adjusted through an 8 bit DAC on each channel in order to obtain an accurate and uniform threshold setting. A pole-zero cancellation circuit is available for minimizing pileup errors. All these features are selectable by software and are independent for each input channel.

A very important feature for our purposes is the presence of two trigger chains, a “slow” and a “fast”, each of which has programmable thresholds, independent of each other and configurable channel by channel. Through the slow trigger chain and the associated digital register, it is possible to know which channels produced a trigger, or in other words which channels were affected by an event with energy higher than set threshold. This information allows to digitally convert only the triggered channels (sparse MODE), thus contributing to the decrease of the total acquisition time and then of the dead time. In any case, there is always the possibility to digitally convert all 36 channels, independently by the trigger condition and consequently increasing the system dead time. The slow trigger signal starts the acquisition phase sampling and holding, of the 10 cathodes and the 12 anodes signals. The acquired signals are then digitized by an external ADC, managed by an FPGA, which converts one channel at a time given the presence of a single output. Peak detector, present in each channel, allows to keep the maximum value of the signal for a necessary time to be able to convert all channels by the single external ADC. The fast trigger chain allows the time-stamp implementation within each individual channel and the generation of the system trigger. The time-stamp function is obtained through two cells that sample and hold the amplitude of two quadrature sinusoids when channel fast trigger occurs. The acquired sinusoids values are extracted and digitized using the same acquisition procedure. From the knowledge of these values it possible univocally determine to the timing informations within a period of the two sinusoids. Therefore, with this technique it is possible to establish the time interval between an event detected by two different portions of the detector belonging to two different channels of the RENA3.

Moreover, in our system the fast trigger is sent to an FPGA, in which it runs an algorithm with configurable parameters, that triggers the acquisition of the signal produced by the drift strips. The digitized data related to signal and time intervals are transferred from the FPGA to the PC, in which a software allows to calculate the energy collected by each electrode and relate it to the events recorded by the drift strips and taking into account temporal coincidences.

The block diagram of the system is shown in the figure:

NAMS 2019-109 - Stefano del sordo Spain_F3

Several analysis and characterization systems are being developed to study 3D-CZT detectors, that use fast ADCs and algorithms that run on FPGA, aimed at reducing the large amount of data produced by sampling. These systems have the advantage of providing to the user all the informations of each single event. On other hand the “firmware” algorithms, involved to reduce the big amount of data, are hard to optimize. Furthermore, fast components and high-performance algorithms running on FPGA, required more power than an acquisition system based on peak detector.

We are realizing a system that does not want to achieve performance of fast sampling or the processing of digital data in real-time, but wants to reach a good compromise between performance, space and power consumption requirement so that it can be well exploited in space applications.

Considerations on 3D CZT Spectrometers Applications

The development of CZT spectrometers with high 3D spatial resolution and fine spectroscopy represent a real challenge to the realization of a new class of high performance instruments able to fulfil the current e future requirements in several applications fields. The possibility to achieve also a very good detection efficiency, even at high energy (up to few MeV) [14], because of the sensitive volumes that can be obtained also by mosaic or stack of 3D sensor unit, without losing significantly their spectroscopic performance and response uniformity, together with their capability to operate at room temperature, are really appealing for application as radiation monitoring and identification [7] and homeland security as well as in industrial non-invasive controls and, in the research field, for new hard X- and soft γ-ray astronomy instrumentations. Furthermore, the fine spectroscopy (few % at 60 keV and <1% above 600 keV) and the high 3D spatial resolution (0.2–0.5 mm), that these devices can guarantee coupled with an high performance readout electronics, allow to operate not only in full energy mode, but also as Compton scattering or pair detectors if equipped with an appropriate electronics providing a suitable coincidence logic to handle multi hit events. This possibility imply that these sensors are suitable to realize wide field detector for γ-ray sources (> 100 keV) localization and detection both in ground and space applications [15]. Evaluation done using a single 3D CZT sensor, as a 4π Compton Imager, has demonstrated the possibility to obtain an angular resolution ~15° at 662 keV. This is really an excellent result in the small distance scale used to reconstruct the Compton events kinematics and can be achieved only because the good 3D and spectroscopic performance of the CZT proposed sensor units.

On the possibility to operate 3D spectrometers as Compton scattering detectors rely the appealing opportunity to utilize these devices for measurements of hard X- and soft γ-rays polarimetry. Today, this type of measurement is recognized of fundamental importance in high energy astrophysics and is one of the most demanding requirements for next space mission instrumentation in this energy range (10–1000 keV). The presence of linearly polarized photons in the incoming flux from a cosmic source determine a modulation in the azimuthal direction of Compton scattered events. A 3D spectrometer able to handle properly scattered events is intrinsically able to measure this modulation, i.e. operate as a scattering polarimeter [15]. The quality (modulation factor) of a scattering polarimeter is strictly dependent on his spatial resolution and spectroscopic performance. Several experimental measurements [16,17, 18] and simulation model have demonstrated that a detector allowing a good selection of events using both the spectroscopic and position information of each hits can achieve very high modulation factor. In particular the possibility to select events within thin layer of the sensitive volume, thanks to the intrinsic 3D segmentation of the detector (i.e. close to 90° scattering direction), drastically improve the modulation factor and therefore the reliability of the polarimetric measurements.

References

  1. Lechner P (2004) Novel high-resolution silicon drift detectors. X Ray Spectrometry 33; Pg No: 256.
  2. Eberth J, Simpson J (2006) From Ge (Li) detectors to gamma-ray tracking arrays-50 years of gamma spectroscopy with germanium detectors. Progress in Particle and Nucl Phys 60; Pg No: 283.
  3. Owens A, Peacock A (2004) Compound semiconductor radiation detectors. Nucl Instr and Meth in Phys Res A  531; Pg No: 18.
  4. Sellin PJ (2003) Recent advances in compound semiconductor radiation detectors. Nucl Instr and Meth in Phys Res A 513; Pg No: 332.
  5. Lebrun F (2003) ISGRI: The INTEGRAL Soft Gamma-Ray Imager. Astronomy & Astrophysics 411; Pg No: L141.
  6. Ogawa K, Muraishi M (2010) Feasibility Study on an Ultra-High-Resolution SPECT with CdTe Detectors. IEEE Trans. on Nucl. Sci 57; Pg No: 17.
  7. Wahl CG, He Z (2011) Gamma-Ray Point-Source Detection in Unknown Background Using 3D-Position-Sensitive Semiconductor Detectors. IEEE Trans On Nucl Sci 58; Pg No: 605.
  8. Devanathan R (2006) Signal variance in gamma-ray detectors – A review. Nucl Instr Meth in Phys Res A 565; Pg No: 637.
  9. Kozorezov AG (2005) Resolution degradation of semiconductor detectors due to carrier trapping. Nucl Instr Meth in Phys Res A 546; Pg No: 207.
  10. Frontera F (2013) Scientific prospects in soft gamma-ray astronomy enabled by the LAUE project. Proc of SPIE 8861, Pg No: 886106-1.
  11. Della Monica Ferreira D (2013) Hard X-ray/soft gamma-ray telescope designs for future astrophysics missions. Proc. of SPIE 886; Pg No: 886116-1.
  12. Watanabe S (2009) High Energy Resolution Hard X-Ray and Gamma-Ray Imagers Using CdTe Diode Devices. IEEE Trans on Nucl Sci 56; Pg No: 777.
  13. Judson DS (2011) Compton imaging with the PorGamRays spectrometer. Nucl Instr and  Meth in Phys Res  652; Pg No: 587.
  14. Boucher YA (2011) Measurements of Gamma Rays above 3 MeV using 3D Position-Sensitive 20×20×15 mm3 CdZnTe Detectors. IEEE Nucl. Sci Symp Conference Rec Pg No: 4540.
  15. Xu D (2004) 4π Compton imaging with single 3D position sensitive CdZnTe detector. Proc of SPIE 5540; Pg No: 144.
  16. Curado da Silva RM (2011) Polarimetry Study With a CdZnTe Focal Plane Detector. IEEE Trans On Nucl Sci 58; Pg No: 2118.
  17. Antier S (2014) Hard X-ray polarimetry with Caliste, a high performance CdTe based imaging spectrometer. submitted to Experimental Astronomy.
  18. Lee K (2010) Development of X-ray and Gamma-ray CZT detectors for Homeland Security Applications. Proc of SPIE 7664; Pg No: 766423-1.

Analysis and Comparison of Mechanical-Structural Properties of Polymeric Compounds Reinforced With GTR Particles

Summary

A serious environmental problem, which affects most of the countries for years, is the massive use of tires, which once used, generate large stocks of waste material. A common method to process these used tires goes through crushing, in which the fiber, steel and rubber obtained from the crushing process are separated. This article affects the reuse of rubber obtained from these tires, also called GTR (Ground Tires Rubber), by mixing with various thermoplastic polymeric compounds, in order to improve some of its mechanical and structural properties, and at the same time, give exit to these surpluses that cause already used tires. For this purpose, the article analyzes the mechanical-structural properties of seven common thermoplastic polymers, which mixed with the GTR ) for a single particle size (p <200µm). could be useful in industrial processes. From the results obtained, it follows that this proposal is valid, in lower percentages of GTR (5% -10% of GTR) analyzed (from 5% to 70% of GTR).

Keywords

GTR, Recycling, Reuse, Composite, Microstructural Analysis, Mechanical Properties, Polymeric compounds, thermoplastics, Scanning Electronic Microscopy

Introduction

The environmental problem of the accumulation of used tires (GTR) [1–3] has driven the efforts of the scientific community to seek solutions for the recovery and reuse of these tires. In general, a thermoplastic or thermosetting polymer acts as a matrix and the elastomer (GTR) acts as a dispersed phase [4–6] or reinforcement. As in other two-phase polymer mixtures, in these compounds [7–8] the interfacial compatibility between components is basic to achieve the desired mechanical properties. In the case of recycled elastomers, the expected compatibility is low, so it is intended to increase this compatibility by reducing the degree of GTR crosslinking by devulcanization [9–11], also observing significant changes in the properties when we vary the particle size of GTR [12] reinforcement. The use of these recycled tires as reinforcements in composite materials has been extensively studied in numerous works of physical characterization of polymers with GTR particles, but in this case, a complete comparative mechanical and structural analysis of these properties in different compounds has been performed [13–15], quantifying how the presence of GTR in the polymer matrix modifies its mechanical behavior. The size of the GTR particles, in this work, is restricted to p <200μm. The aim is to analyze what percentage of GTR can be added to the different polymeric matrix polymers (PVC, EVA, HDPE, PP, PA, ABS and PS) analyzed, in order to keep their mechanical properties and structure of the polymers within acceptable values [16 -18]. For this purpose, several concentrations of Polymer / GTR (from 0% to 70% in GTR) have been analyzed, with one particle size, always with the GTR as a reinforcing agent. Some authors such as [19 -20] have observed that the presence of carbon black as reinforcement in composites increases the mechanical properties. Composite materials are heterogeneous, and their properties depend on the quantity, size and shape of the reinforcement, as well as other factors such as their preparation, or their compatibility.

[21] have studied different PVC samples with different compositions and varying proportions of additives such as carbon black (CB). Studies show that PVC with CB produces compounds that improve mechanical properties. In summary, the objectives of this research are to analyze and compare the mechanical-structural behavior of different composite materials obtained by mixing different polymers with different percentages of GTR (up to 70%) and, demonstrating that although the addition of GTR normally excludes industrial applications with high mechanical requirements, that pure polymers do provide, if they could, instead, be part of the recycling solution in many other industrial applications.

Materials And Methods

Materials

The following polymers have been used in this study: Polyvinyl Chloride (PVC); High density polyethylene (HDPE); The ethylene vinyl acetate (EVA) copolymer especially used for the production of extrusion films and coatings (18% vinyl acetate and 82% ethylene); Polypropylene (PP); Acrylonitrile butadiene styrene (ABS) white, consisting of 30% acrylonitrile, 20% butadiene and 50% styrene, being an amorphous thermoplastic material and highly impact resistant. Polyamide 6 (PA), known as Nylon 6, being a semi-crystalline thermoplastic that has high strength, toughness and impact resistance, showing good sliding behavior and good wear resistance; Polystyrene, (PS or styrene-butadiene-styrene), solid, transparent, hard and fragile, being an amorphous thermoplastic, highly resistant to impact. Regarding the GTR, with a particle size smaller than <200 μm, its content was verified by means of a TGA analysis, with 54% elastomers (36% natural rubber, and 18% styrene-butadiene), 29% of carbon black (CB) and 16% inorganic.

Preparation of the Compound

The recycled tire powders were dried in an oven at 100°C for 24 hours. Five samples of Polymer / GTR compound were prepared, varying the composition (5%, 10%, 20%, 40%, 50% and 70% GTR), for a single particle size (p <200μm). The mixing process was carried out with a Brabender mixing machine. Polymer / GTR laminates were obtained using a hot plate press at a constant pressure of 200 bar and different temperatures for 10 minutes, depending on the polymer to be treated. The samples for the test were prepared correctly in accordance with the specifications of Standard ASTM-D-638 type V. A sample of the pure polymer was also prepared with the same requirements for comparable results.

Microstructural Analysis

Scanning Electron Microscopy S.E.M. It was used to analyze the fracture surface of broken samples in stress-strain tests. It is possible to analyze the effects of this filler material on the matrix by observing the fracture surface of the polymer with the reinforcing particles. The images of the samples were analyzed according to the concentration of GTR. A JEOL 5610 microscope was used, and the samples were previously coated with a thin layer of gold in order to increase conductivity. The samples were photographed at 180 magnifications. The scanning electron microscope (MEB) is an instrument to obtain three-dimensional photographs because it has a high resolution and a great depth of field. In the photographs you can see the microstructure of microscopic samples. The SEM uses an electron beam instead of a light beam to form an image. It has a great depth of field, which allows a large part of the sample to be focused at the same time. In the scanning electron microscope, the sample is coated with a layer of carbon or a thin layer of a metal such as gold to give conductive properties to the sample.

Mechanical Analysis

The Tension-Deformation tests were performed with a Universal Instron 3366–10 kN machine, following the specifications of ASTM-D-638 Type V Standard. The test speed was 20 mm / min. The test temperature was 23 ± 2 ° C, and the relative humidity was 50 ± 5%. The study of mechanical properties, according to the concentration of GTR in the matrix and the size of the particles, includes the Modulus of Elasticity or Young’s, tensile strength, elongation at breakage and hardness or toughness. Five samples were used for each test.

Results And Discussion

Structural Analysis: Scanning electron microscopy, S.E.M.

SEM photomicrographs of the fracture surface of the Polymer / GTR specimens of the Deformation-Traction test [Section 2.4] are shown in Figure 2. It is observed that the GTR particles do not reach their melting temperature when mixing with the different polymers analyzed, so that they are observed in the microphotographs, GTR particles dispersed in the homogeneous medium (matrix of the different polymers), while the polymer reaches its melting temperature, its dispersion being correct. The result is a microgranulated mass with a degree of dispersion that depends on the mixing time and temperature, which does not facilitate cohesion between phases, as can be seen in the different analyzed micrographs. Figures 2-a; 2-f and 2-g, shows compounds with low concentration of GTR (10%). It is observed that the particle of the reinforcement is integrated and covered practically by the matrix, showing a good interfacial adhesion. There are no gaps in the contour of the particle, and polymer fragments are dispersed over the entire surface of the particle by adhering to it. Figures 2-b, 2-d, 2-h, on the contrary, show compounds with high concentrations of reinforcement (40% -70% GTR), which causes an increase in faults and cracks in the matrix, worsening interfacial adhesion. In this case, the percentage of thermoplastic polymer is not sufficient to wrap the GTR particles, so that the joint is more difficult, cracks and pores of considerable size appearing in its contour. The GTR particles are clean and easy to extract, so the fracture has occurred through the interface of the matrix. On the other hand, with high concentrations of GTR there are greater possibilities of particle agglomeration, this agglomerate acting as a large particle.

Table 1. Main processing characteristics of the different polymers used

Polymer Type

Commercial Name

Density (kg/m3)

Processing Temperature (ºC)

Fusion Temperature  (ºC)

Press Temperature ºC)

PVC

Etinox

1.225

195–200 ºC

200 ºC

210 ºC

EVA

Alcudia PA 539 type

937

105–110 ºC

110 ºC

120 ºC

HDPE

Alcudia 4810-B

960

150–155 ºC

155 ºC

170 ºC

PA 6

Ultramid B3S

1130

195–200 ºC

220 ºC

210 ºC

ABS

Terluran® HH-106

1050

180–185 ºC

230 ºC

195 ºC

PP

Isplen® 099 K2M type

902

155–165 ºC

165ºC

165 ºC

PS

Polystyrol 486 M

1050

180–185 ºC

180°C

195 ºC

NAMS 2019-107 - Marc Martin Spain_f1

Figure 1. Scanning electron microscopy S.E.M., used for the Structural analysis of Polymer / GTR compounds. a) Scanning Electron Microscopy JEOL 5610. b) electrolytic coating machine (sputtering). c) Sample holder of the S.E.M., with the samples coated in a layer of 20 nanometers of gold.

NAMS 2019-107 - Marc Martin Spain_f2

Figure 2. SEM photomicrographs of the Polymers – GTR, for some concentrations of GTR particles in the polymer: a) EVA / GTR-10%; b) HDPE / GTR-40%; c) PA / GTR-20%; d) PVC / GTR-40%; e) PP / GTR-20%; f) ABS / GTR-10%; g) PS / GTR-10%; h) PS / GTR-70%

Results of Comparison Of Mechanical Properties

Through the Tension-Deformation test, the mechanical properties of the different polymers with different concentrations of GTR and size of reinforcement particles (p <200μm) in the polymer matrix have been analyzed. Regarding Young’s Module (Figure 3. a)), we can see how the compounds of EVA, HDPE and PS have a better performance with the addition of low percentages of GTR (5–10%) in the compound. In the rest of materials, generally, from the addition of GTR particles, Young’s Module worsens. A very clear case is the EVA copolymer, which has lower Young’s modulus properties and improves with the incorporation of GTR. In tensile strength (Figure 3. b)), we can see more evident decreases for concentrations greater than 10% of GTR, except for HDPE compounds, which exhibit better behaviors with the addition of quantities of GTR in low proportions (5–10% of GTR).

Regarding the elongation at break of the GTR compounds (Fig. 3. c)), the highest level is for the EVA compounds, which range between 700% and 350%, for 0% GTR concentrations. to 20% respectively. The reduction of the deformability of the elastomer influences the decrease in elongation and, subsequently, the decrease in hardness, showing similar behaviors in terms of hardness for compounds with EVA / GTR. The decrease in elongation at break is related to imperfect interfacial adhesion between the components, as discussed previously in section 3.1. The incidence of poor adhesion between phases is a particularly important result. Elongation at break with the addition of GTR particles decreases dramatically, rising only in the case of PA, with the addition of GTR. Regarding the tenacity (Figure 3. d)), these falls are even greater. The toughness ranges decrease for concentrations of 10% GTR. From the observation of the comparative graphs of tenacity (J) it can be seen that, the ones with the greatest energy to produce the fracture are EVA and PP. For EVA or PP that add 10–20% GTR, the breakage energies of the compound decrease significantly. For PP, ABS and, to a lesser extent, HDPE, the addition of GTR negatively affects the properties of tear strength (J). A very prominent case is the PVC and PA polymers, which show very low breaking energy values for the pure polymer and improve this property (strength) with the addition of the percentage of GTR in the polymer matrix.

NAMS 2019-107 - Marc Martin Spain_f3

Figure 3. a) Young’s modulus (MPa), b) Tensile strength (MPa), c) Elongation at break (%), d) Tenacity or hardness (J), for the seven Polymer / GTR concentrations and particle sizes p <200μm.

A deeply Comparative-Analysis Stress-Strain model is needed, for a further research we can obtain curves obtained from the test of the polymers mixed with the full range of GTR concentrations. In this case, the complex morphology of the matrix polymer blended with GTR particles does not allow the use of the standard elastoplastic equations or the classical approach. For this reason, and in the same way as purposed [22], a simple uniaxial tensile stress–strain relation is proposed, based on three parameters, σY, εY, and n, where σY is the yield strength and εY the elongation at yield.

NAMS 2019-107 - Marc Martin Spain_f4 [1]

Conclusions

There are necessary for a deep analysis of the compounds analyzed, through DSC, Differential Scanning Calorimetry, that allows the study of those processes in which enthalpic variation occurs, for example determination of specific calories, boiling points and fusion, purity of crystalline compounds, reaction enthalpy and determination of other first and second order transitions. The calorimetry applied to the composite materials is used as a tool to detect the possible changes in the crystallinity and microstructure of the matrix by adding a second component as a reinforcement [23–24]. By measuring the melting temperatures and enthalpy of the compounds, these changes can be analyzed through DSC analysis. The thermal behavior of the compounds can be studied using DSC, the final thermogram (heat / temperature flow) is obtained. The melting point of the sample and the glass transition temperature can be obtained to determine the modification of the internal structure of the matrix and possible reactions that may occur in the mixture. So, in this sense can be an interesting analysis for further research.

Comparatively, it can be deduced from the observation of the results of HDPE, PVC, EVA, PP, PA, ABS and PS with GTR, that the analyzed mechanical properties of the compounds may have some significant changes depending on the amount of GTR that is supplied to the polymer matrix, that is, some properties vary according to the percentage of GTR added. As can be seen in section 3.2, generally the highest property values correspond to the pure polymer (0% GTR). Thus, for EVA, HDPE, PA and PS, some mechanical properties are improved by the addition of microparticles (p <200 µm) of GTR in the polymer matrix. With low concentrations of GTR (5–10%), the Young’s Modulus of the compound increases, although other mechanical properties decrease as with the compounds of EVA, PS and HDPE. This behavior may be due to the fact that the reinforcement matrix is correct for these formulations (as shown in section 3.1 of this investigation) and, therefore, some mechanical properties improve. However, for GTR concentrations greater than 10%, all mechanical properties decrease, except for PA compounds. The results obtained from the analysis of these compounds show the limit concentration of GTR in order to maintain acceptable values of the mechanical properties is of the order of 5–10% in general, values that would allow its use in various fields of industry with mechanical solicitations not too high, giving out disused amounts of GTR, as other authors have studied before, GTR compounds can be reused with other applications [25–26]. At a structural level we see a clear relationship between structural properties and mechanical properties, relating the compounds that show better internal cohesion (Section 3.1), compounds with low proportions of GTR (10%) and that coincide with the compounds that have better mechanical properties. Likewise, with high concentrations of GTR (from 40% to 70% GTR), we see how the mechanical-structural properties progressively worsen with the addition of percentages of GTR, as the photomicrographs performed at 180 magnifications with electron microscopy show. What clearly reveals the structural study is that the interaction between the polymeric matrix with the GTR particles is very weak and low

Financing: This research was funded by the MINISTRY OF ECONOMY AND COMPETITIVENESS, Government of Spain ENE2015-64117-C5-3-R (MINECO / FEDER).

Conflicts of Interest: The authors declare no conflict of interest.

References

  1. European Tyre Recycling Association (ETRA). www.etra-eu.org (accessed aug 14, 2018)
  2. Used Tyre Working Group (UTWG). Tyre Recycling; Department of Trade and Industry: London, UK. www.tyredisposal.co.uk (accessed novembrer 18, 2006).
  3. Liu HS, Richard CP, Mead JL and Stacer RG. Development of Novel Applications for Using Recycled Rubber in Thermoplastics. Technical Research Program. Chelsea Center for Recycling and Economic Development, University of Massachusetts: Lowell, 2000.
  4. Figovslq O, Beilin D, Blank N, Potapo J and Chernyshe V. Development of polymer concrete with polybutadiene matrix. Cem Concr Compos. 1996, 18, 437–444.
  5. Hernandez-Olivares F, Barluenga G, Bollatib M and Witoszekc B. Static and dynamic behaviour of recycled tyre rubber-filled concrete. Cem Concr Compos. 2002, 32, 1587–96.
  6. Goncharuk GP, Knunyants MI, Kryuchkov AN and Obolonkova ES. Effect of the specific surface area and the shape of rubber crumb on the mechanical properties of rubber-filled plastics. J Polym Sci Part B: Polym Chem. 1998, 40, 166–169.
  7. Dierkes WK. Rubber recycling. In Recent research developments in macromolecules, Pandalai SG, Ed.; Trivandrum: Research Signpost, 7, 265–292, 2003.
  8. Radeshkumar C and Karger-Kocsis J. Thermoplastic dynamic vulcanisates containing LDPE, rubber, and thermochemically reclaimed ground tyre rubber. Plast Rubber Compos. 2002, 31, 99–105.
  9. Yehia A, Mull MA, Ismail MN, Hefny YA and Abdel-Bary EM. Effect of chemically modified waste rubber powder as a filler in natural rubber vulcanizates. J Appl Polym Sci. 2004, 93, 30–36.
  10. Colom X, Andreu-Mateu F, Cañavate FJ, Mujal R and Carrillo F. Study of the influence of IPPD on thermo-oxidation process of elastomeric hose. J Appli Polym Sci. 2009, 114, 4, 2011–2018.
  11. Cepeda-Jimenez CM, Pastor-Blas MM, Ferrándiz-Gómez TP and Martín-Martinez JM. Surface Characterization of vulcanized Rubber treated with sulphuric acid and its adhesion to polyurethane adhesive. J Adhesion. 2000, 73, 135–160.
  12. Mujal R, Marín-Genescà M, Orrit J, Rahhali A, Colom X, Dielectric, mechanical, and thermal characterization of high-density polyethylene composites with ground tire rubber. Journal of thermoplastic composite materials. 2012, 25, 5, 537–559
  13. Mujal, R.; Orrit J., Ramis, X.; Marin-Genesca, M.; Rahhali, A. Study on dielectric, mechanical and thermal properties of polypropylene (PP) composites with ground tyre rubber (GTR). Polymers & Polymer Composites (ISI). 2012, 20, 9.
  14. Mujal, R.; Ramis, X.; Orrit-Prat, J; Marin, M. Study on dielectric, thermal, and mechanical properties of the ethylene vinyl acetate reinforced with ground tire rubber. Journal of Reinforced Plastics and Composites0. 2011, 30, 7, 581–592
  15. Mujal R, Orrit-Prat J, Ramis-Juan X, Marin-Genesca M. Electrical application of polyamide reinforced with old tire rubber (ground tire rubber): Dielectric, thermal, mechanical and structural properties. Journal of thermoplastic composite materials. 2014. 27, 9, 1209–1231
  16. Nakason C, Kaesaman A and Supasanthitikul P. The grafting of maleic anhydride onto natural rubber. Polym Test. 2004, 23, 35–41.
  17. La Mantia FP, Lo Verso S and Tzankova Dintcheva N. EVA Copolymer Based Nanocomposites. Macro Mat Eng. 2002, 287, 12, 909–914.
  18. Kim JI, Ryu SH and Chang YW. Mechanical and dynamic mechanical properties of waste rubber powder/HDPE composite. J Appl Polym Science.  2000, 77, 2595–2602.
  19. Markov A., Fiedler B., Schulte K. Electrical conductivity of carbon black/fibres filled glass-fibre-reinforced thermoplastic composites. Composites Part A: Applied Science and Manufacturing. 2006, 37, 9, 1390–1395
  20. J.R. Pothnis , M. Sridevi, M.K. Supreeth , A.R. Anilchandra, G. Hegde, S. Gururaja. Enhanced tensile properties of novel bio-waste synthesized carbon particle reinforced composites. Materials Letters 251 (2019) 110–113.
  21. Saad ALG, Aziz HA and Dimitry OIH. Studies of Electrical and Mechanical Properties of Polyvinyl chloride) Mixed with Electrically Conductive Additives. J Appl Polym Science. 2004, 91, 1590–1598.
  22. Giroud, J.P. Mathematical model of geomembrane stress-strain curves with a yield peak. J. Geotext. Geomembr. 1994, 13, 1–22.
  23. N. Aini Fauziyah , A. Rosyidy Hilmi, M. Zainuri, M. Zainul Asrori, M.i Mashuri, M. Jawaid, S. Pratapa. Thermal and dynamic mechanical properties of polyethylene glycol/quartz composites for phase change materials. J. APPL. POLYM. SCI. 2019, DOI: 10.1002/APP.48130
  24. A. A. Gadgeel , Shashank Tejrao Mhaske. Novel approach for the preparation of a compatibilized blend of nylon 11 and polypropylene with polyhydroxybutyrate: Mechanical, thermal, and barrier properties. J. APPL. POLYM. SCI. 2019, DOI: 10.1002/APP.48152
  25. Colom X., Cañavate J., Carrillo F. Structural and mechanical studies on modified reused tyres composites. Eur Polym Journal. 2006. 42. 2369–2378.
  26. Kim JI, Ryu SH and Chang YW. Mechanical and Dynamic Mechanical Properties of Waste Rubber Powder/HDPE Composite. J. Appl. Polym. Science. 2000, 77, 2595–2602.

Nano Materials Application in Development of Novel Class of Fiberoptic Modulators

Abstract

The application of nano materials, in developing a novel class of fiberoptic modulators, is presented. The developed modulators are capable of high speed modulation up to 140 Gbps. The technology is based on building the device directly on the surface of the optical fiber core in a cylindrical symmetrical and uniform fashion, for polarization independent and ultra high speed applications. The design of the device is based on modifying optical fibers by removing the fiber jacket and the passive cladding materials off a very short length of the fiber. Then, the fiber core, in the modified section, is coated with a multilayer structure of nano-materials. This modified cladding includes a nano layer of high-speed electro-optic polymer sandwiched between two nano metallic electrodes, for modulating signals application. In this way, the device speed can reach up to 140Gbps and more, based on the polymer’s improved electro-optic properties. Also, this structure can eliminates polarization dependent problems associated with all available integrated rectangular waveguide modulators. Which are used in most optical telecomm networks. Demonstration prototypes have been manufactured and successfully tested, and the proof of concept is completed.

OCIS Codes: Fiberoptic, Nano-materials, Optical modulators/switches, Optical communication, Optical networks, EO polymer, EO devices, Optical active devices, On-fiber devices.

http://www.photonicslabs.com;
http://www.photonicsonfiber.com;
https://www.linkedin.com/pub/dr-mahmoud-el-sherif/7/ab6/38b

Introduction

Because of the importance of integrated optics in optical communication networks, a great deal of effort has been expanded to take the advantage of newly developed nano materials to build Electro Optic (EO) devices directly onto the core of regular optical fibers, wherein, optical fibers can be used as active devices as well as the optical transmission link. In this way, many of existing problems associated with integrated optics can be eliminated, such as insertion loss associated with coupling optical signals between integrated optical devices and communication networks.

In this Letter, an overview on development of a novel class of fiberoptic modulators is presented. The development is based on using advances in nano materials in manufacturing active devices directly on the fiber core, in a symmetrical cylindrical and uniform structure. Also, this design eliminates polarization dependent in existing devices, which are constructed of rectangular waveguides acting as the device active channel. This technology can be applied to any ordinary optical fiber. So, the fiber can be used as an active device as well as the communication link, in any fiber network.

Most commercially available EO modulators are constructed of rectangular waveguides, made of Lithium Niobate (LiNbO3) crystals. They are polarization dependent devices. Therefore, the device has to be positioned next to the light source, or a polarization maintaining fiber has to be used between the light source and the device. Therefore, using this type of devices in any fiber network, imposes certain limitations on the device location with respect to the light source. Also, coupling light between the active channel of the device, which is a rectangular waveguide, and the circular cross section of the fiber core is another challenge.

In this Letter, a brief explanation of the developed technology is presented. The technology has been successfully tested in development of an EO modulator, and proof of concept has been completed. A demonstration prototypes have been manufactured and tested at low frequency. Results show perfect match between the modulating electric signals and the modulated optical signals, even when a triangle modulating signal was applied. The manufacturing of the devices is based on using novel processing techniques to have full control on the deposition thickness uniformity and parameters for each layers of the applied nano materials.

Available Technology

For more than three decades, much effort has been directed to the development of high-speed EO modulators for optical communication networks, using LiNbO3 rectangular waveguide as the device active channel [1,2]. The effort focused on improving the modulation efficiency as well as reducing insertion loss associated with those integrated devices. However, those modulators are polarization dependent, very costly and still have shown other drawbacks including coupling mismatch, and high insertion loss, when connected to fiberoptic networks.

On the other hand, the development of the high-speed EO polymers has resulted in a new generation of integrated EO modulators. The EO polymer is used as the active waveguide, to replace the single crystal LiNbO3 modulators. A lot of research has been done to improve the properties of the developed EO polymers as well as modulation efficiency [3–6]. However, because of the rectangular shape of the active channel, polarization dependent is still a problem. The rectangular structure of the active channel of this type of modulators has imposed so many limitations and disadvantages. The modulator has to be positioned next to the light source output, to limit the effect of polarization dependent. However, experimental research has proven that; even when the modulator is positioned near to the light source, the polarization dependent is still a problem. This is clear from the test results reported in reference [3], when the modulating signal is a triangle wave. It is shown that the modulated signal cannot follow the shape of the modulating signal. Instead of having a single peak as in the modulating triangle signal, a double peak is shown in the modulated signal, as shown in Figure 4 [3].

Based on polarization problems associated with integrated rectangular waveguide modulators, there were several reported trials with the intention of building passive and active devices directly on the fiber core. Passive devices were mainly built for various sensors applications. One of the main advantages, of using on-fiber structure for sensors applications, is to improve signal stability and accuracy, because of the device polarization independent [7].

For active on-fiber devices, challenges were not easy for coating very thin multilayers nano materials onto the cylindrical surface of the fiber core. Early trials were reported in 1980’s, before electro-optic polymers were developed or known. Also, it was impossible to grow or deposit electro-optic crystals, such as LiNbO3 crystal, on the cylindrical surface of the fiber core. Therefore, liquid crystals were used as the modified EO cladding [8, 9]. As a result, the problems of using rectangular waveguide were illuminated, however, using liquid crystal imposed sever limitation on the speed of the modulator.

Newly Developed Technology

Along with interest in solving the problems associated with those devices, a novel technology based on nano materials application, has been developed for manufacturing on-fiber modulators, as shown in Figure.1. This developed technology has resulted in a new class of polarization independent modulators. It is based on constructing a layer of nano EO material, as an active channel, sandwiched between two nano metallic electrodes directly on the cylindrical surface of the fiber core, in a cylindrical uniform structure. In his way, polarization dependent as well as coupling problems, exist between integrated devices and fiber networks, can be completely eliminated. This can be achieved by modifying a small section of ordinary optical fiber, replacing the passive cladding with an active multilayer cladding, using nano processing techniques. The multilayer modified cladding has to be surrounding the fiber core in a symmetric uniform 360o cylindrical shape. Also, in this way, there will be no need to cut the optical fiber to integrate optical modulators into the fiber network. The advantages of using this novel structure are unlimited, ranging from simplicity and cost effectiveness to high efficiency and high signal to noise ratio, as well as the devices are all polarization independent, because of the symmetrical uniform cylindrical structure.

NAMS 2019-106 - Mahmoud A. El-Sherif USA_f1

Figure 1.    A schematic of an on-fiber EO Modulator, wherein, the device is constructed directly on the cylindrical surface of the fiber core.

Design and Manufacturing

In this Letter, an overview of the design, manufacturing and testing of the on-fiber EO modulator is presented. The design is based on modifying ordinary optical fibers in a small section, to act as an EO modulator. The fiber jacket is removed by mechanical stripping, then, the passive cladding material is partially (or totally) etched away, by a standard chemical etching technique. The etching process rate has to be calibrated, then, applied under continuous light transmission, for full control on the final thickness. This modified section is then prepared for multilayer coatings by applying the proper mask, before each layer of coating, based on the required geometry of this coating layer, as shown in Figure. 2 for the first layer of coating. The coating process is performed for each layer of the multi-layer structure, in 360o, as shown in Figure. 3.  After each coating step the mask is removed and a new mask is applied based on the geometry of the next coating layer. The modified cladding includes a number of nano-layer of different materials. One of the layers is a high speed EO polymer, sensitive to electromagnetic fields. The polymer is coated by a spinning technique, used under certain conditions for nano layer coating. This layer of EO polymer is sandwiched between two cylindrical coated nano metallic electrodes, using enhanced plasma deposition technique. The inner electrode is deposited first, then, the polymer layer is coated, wherein, the poling process of the polymer is achieved in-situ using the first deposited electrode, under high voltage application in a high temperature oven. This process is applied for a certain time, under vacuum and nitrogen gas, to generate the electro-optic property within the coated polymer. Then, the second nano-metallic electrode is deposited on the top of the EO polymer. Before and after each of the coating steps a special surface treatment is performed. After the last layer of nano-materials is coated, the jacket material is applied on the top of the second electrode, as shown in Figure. 4.

NAMS 2019-106 - Mahmoud A. El-Sherif USA_f2

Figure 2.   A schematic of the modified section of the optical fiber, after stripping the jacket and etching the cladding, and with the mask ready for the first coating process.

NAMS 2019-106 - Mahmoud A. El-Sherif USA_f3

Figure 3.   A schematic of the modified section of the optical fiber, after the multi-nano-layers coating, including the EO polymer and the two metallic electrodes.

NAMS 2019-106 - Mahmoud A. El-Sherif USA_f4

Figure 4.   A schematic of the on-fiber EO modulator, after applying the jacket to the modified section, for handling and protection.

Several on-fiber EO modulators were manufactured and tested, based on the structural design explained before. For each modulator, after the passive cladding was etched away, the inner electrode was coated, in 360o, on the top of the fiber core, using a transparent nano metallic material, using an enhanced plasma deposition technique modified for cylindrical coating of fibers. Then, the polymer base material was spin coated on the top of the inner electrode, while it was synthesized. Adjusting the spin coating process, speed and time, controls the thickness of the coated thin layer of the polymer. After drying in a nitrogen oven at room temperature, the polymer was radially poled for about one hour at the required temperature and voltage, using the corona poling method. It was then cooled down to the room temperature while keeping the poling voltage on. The thermosetting cross-link of the material system occurred simultaneously during the poling process. This process is very critical to satisfy the required change in the polymer high speed electro-optic property. Detailed information concerning the synthesis process and the in-situ poling of the polymer are reported elsewhere [5].

After the coating process of the EO polymer is completed, the outer metallic electrode was coated on the top of the EO polymer. Before coating any of the electrodes or the EO polymer, special chemical surface treatment was conducted to enhance interface properties. Then, the jacket material was applied on the top of the second electrode. The design of the jacket includes two exposed metallic rings, which are connected to the electrodes. All coated layers were designed in a symmetrically uniform cylindrical structure, in 360o. The schematic of the manufactured EO modulator is shown in Figure. 4.

In the presence of a modulating signal, applied to the electrodes, an electromagnetic field is generated between the two electrodes resulting in changing the optical properties of the EO polymer, mainly the equivalent refractive index of the polymer material. This change will be uniform across the 360o of the cylindrical surface of the fiber core, resulting in a uniform modulation of optical signals propagating within the fiber core, regardless of the polarization direction of the propagating optical signals within the fiber core. Thus, the problem of polarization dependent, in commercially available devices, has been eliminated. Another major advantage is that; modulation can exist at more than one location along the length of the same optical fiber, and can be far from the light source location.

Several modulators were manufactured and successfully tested. Different types of modulating signals (sinusoidal, triangle, and digital) were used for testing the manufactured devices. Also, two different experimental test set-ups (Mach zehnder or Michelson interferometers) were used in testing and proof of concept. All test results were encouraging, and modulated signals were always identical to the modulating signals. One of testing results, of the manufactured devices, is presented next.

Testing Results

Before testing the selected device, a reasonable packaging process was done, using available tools and facilities. An actual image of the packaged device is shown in Figure. 5, which is in size about 1.0in x 2.0in x 0.3in. Using the proper packaging tools and facilities, the device size can be reduced by 80% or more, and it can also be in a cylindrical shape with a diameter less than 0.3in and length about 1.0in to 1.5in. The packaging process includes the integration of a RF/MW socket connected from inside with the two electrode rings. Also, for fiber mechanical protection, two rubber sleeves were used to cover the exposed fiber ends.

NAMS 2019-106 - Mahmoud A. El-Sherif USA_f5

Figure 5.    An actual image of the manufactured EO modulator, after packaging with a metallic shield box. The fiber two ends are exposed from both sides, and protected by two black rapper holder. The microwave socket is connect from inside with the two metallic rings on the fiber jacket, for direct application of the modulating signals.

A sample of the device test results is presented here, using the Michelson interferometer set-up. The schematic diagram of the Michelson test set-up is shown in Figure 6. The Figure shows two input signals to the oscilloscope. The inputs are the modulating electric signal and the photo-detector output, which is the modulated signal.

NAMS 2019-106 - Mahmoud A. El-Sherif USA_f6

Figure 6.   A schematic of a Michelson interferometer test set-up, used for the evaluation and proof of concept of the developed on-fiber EO modulator, showing the input signal (as modulating electric signal) and the photo-detector output (as the modulated signal).

A sample of the test result is shown in Figure. 7. It shows that the modulating signal is a triangle signal. This type of modulating signal was selected to proof the high quality polarization independent. It is clear from Figure. 7 that the modulated signal is following exactly the shape of modulating signal, with a triangle shape too. For better understanding of the achieved high quality performance of this on-fiber modulator, a comparison has to be done with respect to the modulated signal of a device consisting of a rectangular waveguide channel. This was explained before, using the results reported in reference [3], which explain that when a triangle’ modulating signal is applied to a rectangular waveguide modulator, a double peak signal will result at the device output, as a result of the device polarization dependent. This polarization dependent is clear, as presented in reference [3], even when the device is positioned next to the light source as in Figure. 4 of the reference [3]. On the other hand, this novel on-fiber modulator shows a smooth single peak in the modulated signal, even when the device is positioned far from the light source. Therefore, the polarization dependent has been completely eliminated. Based on recent advances in available EO polymers the device speed can now reach 140 Gpbs, and expecting much higher speed in the near future. Also, the developed technology can be applied to other type of devices, such as EO switch, tunable couplers and wave division multiplexers.

NAMS 2019-106 - Mahmoud A. El-Sherif USA_f7

Figure 7.   A sample of the test result showing a sawtooth (triangle) applied modulating signal and the photo-detector output of the modulated optical signal, using the Michelson interferometer setup in figure 6.

Conclusion

A novel class of on-fiber EO modulators has been developed, manufactured, and successfully tested, using advances in processing of nano-materials. The technology is based on building the device directly on the fiber core, after removing the fiber jacket and etching the cladding layer. For demonstration, an on-fiber modulator was manufactured, using a nano-layer of advance EO polymer as the active channel within the fiber modified cladding. The layer of the EO polymer was sandwiched between two uniform cylindrical electrodes. Ordinary optical fiber can be used for such application. The test results were encouraging and provide a clear proves on polarization independent. The device can be used for application up to 140Gbps, and can be constructed at any location on the optical fiber and fare from the light source. Multiple devices can also be constructed on the same fiber at different locations. The developed on-fiber technology can be used for the actual realization of all-fiber networks, where the fiber is used as an active device as well as the networking link. In addition, the technology has been tested in application to on-fiber switches, tunable couplers and tunable DWDM.

The author gratefully acknowledges that the EO polymer used in most developed and tested modulators were provided by Prof. Alex Jen and his group, including Dr. Antao Chen, and Dr. Jingdong Luo, of the University Of Washington, USA.

References

  1. Ed L. Wooten, Karl M. Kissa, Alfredo Yi-Yan, Edmond J. Murphy, Donald A. Lafaw, et al. (2000) A Review of Lithium Niobate Modulators for Fiber-Optic Communications Systems. IEEE J. of Selected Topics in Quantum Electronics 6: 69–82.
  2. High-Speed Photonic Devices, Edited by Nadir Dagli, CRC Press, Taylor & Francis Group, 2007
  3. Dechang An, Zan Shi, Lin Sun, John M. Taboada, Qingjun Zhou, et al. (2000) Polymeric electro-optic modulator based on 1Ã2 Y-fed directional coupler. Appl. Phys. Lett  76: 1972–1974.
  4. Dechang An, Suning Tang, Zu Zhou Yue, John Taboada, Lin Sun, et al. (1999) Linearized Y-coupler Modulator Based on Domain-inverted Polymeric Waveguide. SPIE Conference on Optoelectronic Interconnects VI, San Jose, California, SPIE, 3632: 220–231.
  5. Ma H, Jen AK-Y, Dalton LR (2002) Polymer-based optical waveguides: Materials, processing, and devices Advanced Materials 14: 1339–1365.
  6. Taylor EW, Nichter JE, Nash FD, F. Haas, Szep AA, et al. (2005) Radiation resistance of electro-optic polymer-based modulators Appl. Phys. Lett 86: 201122-1–201122-3.
  7. Optical Guided-wave Chemical and Biosensors II, Chapter 5: Fiber Optic Chemical and Biosensors, Mahmoud El-Sherif, Editors M. Zourob and A. Lakhtakia, Springer-Verlag GmbH, Germany (2010)
  8. El-Sherif MA, Shankar PM, Herczfeld PR, Bobb L, Krumboltz H (1986) On-Fiber Electro-optic Modulator/Switch. Appl. Opt 25: 2469–2470.
  9. El-Sherif MA, Shankar PM, Herczfeld PR, Bobb L, Krumboltz H (1987) An on-fiber active transducer in Technical Digest, IEEE Fourth International Conference on Solid-State Sensors and Actuators,  200–203.

New Field Theory Based in Curvature and Torsion Energies and their Applications in Nanotechnology

Abstract

New field theories considering new re-interpretations of field observables are used in a wider context to be applied in the design and development of energy technologies to fine different applications through the spectra of field observables and the particles interaction that act in the shedding, correction, alignment, cure, re-directing of the fields to different process. In it are of our interest those applications to Nano medicine and design of biomedical devices at quantum level. Also are mentioned some parallel developments realized in this respect.

Introduction

New Theories, New Re-interpretations of the Knowledge and New Tools to the Next One Hundred Years

New postulates and principles have been considered as given in [1,2] where the torsion field theory has been embraced by some as the scientific explanation of homeopathy [1,3], electromagnetic propulsion, magnetic levitation [2], and deep studies of the development and evolution of the Cosmos or space-time [4–6]. All before phenomena are related beyond the terrestrial technology and are connected under the same topological field theory and principles considering the same field theory developed through algebraic geometry and mathematical physics. In this respect, are used frequently the cohomological spaces as of the type H1 (B, O(–k)), to explain and demonstrate the correspondences between helicities of the “quantum” fields bundles and the spin actions in spin manifolds developed. Last mentioned may be to the twistors (mini-twistors, ambitwistors and etcetera) in the correction and restoring of fields, or the introduction of the intention to transform a space, matter, body, organism or ambient of the any type [7].

The twistor geometry created Penrose [8], has been useful to describe from a point of view of the sources (that are singularities in usual differential geometry), the possibility to use the geometry created from start of these singularities. This last re-interpretation has been developed and also used in diverse research by me. However, has been necessary add some new concepts realising research in derived categories to explain the equivalences and different dualities that arise in this study.  In this new context, also arise the identification problem of the different topological groups or Lie groups that define the symmetries and other gauging actions in the interaction with the elements that offers the Universe. Recently, was realised a research on the field observable study and the duality of invariants in the Universe field equations through twistor-spinor framework in spectral theory of curvature to detection of gravitational waves [9].

In the last theme relative to the deep studies of the Universe, I have given several results that incorporate the fundamental principles of the matter in gravitation and a new re-interpretation of field observable under co-cycles defined in vector topological spaces [10–12]. However, these results go beyond treat to give a precise description of how functions the Universe from their Higgs boson [11].  Also are searched and wanted technologies, which derive of certain theorems to develop sensors and transducers of the field observable, having as final goal the creation of an advanced sensor of quantum gravity (see the figures 1 A), B), C) and D)) [13].

Also are of interest the quantum communication (telepathy, telekinesis, [15]) and the levitation (for example, this understood as the production of electro-antigravity described in the papers [5, 16, 17]. Here again we have used a cohomological space seemed to before, considering twistor geometry to describe the action of a rotation ring and their magnetic field in the movement of the ship in magnetic levitation).

In the mind phenomena as the clairvoyance and extra-sensorial perception [15], and other paranormal phenomena are had the same principles established to define field conscience by operators [18] in an integral operators theory that join the quantum mechanics with the relativistic and macroscopic theories of the Universe. Here under these arguments, are demonstrated that the second theories (relativistic and macroscopic theories) in reality are consequences of the quantum theories. Disorders in the mind are quantum perturbation generating coercive charges given energy weight that provoke the appearing of symptoms in the mind (see figure 2).

NAMS 2019-105 - FRANCISCO BULNES Mexico_F1

A). Curvature in microscopic level to analyse microcrystal deforming. B). Distribution of Neutrinos in the Universe [12, 14].
Figure 1. Field Detections through dilatons or gauge fields in the space-time and their relation with the SWAP mapping. Detection of the super-massive object (singularity) through sensor device to detect and measure quantum gravity using the fermionic spectral behaviour. Could be that the Universe field is the master control on our mind? If this is true then a good managing of photons as bosons of certain class could be the solution to all mental illness.

NAMS 2019-105 - FRANCISCO BULNES Mexico_F2

Figure 2. A). How begins the anxiety and their disorders? B). ……..what happens with the symptom space?

The application of torsion fields in medicine has been determining. Everything cure can be possible from photonics cure devices (including devices that cure all sickness such and as my hypothesis [1, 3] given to explain the appearing of organic illness and the re-composition of the fields by codes given by path integrals (Bulnes-Feynman integrals [1] to obtain the health).

Remember that one of my postulates and principles in the formal engineering theory is that the engineering is the creation of technology on the energy. Because, all is energy and as has been planted and demonstrated in a work [13], the Universe is all of energy because the unispace or universal covering is all of energy. The realised argumentations were done the global analysis that uses the universal covering of a Lie group with the causality (or causal structure).

This study consider the causal structure of the scattering phenomena through past and future light cones,  create the possibility of energy for one thousand years, perpetual motion  machines and star-gates (worm holes in the space) with advanced analogues as the synchrotronic propulsion (advanced spaceships)  and disintegrative mass weapons, using the same principles in all case.

Torsion fields can interact with laser beams (change frequency); creating effects of diverse, for example, in the biological processes, where torsion affects directly the ADN. Also can melting or solidifying some materials, affect quartz crystals increasing their properties as resonators. Also, affect some electronic components creating radiation coverings. The torsion can favourably change some beverages, and have been noted to affects gravity.

Spintronics and Micro-electronics Research

New theoretical developments have been given in quantum field theory[1], more specific in micro-electronics, realizing research on advanced electronics, photonics and spintronics[2], in the problems of electromagnetic propulsion, nano-medicine, sensors of field observables and transducers. Here is necessary to detach the importance of the obtained results in these research lines in electronics where have been complete theories with prototypes to detection of quantum gravity, cure of all illness, storage of energy through curvature and torsion energies, concept created [19, 20] to can to build the devices with technology on particles, fields, radiation and waves. Likewise, can be affirmed that the prospective in the use of the energy process of the electrons managing will give major developments of the advanced electronics considering no only their photon but also the use of their spin giving as result the spintronics [21]. This last also consider to the electron as the fundamental particle in all the processes of transference and information to the managing of other particles considering basal and transitory states of the electron through technologies, as are the dots, magnetons or spin-transistors.

Based and supported by important contributions and theorems on the deep study of the Universe, much of this research has been realized. Then have been given results in algebraic geometry and mathematical physics and published in the British and American journals of mathematics: Theoretical Mathematics and Applications [26], and other mathematics research journals [27].

Field Theory Applications in Nanomedicine

However, the vision of the research in field theory goes beyond the matter and molecular level. As has been mentioned in biomedical research scenarios [28], any illness begins in the atomic level through a collateral atomic damage when voracious protons are eating unstable electrons whose electronically information through photons is erroneous, and provokes the exit of these electrons attracted for voracious protons outside of the atom.

The electronic hypothesis in this respect can be detected for field variations of the vital field, or deviations of this field in their geometry. Of fact, integral geometry elements are incorporate to explain and determine this field deviation for their energy spectra. There is a report of these talks in the Current Medical Chemistry Journal [current], which has included the most famous scientific reports in advanced research in medicine and their different areas. In this important and prestige journal is included a complete scientific report in nano-medicine [28].

Here is planted the possibility of cure through the energy scanner of the human body to different organic systems using their different spectral resonances.

The research developed through different and various papers [29–31] shows through advanced mathematics the interchange of particles required to spill in the damaged part of the body of the photons required to correct information of their atoms. Then is corrected and restored the vital field and with it we achieve the obtaining of cure. He uses a version of the Feynman integrals to explain the interchanges and actions through the energy paths of the particles (see the figure 4).

NAMS 2019-105 - FRANCISCO BULNES Mexico_F3

Figure 3. A). Liquid light to help to the development of future advanced electronics in the threshold of the spintronics in the transducers design.  B). Direct sum of H-states to establish the curvature energy by the field ramification. C). Surface of energy E(k1, k2), to a metallic structure whose energy and prohibit trenches of energy in the solid were obtained applying a elementary electric charge that produce a planar constant superconductivity [20, 22–25].

NAMS 2019-105 - FRANCISCO BULNES Mexico_F4

Figure 4. Nanomedicine research based in quantum field theory [59, 60].

However, these researches were beyond the organic sufferings arriving to the conclusion that all suffering or illnesses have an origin metal in the mind-body. Likewise, is concluded in a research presented in an international conference [30] that “…all is reduced to correct and recover The WILL…”, “…the will is all”.

A graph is showed on the possible correction and restoring of the will compensating the energy displacement required by the cure (see figure 5).

NAMS 2019-105 - FRANCISCO BULNES Mexico_F5

Figure 5. Fill of incomplete atoms with free spaces for lack of one electron even of the order of their Fermi energy ∈F. This distribution is analyzed for the mono-pharmacist Pulsani considering an analytic electromagnetic potential ϕ(x) = x2(1–ex)log(x), [=nJ].

By the property recognize + displacement = ϕ(1)δ(0 – 1) + δ(1)u(0) (Theorems F. Bulnes applied to nano-medicine and radionics) with an evolution change given by exp(tX), we have the curve of recovering of the will. This graph corresponds to the action of Pulsani quantum mono-pharmacists. The continuous strengthen of the will [30].

Now recently have been realised an incursion on possible photonics and radionics developments on bio-medical devices adding research of photonics and spintronics, from the QED (Quantum Electrodynamics) and recent results in theoretical physics obtained and published in archival physics.

Likewise, is published an important theory of these devices linked with the study of some quantum complements and organic metal complements rich of certain class of photons that enrich the cure power and action of mono-pharmacists in quantum medicine and nano-medicine. In this research are explained possible mechanism to cure any illness from quantum level (figure 60).

A problem that has been presented in these researches is the fine nanometric gauging of quantities of the energy that can be registered in electronics devices, because these devices to experiments have been not invented yet. However, are established at least in design level possible quantum electronic devices to the correction, detection and alignment of energy fields of the human body [29–32].

References

  1. F Bulnes, FH Bulnes-González, E Álvarez, J Maya, F Monroy (2010) Integral Medicine: New Methods of Organ Regeneration by Cellular Encoding through Path Integrals Applied to the Quantum Medicine Journal Nanotechnol. Eng. Med 1: 031009.
  2. F Bulnes, J Maya,  I Martínez (2012) Design and Development of Impeller Synergic Systems of Electromagnetic Type to Levitation/Suspension Flight of Symmetrical Bodies. Journal of Electromagnetic Analysis and Applications 1: 42–52.
  3. F Bulnes, FH Bulnes, E Hernández, J Maya (2011) Diagnosis and Spectral Encoding in Integral Medicine through Electronic Devices Designed and Developed by Path Integrals. Journal of Nanotechnology in Engineering and Medicine ASME 021009: 10.
  4. F Bulnes, S Fominko (2016) Dx-Schemes and Jets in Conformal Gravity using Integral Transforms. International Journal of Mathematical Research 2: 154–165.
  5. Bulnes F (2015) QED-Lie Algebra and their Modules in Superconductivity. Journal of Applied Mathematics and Physics. 3: 417–427.
  6. F Bulnes (2015) Local Diffeomorphisms and Smooth Embeddings to Gravitational Field II: Spherical Symmetry and their Breaking in the Space-Time. Physics and Astronomy International Journal 2: 00045.
  7. Francisco Bulnes (2015) Mathematical Electrodynamics: Groups, Cohomology Classes, Unitary Representations, Orbits and Integral Transforms in Electro-Physics. American Journal of Electromagnetics and Applications 6: 43–52.
  8. LJ Mason, J Frauendiener (1990) Sparling 3-form, Ashtekar variables and quasi-local mass, Twistor in Mathematics and Physics, Cambrindge, UK, 1990.
  9. F Bulnes, Y Stropovsvky, I Rabinovich (2017) Curvature Energy and Their Spectrum in the Spinor-Twistor Framework: Torsion as Indicium of Gravitational Waves. Journal of Modern Physics 8: 1723–1736 2017.
  10. F Bulnes (2015) Integral Transforms and Opers in the Geometrical Langlands Program. Journal of Mathematics1: 2015.
  11. Bulnes F Integral geometry methods on deformed categories to geometrical Langlands ramifications in field theory, Ilirias Journal of Mathematics 3: 1–13.
  12. Bulnes F (2014) Design of Quantum Gravity Sensor by Curvature Energy and their Encoding. IEEE Proc, SAI 2014, London, UK Pg: 855–861.
  13. Francisco Bulnes (2013) Quantum Intentionality and Determination of Realities in the Space-Time Through Path Integrals and Their Integral Transforms, Advances in Quantum Mechanics, Prof. Paul Bracken (Ed.), InTech.
  14. Francisco Bulnes (2017) Detection and Measurement of Quantum Gravity by a Curvature Energy Sensor: H-States of Curvature Energy, Recent Studies in Perturbation Theory, Dr. Dimo Uzunov (Ed.), InTech.
  15. Bulnes F, Bulnes FH, Cote D (2012) Symptom Quantum Theory: Loops and Nodes in Psychology and Nanometric Actions by Quantum Medicine on the Mind Mechanisms Programming Path Integrals, Journal of Smart Nanosystems in Engineering and Medicine 1: 97–121.
  16. Bulnes F, Álvarez A (2013) Homological Electromagnetism and Electromagnetic Demonstrations on the Existence of Superconducting Effects Necessaries to Magnetic Levitation/Suspension. Journal of Electromagnetic Analysis and Applications 5: 255–263.
  17. Mahmoud J, Hashim S (2015) Principles of Superconducting Spintronic Device to Generate Fermionic Orbital Spaces. Journal on Photonics and Spintronics 4: 1 USA.
  18. Bulnes F (2013) Mathematical Nanotechnology: Quantum Field Intentionality. Journal of Applied Mathematics and Physics 1: 25–44.
  19. Bulnes F (2015) Curvature Spectrum to 2-Dimensional Flat and Hyperbolic Spaces through Integral Transforms. Journal of Mathematics RP 1: 1 USA.
  20. Bulnes F, Martínez I, Mendoza A, Landa M (2012) Design and Development of an Electronic Sensor to Detect and Measure Curvature of Spaces Using Curvature Energy. Journal of Sensor Technology 2: 116–126.
  21. Mahmoud J (2013) Spintronics in Devices: A Quantum Multi-Physics Simulation of the Hall Effect in Superconductors. Journal on Photonics and Spintronics 2: 1 USA.
  22. Bulnes F, Martínez I, Zamudio O (2016) Fine Curvature Measurements through Curvature Energy and their Gauging and Sensoring in the Space, Advances in Sensors Reviews 4, (Ed.) Sergey Y. Yurish, IFSA.
  23. Bulnes F, Humeini S (2018) Topological Superconductors Characterizing II: Curvature Energy in Hall-Spintronics Developments, SciFed Journal of Spintronics and Quantum Electronics, 1: 1.
  24. Bulnes F (2016) Electromagnetic waves in conformal actions of the group SU (2,2), on a dimensional flat model of the space-time. VI International Conference “Geometry, Dynamics, Integrable Systems”-GDIS, Izhevsk, Russia.
  25. Prof. Dr. Francisco Bulnes (Editor-in-Chief.) (2018) Mini-Workshop on Nanoparticles, Photonics and Advanced Electronics. Journal on Photonics and Spintronics Chalco, State of Mexico.
  26. Bulnes F (2017) Extended d- Cohomology and Integral Transforms in Derived Geometry to QFT-equations Solutions using Langlands Correspondences. Theoretical Mathematics and Applications 7: 51–62.
  27. Bulnes F (2014) Derived Categories in Langlands Geometrical Ramifications: Approaching by Penrose Transforms. Advances in Pure Mathematics 4: 253–260.
  28. Bulnes F (2012) Combination of Quantum Factors in Integral Mono-pharmacists and their Actions in Cellular Regeneration and Total Cure, Current Medicinal Chemistry International Conference of Drug Discovery and Therapy 2012 Reports, Bentham Science, Dubai, UAE, 2012.
  29. Bulnes F, Bulnes FH, Hernandez E (2010) Integral Medicine: New Methods of Organ-Regeneration by Cellular Encoding through Path Integrals applied to the Quantum Medicine. Journal of Nanotechnology in Medicine and Engineering 1: 7.
  30. Bulnes F (2013) The Anxiety Factor in the Dimension of the Symptom Space and their Elimination for Nano-Metric Actions of Quantum Mono-Pharmacists,” Drug Discovery and Therapy World Congress 2013, 3–6 June, Boston Massachusetts, USA, 2013.
  31. Bulnes F, Bulnes-Gonzalez FH (2014) Quantum Developments in Nanomedicine: Nanocurative Actions by Soft Photons Sources and their Path Integrals. Nanomedicine  Open Central Press, UK, Pg: 238–267.
  32. Bulnes F (2015) Photonic Chains of Wave-links to the Quantum Communication. Journal on Photonics and Spintronics 3: 10–14.

[1] Exists a research programme called electrodynamics research programme, which is dedicated to the future technologies whose fundamentals are the quantum and classical electrodynamics including the modern developments in advanced electronics.

[2] I am Editor-in-Chief of the Journal on Photonics and Spintronics, in USA. See: http://researchpub.org/journal/jps/editorial%20board.html

Implantation of Continuous Flow Pumps in Aortic Valve Position: Theoretical Advantages and Disadvantages

Abstract

Left ventricle assist devices has become an alternative in treatment of cardiac failure. They are used as bridges to recovery, heart trasplant or destination therapy. There are two principal types of circulatory support systems: pulsed flow pumps and continuous flow pumps. The latter correspond to small turbines that levitate in a magnetic field and driving the blood from the left ventricle into the aorta. The common configuration consist in an inflow cannula in the left ventricular apex, a turbine and an output tube graft anastomosed to the ascending or descending aorta. All they are controlled and powered electrically by a wire from the outside. Despite this advances, there remains a high rate of complications. Including anatomical problems (pocket, inflow cannula, outflow graft), technical problems (bleeding, adhesions), infections, thrombosis, embolism and aortic valve problems. To reduce some of these complications, some investigators have developed the concept of aortic intravalvular pump (Valvo – pump). The prototypes are in the experimental stage and are not adapted to use for extended periods or in humans. The theoretical advantages and disadvantages of the implantation of a continuous flow pump in aortic valve position are discussed, and the first experimental models are described.

Keywords

Cardiac Surgery, Heart Failure, Heart Transplant, Left Ventricle Assist Devices, Valvo Pump

Introduction

Heart failure has become one of the most common causes of hospitalization in developed countries. It accounts for 5% of emergency hospitalizations and about 10% of all hospitalizations in Europe. According to statistics from the European Society of Cardiology, 1 – 2% of the european adult population currently suffer from heart failure. The incidence increases to 10 – 20% in people over 75 years and heart failure remains a leading cause of death. Finally, because of the aging of the population, the prevalence is increasing [1]. The prognosis remains poor, with a mortality of 50% at 4 years. Current medical treatments, ventricular re-synchronization, conventional cardiac surgery (coronary or valvular) and ventricular remodeling surgery have improved the overall prognosis of this disease, but for a significant number of patients, the only treatment possible remains the heart transplantation [2]. The results of transplantation are very encouraging, with one-year survival of 77%, five years of 67%, and ten years of 53% [3]. Unfortunately the number of donors has decreased and the number of patients on the waiting list continues to increase. As a result, there is a real lack of grafts to satisfy demand [4].

Since the early 1960s, circulatory assistances have been developed to support the function of the left ventricle. All the advances made in this field have made it possible to move from extracorporeal circulation to pneumatic, electromechanical implantable mechanical assistance systems, and even the appearance of a total artificial heart and continuous flow assistance [5]. Rose and coworkers of the REMATCH study investigators compared 61 patients with non-transplantable, medically treated terminal heart failure versus 68 patients who received implantable mechanical assistance (Heartmate, Thoratec ®). At two years, the survival of the group under assistance was 23% against 8% in the group treated medically (p = 0.09) [6]. There are currently two main implantable circulatory assistance systems: pulsatile flow and axial flow circulatory assistances.

Pulsatile flow assistances used pneumatic energy to fill and empty cavities similar to ventricles. Flow is directed through uni – directional inlet and outlet valves that provide pulsed flow and “physiological” cardiac output. This systems can be used to assist both ventricles. Pulsatile flow assistance is now virtually abandoned in favor of axial pumps, because of their smaller size, lower thrombotic risk, and better energy efficiency, even if the reduction or abolition of the pulsatility has been criticized. In all cases, these axial flow pump systems are composed of an inlet cannula implanted at the apex of the left ventricle, an electric pump and an outlet tube anastomosed directly to the ascending aorta or down. They can be implanted by sternotomy or by thoracotomy, with or without cardio pulmonary bypass. These pumps provide a continuous flow sufficient to ensure the theoretical cardiac output. The Heartmate 2 Investigators group compared the use of a pneumatic pump, the Heartmate®, to a continuous flow pump, the Heartmate II®. After two years, the survival with the pneumatic pump was 24% against 58% with the continuous flow pump (p = 0.008) [7]. These results showed that, in addition to the technical advantages (small size, electrical energy), there is an advantage in terms of survival for the patients, and the continuous flow pumps are more and more the first choice for the patients with a left ventricle failure. Thanks to technical progress made on development of pumps and the experience in management of complications, LVADs are accepted as one of the major tools to treat the cardiac failure, either as bridge to transplantation or to recovery (even if the rate of explant due to recovery is low) or as a definitive therapy (destination) [8–10].

Problems and Complications of Current Pumps

The main complications observed in the Interagency Registry for Mechanically Assisted Circulatory Support (INTERMACS) are infection (17,46%), bleeding (16,5%), cardiac arrhythmia (7,68%), respiratory failure (4,5%), neurological dysfunction (2,87%), renal dysfunction (2,48%), device malfunction (1,98%) and right heart failure (1,89%). Mortality under assistance is close to 20%, and is related to cardiac failure, infection, CNS event, multi – organ failure and respiratory failure [11].

There are also unregistered complications due to apical implantation of axial flow pumps, such as thrombosis of the left ventricular outflow tract or the aortic valve, the risk of postoperative bleeding, and difficult explantation of the LVAD in the event of transplantation or recovery. In addition, these systems are not usable in case of bi ventricular failure.

Anatomical Problems (Pocket, Cannula, Exit Cannula)

  1. The implant of an axial flow pump requires the preparation of a pocket at pre-peritoneal level, in front of the diaphragm. For large patients there is no limitation, but the implantation of the pump may be limited in small patients.
  2. The in-flow cannula is placed in the apex of the left ventricle. The heart muscle forms two spirals that make up the ventricles. An under – endocardial spiral turns to the right and a sub – epicardial spiral turns to the left [12]. During ventricular dilatation, these spirals unfold and expand, but keep their shape. Once the assistance is in place, the ventricle is unloaded, they must return to their normal size to recover ventricular function. The cannula in the apex can interfere with normal contraction and, in addition, constitute a scar that affects the recovery of the contractile function of the ventricle.
  3. The out-flow line of the pumps consists of a prosthetic tube anastomosed directly into the aorta. He can bend and stick to the sternum.

Technical Problems (Bleeding, Adhesions)

Bleeding and tamponade can affect more than one fifth of patients undergoing assistance. These complications may concern the suture lines, the apex of the left ventricle, as well as the anastomosis of the prosthetic tube on the aorta. Currently, “bridge to transplantation” accounts for 80% of indications for ventricular assistance. Indeed, most patients will eventually be re-operated. Postoperative adhesions become a frequent and serious problem, which increases the operating time, the risks inherent to the detachment of the heart with an increased risk of postoperative bleeding, transfusions, and could affect the post transplant survival [13].

Infections

The large implantation area of the pumps and the fluid possibly accumulated around can facilitate bacterial adhesion and multiplication. This susceptibility, in combination with heart failure, malnutrition, and immunosuppression state, makes infection the most frequent complication of mechanical circulatory assistance [10, 14]. (10, 14) Infections associated with LVADs can be local (the drive line, the pocket, the scar, the sternum and the mediastinum) or haematogenous (sepsis, endocarditis, pump), they can affect 20% of patients at six months, and were related to 16,2% of deaths [10,14] .

Tromboses, Embolism And Valve Problems

Thrombus and neurological events, including ischemic stroke, hemorrhagic stroke, and transient ischemic attack, are relatively common and often severe complications following LVAD placement. Thromboembolic complication rates range from 3% to 20% and are related to the duration of the asistance [15]. The frequent sites of thrombosis are the connection of the conduits to the pump, both the inlet and the outlet, and particularly the suture rings of the tubes to the vascular system. Reilly et al. published a retrospective study of 51 consecutive patients receiving left ventricular assistance over a 2-year period. In this series, transesophageal echocardiography showed ventricular thrombus in 8 patients (16%). Predictors of thrombosis were: infarction, atrial cannulation and postoperative bleeding. The presence of thrombus is associated with four times the risk of stroke compared to patients without thrombi. Ventricular cannulation and short duration of assistance may decrease the incidence of LV thrombosis [16]. Thrombosis of the aortic valve and the ascending aorta may also occur after the implantation of a LVAD despite adequate anticoagulation. This is more common in patients with a prosthetic valve, continuous flow devices and devices with grafts anastomosed on the descending thoracic aorta. In addition, the lack of left ventricular ejection with persistent closure of the aortic valve creates stagnation at this level and contributes to thrombosis [17]. Commissural fusion of the native aortic valve frequently occurs with increasing frequency of aortic insufficiency during continuous flow assistance. The impact of valvular lesion in long-term assisted patients as a bridge to transplantation or as a definitive therapy is unclear. Aortic stenosis may be a real problem for patients in whom assistance has been posed as a bridge to recovery or in those in whom assistance is unsuccessful [18–20].

Advantages and Disadvantages of A Pump in the Aortic Valve Position

Anatomical, Technical and Physiological Advantages

  • The placement by vertical median sternotomy reduces the risk of bleeding and postoperative pain, as well as the duration of the procedure. Even the pump could be implanted by mini sternotomy (superior parcial sternotomy) reducing post operative pain.
  • Implantation technique is the equivalent of aortic valve replacement, and thus largely known by all surgeons: a single line of suture, without apical approach of the ventricle, nor aortic anastomosis, also reducing the risk of bleeding: reproducible technique.
  • The size of the machine would allow its implantation in patients of all sizes. There is no material to put in place in a pocket.
  • The absence of a pocket to place the device would reduce the risk of associated infection.
  • The “anatomical” position of the pump would allow physiological ventricular emptying, maintaining flow through the left ventricular outflow tract, and anterograde flow at the ascending aorta and coronary arteries.
  • Anterograde emptying may reduce the risk of intracardiac or valvular thrombosis, and reduce the risk of systemic embolism.
  • Because of the absence of an apical scar and scars, the ventricular geometry would not be modified, and the ventricular contraction (during or after the weaning) would be more effective.
  • Implantation in the intracardiac valve position would eventually lead to dual aortic and pulmonary implantation in the event of bi-ventricular failure.
  • In case of transplantation, the absence of strong apical pericardial adhesions, the absence of aortic prosthetic tube and the fully intra-cardiac position of the machine, would allow a “classical cardiectomy”, with removal of the system and the heart in one. “Block”.
  • In the event of ventricular function recovery, there would be no ventricular scar and no loss of myocardial mass and the aortic valve would be replaced by a conventional prosthesis, similar to an aortic valve redux.

Disadvantages

  • The operative technique demanded the use of CPB and aortic clamping. Today CPB is considered a safe and low risk technique that allows complex and long-lasting procedures on the heart. In addition, the majority of devices, except the Jarvik 2000®, are implanted under CPB with lateral clamping of the aorta to anastomose the prosthetic tube.
  • The implantation of the device requires sacrifice of the aortic valve and its replacement in case of recovery.
  • Implantation in the aortic position makes the assistance the only way of ventricular ejection, and thus implies absolute reliability of the device. There are several causes of device malfunction, including thrombus formation with hemolysis, mechanical failure of the impeller, and driveline lead fractures with electrical failure. Current continuous-flow
  • devices consisting of only a single, nearly moving part-the impeller- sowed in clinical trials, statistically significant lower pump replacement rates in comparison to their first and second generation counterparts.
  • Even if the rate of device malfunction is low, in the event of a technical problem a massive aortic insufficiency would occur and the ventricle would have no ejection channel and the patient would die. A mechanism, such as an internal valve, should be found to protect the heart in the event of a technical problem with the machine.
  • There are the same disadvantages common to all electrical pumps, the transcutaneous passage of an activation line for the power supply. The Jarvik 2000 the activation line pass through the thorax, the neck and comes out retro-ear position. This technique has greatly decreased cable site infections and represents a great advance in decreasing this complication.

Valvular Pumps

The Valvo Pump

The idea of an aortic valve pump was first published by Yoshinori Mitamura ,in Japan, in 1991. Mitamura and his colleagues developed a small axial flow pump (33 mm length, 37 mm diameter) capable of generating a flow of 6.9 l / min and a differential pressure of 48 mm Hg. Initial studies showed the feasibility of the pump [21]. In 1999 the Mitamura team released a final pump model of 44mm in length, and 38mm in external diameter. This pump was experimentally tested in a closed circuit and was able to operate for 41 days without stopping, to generate a flow of 5 L / min at 7000 rpm and did not to produce too much haemolysis [22]. Unfortunately, the size of the Mitamura pump does not allow its implantation in vivo.

The Dynamic Aortic Valve

Li and coworkers, at the Department of Cardiac Surgery, Institute of Cardiology and Fu Wai Hospital, Beijing, and the Union Medical College and the Chinese Academy of Medical Science, Beijing, China, have also developed an axial flow pump implanted in aortic position [23]. Since the device is intended for long-term use, the motor and pump unit are physically separated. The device consists of a finned wheel and a rotor contained in a cage. The magnetic rotor rotates in the presence of alternating magnetic fields produced by an electric motor. The pump is sutured to the aortic ring. The assembly also includes a valve that maintains the proper hemodynamics through the aortic port. A prototype was manufactured and evaluated in vitro. It was capable of delivering a flow rate up to 5 L / min with a rotation rate of 12,600 rpm with a differential pressure of 100 mmHg.

Intraventricular Axial Flow Pump

Yamazaki et al, in the Department of Cardiovascular Surgery, Tokyo Women’s Medical College, Heart Institute, Japan, and later in the Medical Center at the University of Pittsburgh, USA, have developed a ventricular assist axial flow pump left fully implantable in the left ventricle [24]. The system consists of a finned wheel (13.9mm), combined with a guide fin, a tube housing and a motor. The pump is made of titanium alloy and the weight of the pump is 170 g. It produces a flow of more than 5 L / min against 100 mm Hg of pressure at 9,000 rpm, with a total power consumption of 8 W. The maximum total efficiency exceeds 17%. The pump was implanted in the LV cavity trough the apex and passes the aortic valve. Blood is drained from the VG to the intake ports at the pump base and discharged into the ascending aorta. In an animal model, three pumps were implanted in three cases (26, 30 and 168 days of assistance). The operation of the pump remained stable during all experiments. No cardiac arrhythmias were detected, even during stress tests in these 3 cases. Plasma free hemoglobin level remained within acceptable limits. The post mortem examination did not reveal any interference between the pump and the mitral apparatus. No thromboembolism was detected in the vital organs in Cases 1 and 2, but some small renal infarctions were detected in case 3 [25]. Due to anatomical problems, and conditioning, the pump was not considered a durable device.

Cross-valvular cannular pump

Kun Xi Qian at the Institute of Biomedical Engineering of Jiangsu University, China, in association with the University of Texas, USA, built a ventricular energy transduction pump totally implantable in the left ventricle [26]. The device has a motor and a pump completely contained in a cannula. The motor has a coil with an iron core and a rotor with the four-pole magnet; the pump has a finned wheel and a flow guide fin. The dimensions of the engine are 60mm in length and 13mm diameter. The dimensions of the pump are 55mm in length and 11mm in diameter. The total length of the device is 115millimeters. The total weight of the device is 53g. The use bearing motor supports eight needles on each side of the rotor magnets. A special purge system is provided by infusion of saline mixed with heparin in the pump inlet chamber (30 – 50 cc per hour). Thus no mechanical wear or thrombus formation was observed during use of this pump. During the hemodynamic experiment, the pump produced a flow of 4 L / minute with a pressure increase of 60 mmHg, at a speed of 12500 rpm. At zero flow, corresponding to the diastolic period of the heart, the pump can maintain the aortic pressure at more than 80 mmHg at the same rotational speed. According to the authors, this new pump can be quickly inserted in an emergency and removed easily after the recovery of the native heart and may be useful for patients with acute left ventricular failure.

The “USJ – III Aortic Valvo Pump

The same authors have also developed other pump intended to be implanted in aortic position [27]. Like those described previously, it consists of a cylindrical steel box which contains a stator and a rotor activated by external magnetic field. The pump has a weight of 40g and an outer diameter of 25mm. around the pump is a flange to allow its attachment to the aortic ring. It operates at three speeds: 10000, 12500 and 15000 rpm. The prototype of the pump was tested in an experimental model in vitro for four months. The power consumption is 7W at 15000rpm, it has been able to generate a maximum flow of 10 L / min (range 4 -10) and pressures of 80 mm Hg, parameters which are quite satisfactory for support human hemodynamics. The authors developed other 23mm diameter prototype with a weight of 31g, tested in vitro and implanted in a pig of 80 kg [28]. Finally the same team has developed a pump of 21mm diameter for weight of 27g that operates at three speeds (12500, 15000 and 17500 rpm and was capable of generating a flow of 5 L / min in vitro [29]. Until today, this pump is the smallest and most advanced in the world. Currently the authors are working to improve the biocompatibility of this pump and ensure its durability.

Discussion & Conclusion

The idea of implanting a pump in the aortic position is not recent. Several tests have been done over the last 20 years to manufacture a pump with a size that allows its implantation in aortic position and the power adequate to support the hemodynamics of a human being. These efforts are still in an experimental stage, but there are already small pumps in development, and it is likely that in future years the improvement of their biocompatibility and durability will allow their human implantation. It is also probable that after some modifications of the current pumps these could be put in place in aortic position. If the theoretical benefits are real, probably this new generation of pumps will hold a place among the audience of the future, especially by their ease of implementation. Different anticoagulation protocols will have to show if there are any advantages for this type of implantation on the thrombotic risk. In addition, one can imagine a double implantation (aortic and pulmonary) for bi ventricular failure.

Acknowledgement

[List here any individuals who contributed in the work and grant details.]

Abbreviations

LVAD: left ventricle assist device.

CPB: cardio pulmonary bypass

CVA: cerebrovascular accident

CNS: Central nervous system

LV: Left ventricle

References

  1. Ponikowski P, Voors A, Anker S, Bueno H, Cleland J, et al. (2016) Guia ESC 2016 sobre el diagnóstico y tratamiento de la insuficiencia cardiaca aguda y crónica. Rev Esp Cardiol 69: 1119–1125.
  2. Nicolini F, Gherli T (2009) Alternatives to transplantation in the surgical therapy for heart failure. Eur J Cardiothorac Surg 35: 214–228.
  3. Tjang YS, van der Heijden GJ, Tenderich G, Grobbee DE, Körfer R (2008) Survival analysis in heart transplantation: results from an analysis of 1290 cases in a single center. Eur J Cardiothorac Surg 33: 856–861.
  4. de Jonge N, Kirkels JH, Klöpping C, Lahpor JR, Caliskan K, et al. (2008) Guidelines for heart transplantation. Neth Heart J 16: 79–87.
  5. De Bakey M (2005) Development of Mechanical Heart Devices. Ann Thorac Surg 79: 2228 – 2231.
  6. Rose EA, Gelijns AC, Moskowitz AJ, Heitjan DF, Stevenson LW, et al. (2001) Long-term mechanical left ventricular assistance for end-stage heart failure. N Engl J Med 345: 1435–1443.
  7. Slaughter M, Rogers J, Milano C, Russell S, Conte JV, et al. (2009) Advanced Heart Failure Treated with Continuous-Flow Left Ventricular Assist Device. N Engl J Med 361: 2241–2251.
  8. Baughman K, Jarcho A (2007) Bridge to Life — Cardiac Mechanical Support. N Engl J Med 357: 846–849.
  9. Topkara VK, Garan AR, Fine B, Godier-Furnemont AF, Breskin A, et al. (2016) Myocardial Recovery in Patients Receiving Contemporary Left Ventricular Assist Devices: Results From the Interagency Registry for Mechanically Assisted Circulatory Support (INTERMACS). Circ Heart Fail 9: e003157.
  10. Kirklin JK, Naftel DC, Pagani FD, Kormos RL, Stevenson L, et al. (2012) Long-term mechanical circulatory support (destination therapy): on track to compete with heart transplantation?. J Thorac Cardiovasc Surg 144: 584–598.
  11. Kirklin JK, Naftel DC, Kormos RL, Stevenson LW, Pagani FD, et al. (2010) Second INTERMACS annual report: more than 1,000 primary left ventricular assist device implants. J Heart Lung Transplant 29: 1–10.
  12. Sengupta PP, Korinek J, Belohlavek M, Narula J, Vannan MA, Khandheria BK et al. (2006) Left ventricular structure and function: basic science for cardiac imaging. J Am Coll Cardio 48:1988–2001.
  13. Patolla V, Patten R, Denofrio D, Konstam MA, Krishnamani R, et al. (2009) The effect of ventricular assist devices on post transplant mortality in analysis of the United Network for organ sharing thoracic registry. J Am Coll Cardiol 5:264–271.
  14. Holman W, Pamboukian S, Blood M, Tallaj J, McGiffin D, et al. (2005) Managing Device Infections: Are We Progressing or Is Infection an Insurmountable Obstacle?. ASAIO Journal 51: 452–455.
  15. McIlvennan CK, Magid KH, Ambardekar AV, Thompson JS, Matlock DD, et al. (2014) Clinical outcomes after continuous-flow left ventricular assist device: a systematic review. Circ Heart Fail 7: 1003–1013.
  16. Reilly M, Wiegers S, Cucchiara A, O’Hara ML, Plappert T, et al. (2000) Frequency, risk factors, and clinical outcomes of left ventricular assist device-associated ventricular thrombus. The American Journal of Cardiology 86: 1156–1159.
  17. Crestanelloa J, Orsinellib D, Firstenberga M, Sai-Sudhakara C (2009) Aortic valve thrombosis after implantation of temporary left ventricular assist device. Interactive CardioVascular and Thoracic Surgery 8: 661–662.
  18. Mudd JO, Cuda JD, Halushka M, Soderlund KA, Conte JV, et al. (2008) Fusion of aortic valve commissures in patients supported by a continuous axial flow left ventricular assist device. J Heart Lung Transplant 27: 1269–1274.
  19. Rose AG, Park SJ, Bank AJ, Miller LW (2000) Partial aortic valve fusion induced by left ventricular assist device. Ann Thorac Surg 70: 1270–1274.
  20. Connelly JH, Abrams J, Klima T, Vaughn WK, Frazier OH (2003) Acquired commissural fusion of aortic valves in patients with left ventricular assist devices. J Heart Lung Transplant 22: 1291–1295.
  21. Mitamura Y, Yozu R, Tanaka T, Yamazaki K. (1991) The valvo-pump. An axial, nonpulsatile blood pump. ASAIO Trans 37: M510–512.
  22. Mitamura Y, Nakamura H, Okamoto E, Yozu R, Kawada S, et al. (1999) Development of the valvo pump: An axial flow pump implanted at the heart valve position. Artif Organs 23: 566–571.
  23. Li GR, Ma WG, Zhu XD (2001) Development of a new left ventricular assist device: the dynamic aortic valve. ASAIO J 47: 257–60.
  24. Yamazaki K, Umezu M, Koyanagi H, Outa E, Ogino S, Otake Y, et al. (1993) Development of a miniature intraventricular axial flow blood pump. ASAIO J 39: 224–230.
  25. Yamazaki K, Kormos RL, Litwak P, Tagusari O, Antaki JF, Kameneva M, et al. (1997) Long-term animal experiments with an intraventricular axial flow blood pump. ASAIO J 43: 696–700
  26. Qian KX, Wang DF, Topaz S, Ru WM, Zeng P, et al. (2007) Novel totally implantable trans-ventricular and cross-valvular cannular pump with rolling bearings and purge system for recovery therapy. Journal of Medical Engineering & Technology 131: 10–13.
  27. Qian KX, Wang DF, Topaz S, Zeng P, Yuan HY, et al. (2005) World-first implantable aortic valvo pump (IAVP) with sufficient haemodynamic capacity. Journal of Medical Engineering & Technology  6: 302–304.
  28. Qian KX (2006) An implantable aortic valvo-pump for destination therapy. Cardiovasc Eng 6: 41–43.
  29. Qian K X, Wang D F, Topaz S, Ru W M, Zeng P, et al. (2007) World-smallest LVAD with 27 g weight, 21 mm OD and 5 l min-1 flow with 50 mmHg pressure increase. Journal of Medical Engineering & Technology 31: 181–184.

Social Learning in Birds Studied by Cross-Fostering in the Wild

Abstract

Social learning is widespread in nature and important for the behaviour, ecology and conservation of animals. We applied a method of cross-fostering between passerine birds in woodland areas in Norway, including great tits Parus major, blue tits Cyanistes caeruleus, and pied flycatchers Ficedula hypoleuca. When cross-fostering between tit species, the offspring sexually mis-imprinted on the foster species. Survival rate was similar to the controls but mating success was strongly reduced and mixed pairings occurred between cross-fostered birds of the two species, resulting in one case of hybridization. Song was affected, but the extent showed great variation among males. Male pied flycatchers raised by tits also included strophes from the foster species in their song, in particular if they had been raised together with siblings of the foster species. However, surprisingly, in flycatchers, mate choice was not affected by cross-fostering, indicating a different mechanism between song learning and mate choice. In tits, choice of nest site was affected by the cross-fostering, the birds taking characteristics of the natal nest site into account, and the behaviour of members of their foster parent species. Cross-fostering had a strong effect on foraging behaviour in terms of spatial location of foraging sites and the type of prey items provided to the young. Learning foraging techniques within the natal habitat may explain why prey provided by immigrant tits new to the study area differed from those provided by local recruits. We discuss how social learning may affect the evolution, behaviour and ecology of these birds, including the evolution of nest parasitism, and how cross-fostering among species may be used in management programs of endangered species.

Introduction

During the last decades, it has been recognized that social learning is widespread in nature and strongly affects evolution, behaviour and ecology of animals, and is thus also significant for conservation [1]. Studies in captivity, with control of the rearing environment, have provided the most convincing evidence whereas less is known form the wild. We studied social learning in three hole-nesting passerine birds in woodlands in Norway, namely in the great tit Parus major, the blue tit Cyanistes caeruleus, and the pied flycatcher Ficedula hypoleuca. The species are widespread in Europe and on our study area, use nest boxes almost exclusively for breeding. The return rate of birds raised locally has been sufficiently high (5–10% of offspring banded) to study the significance of early social learning throughout a bird´s life.

The study began in 1995 in an effort to explain why only about 1% of bird species are obligate, interspecific nest parasites, although female birds are often away from the nest during the egg laying period, leaving an opportunity for females of other species to deposit an egg there to reduce their own cost of breeding. We transferred eggs between nests to simulate nest parasitism between species and this led to studies of how the cross-fostering affected social learning of several aspects of behaviour. The main results are summarized and discussed below, including how cross-fostering may be used in management programs of endangered species.

Material and Methods

We cross-fostered birds in mixed deciduous – conifer woodlands near Oslo, Norway, during 1995 – 2017. Both whole clutches and single eggs were swapped between nests to study the effect of sibling species on the degree of imprinting. All nestlings were ringed with a numbered metal ring, and adults were ringed with various combinations of plastic leg colour rings, allowing us to follow individual birds for life. Because the birds almost exclusively used our nest boxes for breeding, unringed birds were assumed to be immigrants to the study area, possibly having been raised in a different habitat [2]. The study complied with the current laws of Norway and was approved by the animal welfare committee.

Results and Discussion

Mate Choice and Brood Parasitism

The cross-fostered eggs and nestlings were accepted and cared for by their hosts, and they recruited into the adult population with a similar frequency as the controls [3,4]. However, in tits, most of the cross-fostered birds became sexually mis-imprinted, trying to mate with a member of the foster species. Therefore, many did not succeed in pairing with a conspecific but they often mated with a member of the other species that had also been cross-fostered. Over the years, more than 30 such mixed pairs were found (T. Slagsvold, unpublished data). Their eggs often did not hatch, but occasionally the female hatched nestlings of her own species which had resulted from extra-pair copulation with a conspecific male that was not her social partner. Only one case of mixed-pairings resulted in a hybrid (between a female great tit and a male blue tit), to our knowledge the only hybrid known between the two species.

We tested the degree of sexual mis-imprinting by presenting a live, caged bird on their territory. The cross-fostered tits typically attacked a same-sex member of the foster species much more than a conspecific rival, showing that early social learning influences intrasexual species recognition in these birds [5]. The mis-imprinting continued for life [6]. In contrast, pied flycatchers that were raised by tits did not become sexually mis-imprinted as shown by their responses to live, caged birds upon arrival in spring [3,4]. Perhaps the host species was too different in appearance, and the flycatchers overwinter in tropical Africa where the two species of tits are not found. Species recognition appears to be more innate in flycatchers than in tits [7]. Because of polygyny, many flycatchers are raised without a male present, and so an innate species recognition mechanism may have evolved to allow identification of conspecific males. In pied flycatchers, males and females usually differ in plumage colour and mate choice is very rapid, often taking only a few hours [8].

In nature, great tits and blue tits are not parasitized by other bird species. Experiments with such birds are needed to study how parasitism can start in absence of traits coevolved in an arms race with the host. We conclude that sexual imprinting may constrain the evolution of brood parasitism. It is a puzzle how some species have solved the problem [9,10]. However, as mentioned above, pied flycatchers do not become sexually mis-imprinted when raised by a heterospecific host. Therefore, species with an innate species recognition mechanism may more likely evolve interspecific nest parasitism.

Social Dominance, Stress, Mate Guarding, Paternity and Sex Ratio

In winter, cross-fostered tits were subordinate to conspecific controls at feeding stations although they were not smaller-sized [11]. They also seemed to suffer higher levels of stress, as measured by corticosterone in the blood, showing that rearing conditions may have long-term consequences for stress responsiveness in free-living birds [12]. Probably because of the mis-imprinting, cross-fostered male tits guarded their females less during the fertile period of their mate than did controls [13] but apparently this did not result in loss of paternity [14]. For an unknown reason, broods with at least one cross-fostered parent contained relatively more male offspring than did control broods [15].

Song

In all three species studied, cross-fostered males included strophes from the foster species when display-singing in spring. However, the variation among males was great; in the tits, some cross-fostered males only sung strophes of the foster species, some only strophes of their own species and some a mixture of the two [16,17]. Play-back studies showed that territorial cross-fostered male tits responded more strongly than controls to heterospecific song than to conspecific song [18]. Thus, social learning strongly influenced both inter- and intraspecific communication. Tits of both sexes also produced warning calls that differed according to the species they had been raised by [10]. Overall, males appear to prefer vocal tutors that visually resemble their social father although their social mother´s appearance and behaviour may also influence the preference [17].

The song of pied flycatchers is much more complex than the song of tits, but even in this species, song was heavily affected by cross-fostering. If the bird had been raised both with foster parents and alongside siblings of the foster species then the strophes almost perfectly resembled those of the host species [19]. However, surprisingly, as mentioned above, mate choice in the flycatcher was not affected, indicating a different mechanism between song learning and mate choice.

Choice of Nest Site

Nest boxes were of two sizes, and most great tits used the larger ones and most blue tits the smaller. In both species, choice of nest box was affected by treatment; cross-fostered birds took the size of their natal nest box into account (vertical transmission of preference), and also the behaviour of members of their foster species (horizontal transmission of preference). However, although effects were statistically significant, the nest site choice seemed mainly to be innate [20].

Foraging

Blue tits typically forage higher above the ground, and more on twigs, than great tits, and they also feed on smaller prey. In both tit species, cross-fostering had a strong effect on the foraging and it lasted for life, the birds apparently learning from their foster parents [21]. This included both choice of foraging site [21], and which prey items they provided to the young [22]. The effect of the cross-fostering constituted about half of the difference in prey items between these birds and the controls. Cross-fostering also affected how parents chose prey items when the food demands of their offspring changed [23].

In tits, prey choice differed between immigrant and local recruits and we suggested this was a result of social learning in different natal habitats. Immigrant great tits provided more brown larvae and fewer green ones to their nestlings whereas in blue tits, a difference was found in prey size. Such foraging differences also held true within pairs, where one parent was an immigrant and the other was a local recruit, and thus when confounding factors like habitat quality, year and time of season, and the weather conditions during the video-filming were taken into account [2]. In both species, the offspring stay with their parents for about three weeks after leaving the nest and then learn foraging behaviour from their parents. The differences between the two groups of birds in prey types differed most in yearling birds. Apparently, many immigrants had been raised in different and less productive forest habitats and it took some time until they were able to forage optimally after they settled in a new habitat after natal dispersal. In great tits, immigrant females laid fewer eggs than local recruits, and laying date was also affected, presumably because the birds were not fully adapted to the new local micro-habitat [2].

There is great variation in feeding habits and type of parental care among bird species. For instance, precocial birds start self-feeding soon after hatching but altricial birds are characterized by a long period of parental care after hatching during which vertical transmission of skills can take place. However, learning by horizontal transmission after a bird has left its family may also be important, as demonstrated in diffusion experiments in tits [24]. We conclude that early learning is crucial for foraging behaviour later in life, and thus may affect the extent of natal dispersal, choice of habitat, and breeding success.

Cross-Fostering As A Management Tool

In birds, cross-fostering within and between species has been used to save endangered species. The case with the black robin Petroica traversi in New Zealand has been a promising example [25]. When a population is almost extinct, a few members may be brought into captivity to produce successive clutches if the eggs are removed. These extra eggs (or chicks) may then be transferred to nesting pairs of the same species in the wild (e.g. if eggs of natural nests suffer from contamination), or given to another species to rear. Here I summarize how knowledge gained from our cross-fostering studies may help such programs to succeed.

IJVB 2019-111 - Tore Slagsvold USA_F1

Figure 1. Male blue tit providing food to a brood containing a cross-fostered pied flycatcher chick alongside blue tit siblings. The display song of such cross-fostered flycatchers included strophes typical for the host species. However, they did not become sexually mis-imprinted on the host and bred successfully with a conspecific mate.

Pied flycatcher nestlings thrived well in great tit and blue tit nests [4] but the reverse was not true. This was not because flycatcher parents rejected the tit nestlings but because the nestlings could not swallow the prey delivered by their foster parents [26]. Tit parents provide mostly soft prey items, like caterpillars, whereas flycatchers often bring adult insects harder to ingest. Therefore, great care is needed to find a suitable host species, always starting with a few temporary trials to test for negative effects. If raised together with heterospecific siblings, it is important that the cross-fostered nestlings do not hatch later than their nest mates, in particular if they are smaller and less competitive than those of the host species [9]. Thus, species with similar length of the incubation period should be preferred. Typically, obligate nest parasites in the wild are larger than their host species and have shorter incubation periods. If a smaller species is used as host in a conservation program, all host eggs should be removed to avoid suffering of host nestlings and the number of nestlings cross-fostered per host nest should also be carefully considered so parents have enough resources to rear the brood. In our study, to ensure survival, we let blue tit parents raise fewer foster great tits than would be typical of conspecific blue tit broods. Swapping of whole clutches may be better than swapping single eggs because of less risk of mis-imprinting when raised with conspecific siblings in the foster nests [10,19].

Many of the cross-fostered tits became sexually mis-imprinted on their host species and so failed to pair with a conspecific, especially as yearlings. However, the mis-imprinting was not transferred across generations because offspring of fostered birds in the next generation showed no sign of mis-imprinting with regard to mate choice [27] and song [17]. Hence, the bottleneck of using heterospecific cross-fostering to save endangered species seemed to be the first breeding season and the first generation. When cross-fostering is applied, one should also consider a risk of hybridization. In our case, the three model species were apparently too distant genetically for this to be a problem.

Pied flycatchers raised by tits did not become sexually mis-imprinted. Although the males sung strophes similar to those of the foster species, they still attracted conspecific females, and some males even became polygynous [4]. Hence, cross-fostering as a management tool may be particularly useful for saving such species for which mate recognition is innate: even when members of a long-distant migrant is raised by a resident species, they may return and breed just as successfully as controls raised by their own species. We conclude that early social learning may affect the evolution, behaviour and ecology of birds, and that cross-fostering may be used with caution in management programs of endangered species.

Acknowledgement

The author is indebted to all the people that have assisted in the field during the extended study period, and to Karen Wiebe for comments on the manuscript.

References

  1. Brakes P, Dall SRX, Aplin LM, Bearshop S, Carroll EL, et al. (2019) Animal cultures matter for conservation. Science 363: 1032–1034.
  2. Slagsvold T, Wiebe KL (2018) Immigrants and locally recruited birds differ in prey delivered to their offspring in blue tits and great tits, Animal Behaviour 139: 127–135.
  3. Slagsvold T, Hansen BT, Johannessen LE, Lifjeld JT (2002) Mate choice and imprinting in birds studied by cross-fostering in the wild. Proceedings of the Royal Society of London B 269: 1449–1455.
  4. Slagsvold T (2004) Cross-fostering of pied flycatchers (Ficedula hypoleuca) to heterospecific hosts in the wild: a study of sexual imprinting. Behaviour 141: 1079–1102.
  5. Hansen BT, Slagsvold T (2003) Rival imprinting: interspecifically cross-fostered tits defend their territories against heterospecific intruders. Animal Behaviour 65: 1117–1123.
  6. Hansen BT, Johannessen LE, Slagsvold T (2008) Imprinted species recognition lasts for life in free-living great tits and blue tits. Animal Behaviour 75: 921–927.
  7. Sæther SA, Sætre G-P, Borge T, Wiley C (2007) Sex chromosome-linked species recognition and evolution of reproductive isolation in flycatchers. Science 318: 95–97.
  8. Dale S, Slagsvold T (1996) Mate choice on multiple cues, decision rules and sampling strategies in female pied flycatchers. Behaviour 133: 903–944.
  9. Slagsvold T (1998) On the origin and rarity of interspecific nest parasitism in birds. American Naturalist 152: 28–36.
  10. Slagsvold T, Hansen BT (2001) Sexual imprinting and the origin of obligate brood parasitism in birds. American Naturalist 158: 354–367.
  11. Hansen BT, Slagsvold T (2004) Early learning affects social dominance: interspecifically cross-fostered tits become subdominant. Behavioral Ecology 15: 262–268.
  12. Landys MM, Goymann W, Slagsvold T (2011) Rearing conditions have long-term consequences for stress responsiveness in free-living birds. General and comparative endocrinology 174: 219–224.
  13. Hansen BT, Johannessen LE, Slagsvold T (2009) Interspecific cross- fostering affects mate guarding behaviour in great tits (Parus major). Behaviour 146: 1349–1361.
  14. Johannessen LE, Slagsvold T, Hansen BT, Lifjeld JT (2005) Manipulation of male quality in wild tits: effects on paternity loss. Behavioral Ecology 16: 747–754.
  15. Johannessen LE, Kristiansen L, Hansen BT, Slagsvold T (2009) Facultative adjustment of brood sex ratio in response to indirect manipulation of behaviour. Ethology 115: 1057–1065.
  16. Johannessen LE, Slagsvold T, Hansen BT (2006) Song structure and repertoire size affected by social rearing conditions: experimental evidence from the field. Animal Behaviour 72: 83–95.
  17. Eriksen A (2011) Song learning in Oscine songbirds. Tutor choice, timing, and the relationship with sexual imprinting. PhD, Department of Biosciences, University of Oslo, Norway.
  18. Hansen BT, Johannessen LE, Slagsvold T (2010) Interspecific cross- fostering of great tits (Parus major) by blue tits (Cyanistes caeruleus) affects inter- and intraspecific communication. Behaviour 147: 413–424.
  19. Eriksen A, Lampe H, Slagsvold T (2009) Interspecific cross-fostering affects song acquisition but not mate choice in pied flycatchers, Ficedula hypoleuca. Animal Behaviour 78: 857–863.
  20. Slagsvold T, Wigdahl Kleiven K, Eriksen A, Johannessen LE (2013) Vertical and horizontal transmission of nest site preferences in titmice. Animal Behaviour 85: 323–328.
  21. Slagsvold T, Wiebe KL (2007) Learning the ecological niche. Proceedings of the Royal Society of London B 274: 19–23.
  22. Slagsvold T, Wiebe KL (2011) Social learning in birds and its role in shaping a foraging niche. Philosophical Transactions of the Royal Society B 366: 969–977.
  23. Wiebe KL, Slagsvold T (2015) Foraging trade-offs between prey size, delivery rate and prey type: how does niche breadth and early learning of the foraging niche affect food delivery? Ethology 121: 101–1017.
  24. Aplin LM, Farine DR, Morand-Ferron J, Cockburn A, Thornton A et al. (2015) Experimentally induced innovations lead to persistent culture via conformity in wild birds. Nature 518: 538–541.
  25. Butler D, Merton D (1992) The black robin. Oxford University Press, Auckland.
  26. Turtumøygard T, Slagsvold T (2010) Evolution of brood parasitism in birds: constraints related to prey type. Behaviour 147: 299–317.
  27. Hansen BT, Johannessen LE, Slagsvold T (2007) No cultural transmission of species recognition between parents and offspring in free-living great tits and blue tits. Behavoral Ecology and Sociobiology 61: 1203–1209.

Time for New Recommendation of Upper Limit of Serum Vitamin D in Humans

Abstract

There is a continued debate and exchange of knowledge with respect to serum 25- hydroxyvitamin D (25(OH)D) cut-off levels. Based on our current knowledge it is time to reconsider our recommendations of the optimal level of serum 25(OH)D in the clinical setting and not only focus on low levels but also recommend an upper serum limit of around 125 nmol/L (40–50 ng/mL) among healthy and diseased.

Keywords

Vitamin D

Issues and Opinions

There is a continued debate and exchange of knowledge with respect to serum 25-hydroxyvitamin D (25(OH) D) cut-off in the lower end and when to start supplementation. This debate includes the general population as well as in a long list of diseases. The discussion of a cut-off level insufficiency and deficiency of25 mmol/L (10 ng/mL) and 50 mmol/L (20 ng/mL), respectively, is one debate another is the optimal level of serum 25(OH)D and of most importance a missing debate of a recommended upper limit.

It is well known that vitamin D plays an essential role in the regulation of metabolism, calcium and phosphorus absorption.Essentially, the effect of vitamin D is in the hydroxylated form 1,25-dihydroxy vitamin D. However, the effects of vitamin D are not limited to mineral homeostasis and skeletal health maintenance. The presence of Vitamin D Receptors (VDR) in other tissue and organs suggest that vitamin D physiology extends well above and beyond bone homeostasis in cell and animal studies. There has been an association of serum 25(OH)D deficiency to several diseases among others osteoporosis, cancers, autoimmune disorders, infectious diseases, cardiovascular disease, Type 2 Diabetes (T2D) and neurological disorders such as sclerosis [1]. Knowledge from the literature is that low levels are problematic and strong associations are published indicating higher morbidity and mortality among individuals with the low levels of serum 25(OH)D<50 mmol/L (20 ng/mL). On the other hand, clinical randomized studies do not so far support the beneficial effect of vitamin D supplementation other than in osteoporosis, falls and fractures.

A vitamin D dose range of 20–25 µg (800–1000 IU) per day has been effective in several studies whereas lower doses have generally been ineffective. Further hereto several doses above this range have increased the risk of falls and therefor the recommendation is that older adults with serum 25(OH)D levels < 40 nmol/L likely have fewer falls if supplemented with 20–25 µg (800–1000 IU) per day of vitamin D [2]. A recent RCT showed maximum decrease in falls at 12-month serum 25(OH)D level of 80–95 nmol/L (32–38ng/mL) and of extreme importance is that the faller rates increase when the serum 25(OH)D level exceed 40–45 ng/mL (100–112.5 nmol/L) [3].

We have learned from clinical randomized studies (RCT) with high-dose vitamin D supplementation that for mental health benefit is seen when normalizing. But no benefit is seen of higher high levels of monthly doses of vitamin D compared with the standard monthly dose of 600 µg (24,000 IU) [4]. Monthly high-dose vitamin D supplementation does not prevent Cardio-Vascular Disease (CVD) [5] and a combined study evaluating supplementation with vitamin Ddid not show a lower incidence of cardiovascular events or invasive cancer than placebo [6]. Long-term vitamin Dsupplementation, which increased mean 25-hydroxyvitamin D3 concentration >100 nmol/L for 18 months, had no effect on systolic or diastolic BP in predominantly white, healthy adults without severe vitamin D deficiency [7].In a long-time the authors of a RCT showed no significant lung function improvements in a study of high-dose vitamin D versus placebo [8]. It is often claimed that vitamin D might protect colo-rectal cancer but among patients with metastatic colo-rectal cancer, addition of high-dose vitamin D3 vs standard-dose of vitamin D3 to standard chemotherapy was inconclusive indicating the need of further and larger multicenter randomized clinical trials [9]. Related hereto, patients with digestive tract cancer, vitamin D supplementation, compared with placebo, did not result in significant improvement in relapse-free survival at 5 years [10]. Looking at neurology, the latest published meta-analysis of vitamin D supplementation in sclerosis were including all the RCT’s and highlighted the very low-quality of these and the missing evidence of effect as data suggests no benefit of vitamin D for patient-important outcomes among people with multiple sclerosis (MS). Several studies inMS is initiated and will likely provide further evidence that can be included in a future updates [11]. A meta-analysis of 19 RCT’s of vitamin D supplementation in T2D patients shows that supplementation seem to improve HbA1c, insulin resistance, and insulin in short-term intervention, suggesting that vitamin D can be considered as a therapeutic agent along with the other treatments for T2D if patients are supplemented at low serum levels [12]. In patients with pre-diabetes and hypovitaminosis D, high dose vitamin D improves insulin sensitivity and decreases risk of progression toward diabetes [13]. In thyroid disease no significant changes were observed in the serum levels of T3 and T4 hormones to vitamin D supplementation and therefore further well controlled, large, longitudinal studies are needed [14]. In all these executed studies the included patients mostly improve serum 25(OH)D from low to normal levels and in few cases to high levels and as presented the risk of fall increases.

Several epidemiologic studies support a  serum 25(OH)D upper limit of 100–125 nmol/L (40–50 ng/mL) when evaluating all-cause mortality [15,16], CVD [17] and cancer [18]. The J-shaped curve indicate significant higher risk than benefits at levels higher than 100–125 nmol/L (40–50 ng/mL) and the above mentioned high-dose RCT’s does not report on benefits.

In the literature the excess and toxicity levels of serum 25(OH)D are as high as 250 nmol/L (100 ng/mL) and 325 nmol/L (150 ng/mL), respectively. Based on the literature we have no evidence in support of a normal level up to 250 nmol/L (100 ng/mL).

I think it is time to reconsider our recommendations of the optimal level of serum 25(OH)D in the clinical setting and not only focus onlow levels but also recommend an upper serum limit of around 125 nmol/L (40–50 ng/mL) among healthy and diseased (Table 1).

Table 1. Diagnostic clinical cut-offs of levels of serum 25(OH)D

Serum 25(OH) Level (nmol/L)

Serum 25(OH) Level (ng/mL)

Laboratory Diagnosis

<25

<10

Insufficiency

<50

25

Deficiency

50–125

25–50

Normal

>125

>50

Excess

>325

>150

Intoxication

References

  1. Holick MF (2017) The vitamin D deficiency pandemic: Approaches for diagnosis, treatment and prevention. Rev Endocr Metab Disord 18: 153–165.
  2. Dawson-Hughes B (2017). Vitamin D and muscle function. J Steroid Biochem Mol Biol 173: 313–316.
  3. Smith LM, Gallagher JC, Suiter C (2017). Medium doses of daily vitamin D decrease falls and higher doses of daily vitamin D3 increase falls: A randomized clinical trial. J Steroid Biochem Mol Biol 173: 317–322.
  4. Gugger A, Marzel A, Orav EJ, Willett WC, Dawson-Hughes B et al (2019) Effect of Monthly High-Dose Vitamin D on Mental Health in Older Adults: Secondary Analysis of a RCT. J Am Geriatr Soc..
  5. Scragg R, Stewart AW, Waayer D, Lawes CMM, Toop L, et al (2017) Jr. Effect of Monthly High-Dose Vitamin D Supplementation on Cardiovascular Disease in the Vitamin D Assessment Study : A Randomized Clinical Trial. JAMA Cardiol 2: 608–616.
  6. Manson JE, Cook NR, Lee IM, Christen W, Bassuk SS, et al (2019) Vitamin D Supplements and Prevention of Cancer and Cardiovascular Disease. N Engl J Med 380: 33–44.
  7. Scragg R, Slow S, Stewart AW, Jennings LC, Chambers ST, et al (2014) Long-term high-dose vitamin D3 supplementation and blood pressure in healthy adults: a randomized controlled trial. Hypertension 64: 725–730.
  8. Sluyter JD, Camargo CA, Waayer D, Lawes CMM, Toop L, et al (2017) Effect of Monthly, High-Dose, Long-Term Vitamin D on Lung Function: A Randomized Controlled Trial. Nutrients 9(12).
  9. Ng K, Nimeiri HS, McCleary NJ, Abrams TA, Yurgelun MB, et al (2019) Effect of High-Dose vs Standard-Dose Vitamin D3 Supplementation on Progression-Free Survival Among Patients With Advanced or Metastatic Colorectal Cancer: The SUNSHINE Randomized Clinical Trial. JAMA 321: 1370–1379.
  10. Urashima M, Ohdaira H, Akutsu T, Okada S, Yoshida M, et al (2019). Effect of Vitamin D Supplementation on Relapse-Free Survival Among Patients With Digestive Tract Cancers: The AMATERASU Randomized Clinical Trial. JAMA 321: 1361–1369.
  11. Jagannath VA, Filippini G, Di Pietrantonj C, Asokan GV, Robak EW, et al (2018). Vitamin D for the management of multiple sclerosis. Cochrane Database Syst Rev 9: CD008422.
  12. Hu Z, Chen J, Sun X, Wang L, Wang A (2019) Efficacy of vitamin D supplementation on glycemic control in type 2 diabetes patients: A meta-analysis of interventional studies. Medicine (Baltimore) 98: e14970.
  13. Niroomand M, Fotouhi A, Irannejad N, Hosseinpanah F (2019). Does high-dose vitamin D supplementation impact insulin resistance and risk of development of diabetes in patients with pre-diabetes? A double-blind randomized clinical trial. Diabetes Res Clin Pract 148: 1–9.
  14. Chahardoli R, Saboor-Yaraghi AA, Amouzegar A, Khalili D, Vakili AZ, et al (2019) Can Supplementation with Vitamin D Modify Thyroid Autoantibodies (Anti-TPO Ab, Anti-Tg Ab) and Thyroid Profile (T3, T4, TSH) in Hashimoto’s Thyroiditis? A Double Blind, Randomized Clinical Trial. Horm Metab Res 51: 296–301.
  15. Durup D, Jorgensen HL, Christensen J, Schwarz P, Heegaard AM, et al (2012). A reverse J-shaped association of all-cause mortality with serum 25-hydroxyvitamin D in general practice: the CopD study. J Clin Endocrinol Metab 97: 2644–2652.
  16. Sempos CT, Durazo-Arvizu RA, Dawson-Hughes B, Yetley EA, Looker AC, et al (2013). Is there a reverse J-shaped association between 25-hydroxyvitamin D and all-cause mortality? Results from the U.S. nationally representative NHANES. J Clin Endocrinol Metab 98: 3001–3009.
  17. Durup D, Jorgensen HL, Christensen J, Tjonneland A, Olsen A, et al (2015). A Reverse J-Shaped Association Between Serum 25-Hydroxyvitamin D and Cardiovascular Disease Mortality: The CopD Study. J Clin Endocrinol Metab 100: 2339–2346.
  18. Vojdeman FJ, Madsen CM, Frederiksen K, Durup D, Olsen A, et al (2019). Vitamin D levels and cancer incidence in 217,244 individuals from primary health care in Denmark. Int J Cancer 145: 338–346.

Comparison of Inositol, Metformin and Oral Contraceptives in Polycystic Ovary Syndrome

Abstract

Polycystic Ovary Syndrome (PCOS) is a common endocrine disorder that affects women in reproductive age and associates variable degrees of hyperandrogenism, anovulation and/or Polycystic Ovary Morphology (PCOM), generating different phenotypes. Due to its heterogenic etiology, there is no general treatment, but rather an individual approach for each case.

The aim of this study is to detect possible variations in clinical and biochemical outcome in PCOS cases, after treatment with combined oral contraceptive pills, metformin or inositols.

This prospective study presents 56 patients in fertile age (18–36 years old), diagnosed with PCOS, which received treatment with oral contraceptives (30mg Etinylestradiol+Dienogest), metformin (2x500mg) or inositols (2g Myoinositol). Patients were evaluated clinically and biochemically at baseline, at 3 and 6 months.

In patients treated with contraceptive pills, LH levels decreased by 77.71% after 3 months, and LH:FSH ratio with 54.01% (p=0.0005) after 6 months. There was a 52% improvement in PCOM at ultrasound examination from 3 months treatment on (p<0.0001), but no significant decrease in menstrual cycle length. Metformin proved superior in decreasing abdominal circumference and HbA1c. The inositol group had the most significant improvement after 3 months, all parameters being significantly improved apart from Ferriman-Gallwey score; menstrual cycle pattern improved significantly after 3 months of treatment (54.7%, p=0.0008).

There were significant differences in outcomes for clinical and biochemical parameters between the different treatments, yet none of them turned out superior in all main signs and symptoms, (hyperandrogenism, ovarian dysfunction and polycystic morphology). Treatment in PCOS patients should be individualised to patient’s symptoms and needs.

Keywords

Hyperandrogenism, PCOS phenotypes, Inositol, Metformin, Contraceptives

Introduction

Although polycystic ovary syndrome (PCOS) represents one of the most common endocrine disorders, affecting about one in ten women in fertile age (8-13%), it is still under diagnosed and its mechanisms not completely understood. Implications are wide and include metabolic, reproductive and psychological components. Infertility, insulin resistance and increased cardiovascular risk are the main concerns when managing these patients [1-3].

PCOS is mostly an exclusion diagnosis. Conditions like thyroid disorders, 21-hydroxylase deficiency, hyperprolactinemia, Cushing’s syndrome, hyper androgenic tumors (ovarian or adrenal), ovarian stromal hyperplasia, ovaries with physiological follicles, or the use of virilizing drugs need to be ruled out [4-6].

The confirmation of PCOS diagnosis is still made using the Rotterdam criteria and must include minimum two out of the three criteria: oligomenorrhea / Ovulatory Dysfunction (OD), clinical or biochemical evidence of hyperandrogenism (HA) and Polycystic Ovary Morphology (PCOM). In accordance with the variation of symptoms, four different phenotypes have been described. Phenotype A comprises all three elements for diagnosis (HA, OD and PCOM), phenotype B includes HA and OD, phenotype C – HA and PCOM and phenotype D, with OD and PCOM, but not HA. The first two are considered ”classic forms” of PCOS and are more frequently associated (up to 85%) with insulin resistance and variable metabolic alterations, as opposed to phenotype D (”non-HA”), where metabolic impairment was found in fewer patients, being at a lower risk to develop diabetes [1,3,7,8].

When diagnosing a new case of PCOS, phenotype assessment is required, being highly suggestive for future possible complications and more importantly for choosing the most appropriate and individualized therapeutic approach. Treatment in PCOS is long-term and may need adjustments in evolution. Treatment should target weight loss, ameliorate hormonal and reproductive disturbances and prevent comorbidities [9].

Patients should be counseled to make diet and lifestyle changes, as PCOS usually progresses with weight gain, which can precipitate development of comorbidities. Also, physical activity has been found to improve fertility and live births in women with reproductive problems [10].

Pharmacological intervention is needed in most cases, its use in PCOS is off-label but it is evidence-based. Oral Contraceptive Pills (OCPs) are recommended for women with HA and oligomenorrhea who do not target pregnancy, with favorable outcomes on hirsutism, acne, alopecia, menstrual cycle length and decreasing chance of developing endometrial hyperplasia. For achieving fertility, first-line treatment is Letrozole, with a lower risk of multiple pregnancies, but clomiphene citrate and/or metformin can be considered. Metformin is an insulin sensitizer used with success in patients with metabolic disease; it has been proved to reduce HA, normalize menstrual cycle and restore ovulation. Inositols, represented by Myo-Inositol (MI) and D-chiro-Inositol (DCI) are molecules that act as insulin messengers. Correcting a possible deficiency may improve HA, ovulatory and metabolic aspects of PCOS, but there is not enough evidence of their benefits [1,6,11-13].

The aim of the present study was to detect possible variations in clinical and biochemical outcomes in PCOS cases, after treatment with combined oral contraceptives (30mg Etinylestradiol + Dienogest), metformin (2 × 500mg) or inositols (2g Myo-Inositol). Clinical and biochemical parameters were compared at baseline, at 3 and 6 months follow up and a correlation was studied for each treatment choice.

Materials and Methods

Seventy-four women in fertile age (between 18 – 36 years old), diagnosed with PCOS, were included in the study starting with January 2017. The patients were recruited from Dr. D Medical Center in Timisoara, Romania.

Inclusion Criteria. Patients with a clear diagnosis of PCOS were included in the study (minimum 2 out of 3 Rotterdam criteria: HA, OA, PCOM), who agreed to evaluation and stayed compliant to the given treatment for the following 6 months (metformin, inositols or OCPs); other disorders causing hyperandrogenism (ovarian or pituitary tumors, Cushing’s disease, iatrogenic causes) have been excluded.

Each participant signed a written informed consent and the ethics committee approved the study of the Medical Center.

All subjects were evaluated clinically, biochemically and with imaging techniques.

Initial hormonal evaluation included Luteinizing Hormone (LH), Follicle Stimulating Hormone (FSH), LH: FSH ratio, free testosterone, Dehydroepiandrosterone sulfate (DHEA-S), prolactin (PRL), cortisol and hemoglobin A1c(HbA1c).

Clinical examinaton was performed at baseline, 3 and 6 months, including anthropometric measurements: height, weight, body mass index (BMI) and abdominal circumference. Hirsutism was evaluated using the Modified Ferriman-Gallwey score; a value ≥ 8 was assessed as hirsutism [14].

The maximum time of amenorrhea was assessed as a measure of OD at baseline. In the follow-up examination at 3 and 6 months, the maximum time of amenorrhea was exchanged by menstrual cycle length, as a measure of OD. When comparing maximum time of amenorrhea with menstrual cycle length, the number of months was multiplied by 28 to yield the consecutive time in days.

In order to determine presence of PCOM, transvaginal ultrasound of the ovaries was performed. Positive for PCOM were considered cases with more than twelve follicles or an ovarian volume greater than 10 ml [1].

A prospective evaluation of clinical parameters was made: BMI, Ferriman-Gallwey (FG) score, menstrual cycle’s assessment. Hormonal and metabolic parameters were re-evaluated after 6 months of treatment, as well as ultrasound appearance.

The Therapeutic Intervention. The therapeutic intervention included three treatment choices and the study group was subdivided in 3 groups, according to their treatment option: 24 patients in study group 1 were treated with inositols (2g Myo-Inositol). 25 patients in study group 2 were treated with OCPs (30mg Etinylestradiol + Dienogest), and 25 patients in study group 3 were treated with metformin (Metformin 2 x 500mg).

Statistical Analysis was carried out using SPSS and a threshold value for probability (p) < 0.05 was considered statistically significant in order to reject the null hypothesis. The data was expressed as mean values and standard deviations. The clinical and biochemical characteristics were compared to each other between the study groups using the unpaired t-test; the paired t-test was applied for different parameters comparison at baseline and post-treatment. Multifactorial analysis of variance (ANOVA) test was used univariate to compare the three study group parameters at baseline, then it was applied multivariate to compare outcomes for all study groups and to detect differences in parameter values at baseline, 3 and 6 moths of follow-up.[15]

Results

The entire study group included 74 patients with a mean age of 26.91 ± 3.92, between 18 and 36 years old. The cases were subdivided in 3 categories as follows: study group 1 represents the patients that received treatment with Inositol and includes 24 patients, study group 2 is made up of 25 patients treated with OCPs and study group 3 includes 25 patients that received treatment with Metformin.

The evaluated characteristics for the three study groups at baseline are presented in Table 1 as mean value ± standard deviation as well as the comparison of parameters at baseline between all three study groups using the monofactorial ANOVA test.

Table 1. Clinical and biochemical characteristics at baseline and value comparison using monofactorial ANOVA test for all studied parameters between study groups 1–3

Parameters

Group 1

Group 2

Group 3

F value

p value

Critical f value

BMI (kg/m²)

31.35
±5.52

25.71
±5.44

31.70
±4.45

10.77

0.0001

3.12

FG score

17.75
±2.21

16.84
±3.01

12.12
±3.15

28.92

< 0.0001

3.12

Max amenorrhea (months)

3.38
±2.14

1.24
±1.28

3.26
±1.82

11.55

< 0.0001

3.12

Abdominal circumference (cm)

100.00
±12.76

81.04
±12.74

99.92
±13.41

2.44

0.094

3.12

Free testosterone (mIU/ml)

0.02
±0.003

0.02
±0.01

0.0
1±0.01

7.72

0.001

3.12

DHEAS (mg/dl)

413.54
±30.25

411.44
±108.25

337.24
±95.62

6.52

0.003

3.12

PRL (mIU/ml)

591.46
±152.30

550.44
±117.36

374.12
±219.67

11.87

< 0.0001

3.12

LH (mIU/ml)

13.00
±3.75

13.996
±3.77

14.13
±3.80

0.68

0.508

3.12

FSH (mIU/ml)

5.27
±0.99

6.16
±1.59

5.54
±1.26

1.16

0.323

3.20

LH:FSH ratio

2.50
±0.78

2.37
±0.74

2.64
±0.74

0.79

0.459

3.12

Cortisol (mg/dl)

18.77
±4.13

17.15
±5.27

21.75
±5.00

5.90

0.004

3.12

HbA1c (%)

6.02
±0.59

5.85
±0.54

6.16
±0.74

1.49

0.233

3.12

A significant difference (p-value <0.05) was found in BMI (p=0.0001), FG score (p<0.0001), maximum amenorrhea (p<0.0001), testosterone level (p=0.001), DHEA-S level (p=0.003), prolactin (PRL) (p<0.0001) and cortisol levels (p=0.004).

Figure 1 presents the mean value of the studied parameters in group 1 (24 patients) at baseline and the evolution of parameters (mean values) after they started treatment with inositol, at 3 and 6 months follow-up.

EDMJ 2019-123 - Laura Cotoi Romania_F1

Figure 1. Study group 1: evolution of parameters (mean value) at baseline, and at 3 months and 6 months after initiating treatment with inositols

Figure 2 shows evolution for the mean value of the parameters for the 25 cases in group 2 initially and as tested parameters change after being treated with OCPs at3 and 6 months follow-up.

EDMJ 2019-123 - Laura Cotoi Romania_F2

Figure 2. Study group 2: evolution of parameters (mean value) at baseline, and at 3 months and 6 months after initiating OCP treatment

Figure 3 presents the summarized means of the parameters in group 3 after the 25 patients entered the program and were treated with metformin, changes in their testing parameters could be observed at respectively 3 and 6 months follow up.

EDMJ 2019-123 - Laura Cotoi Romania_F3

Figure 3. Study group 3: parameters evolution (mean value) at baseline and at 3 months and 6 months after metformin treatment

Data in Table 2 shows the presence of PCOM on ultrasound evaluation in study groups 1-3 at baseline and in evolution after starting each type of treatment respectively, at 3 and 6 months follow-up. For group 1, all 24 patients (100%) were positive at baseline examination, after 3 months the positive cases were reduced to 16 and 8 negatives and continued to decrease to 12 positives (50%) and 12 negatives at 6 months follow-up. For group 2, only 12 patients (48%) out of the total 25 were positive for PCOM at initial exam, and all of them became negative at 3 and 6 months after OCP treatment. In group 3, nineteen patients (76%) were PCOM positive at baseline, after 3 months of this reduced to 13 positives (52%) and 12 negatives and decreased further to 9 positives (36%) and 16 negatives at 6 months follow up.

Table 2. Ultrasound PCOM evaluation at baseline, 3 months and 6 months follow up in study groups 1-3

Parameter

Group 1 (inositol)

Group 2 (OCP)

Group 3 (metformin)

Evaluation

B

3m

6m

B

3m

6m

B

3m

6m

PCOM

Positive

24

16

12

12

0

0

19

13

9

100%

66.6%

50%

48%

0%

0%

76%

52%

36%

Negative

0

8

12

13

25

25

6

12

16

0%

33.4%

50%

52%

100%

100%

24%

48%

64%

In Table 3 the patient parameters are compared at baseline and 3 months of treatment in all three-study groups using the paired T-test. A cut-off for the p-value of 0.05 was considered as statistically significant. For study group 1, treated with inositol there was no change in FG score values. Statistically significant differences were seen in menstrual cycle length (p=0.006), abdominal circumference (p=0.01), testosterone levels (p<0.0001), PRL levels (p=0.011), LH levels (p=0.0002), FSH levels (p=0.013), LH:FSH ratio (p=0.001), HbA1c levels (p<0.0001) and at PCOM ultrasound evaluation (p=0.003). In group 2 that received OCPs as therapy for three months, significant differences have been detected for menstrual cycle length, PRL, LH, FSH levels and PCOM and for the metformin-treated group 3 statistically significant differences were found in menstrual cycle length, abdominal circumference, testosterone, LH levels and LH:FSH ratio.

Table 3. Statistical analysis: T-Test initial vs 3 months in study groups 1,2 and 3

Parameters

Group 1

Group 2

Group 3

t score

p value

        t score

p value

      t score

p value

Menstrual cycle

3.00

0.006

8.22

< 0.0001

3.81

0.0008

Abdominal circ

2.82

0.010

0.93

0.359

5.35

< 0.0001

Testosterone

5.91

< 0.0001

0.90

0.377

3.89

0.0007

PRL

2.75

0.011

5.00

< 0.0001

0.41

0.6836

LH

4.49

0.0002

9.53

< 0.0001

4.66

0.0001

FSH

-2.68

0.013

10.35

< 0.0001

0.23

0.8197

LH:FSH

3.84

0.001

0.28

0.783

4.05

0.0005

HbA1c

7.13

< 0.0001

-0.10

0.918

6.76

< 0.0001

PCOM

3.39

0.003

4.71

0.0001

1.6

0.1102

When comparing baseline group characteristics with the ones at 6 months of treatment (see Table 4 below), the improvement continued for all categories. In the inositolgroup 1, statistically significant values were attained for all evaluated parameters. In the 2nd group, treated with OCPs, significant improvement was found in menstrual cycle (p<0.0001), testosterone levels (0.047), PRL, FSH, LH levels and LH:FSH ratio, A1c and PCOM (p<0.0001) Abdominal circumference was also lower, but not significantly. For group 3, that received metformin treatment, statistically significant differences were seen in menstrual cycle length (p=0.0008), abdominal circumference (p<0.0001), testosterone levels (p=0.0003), LH levels (p=0.0001), LH:FSH (p=0.0002) and at ultrasound (p=0.0049).

Table 4. Statistical analysis: T-Test baseline vs 6 months of treatment for study groups 1,2 and 3

Parameters

Group 1

Group 2

Group 3

t score

p value

        t score

p value

      t score

p value

Menstrual cycle

3.00

0.006

8.88

< 0.0001

3.81

0.0008

Abdominal circ

5.77

< 0.0001

0.93

0.359

6.79

< 0.0001

Testosterone

8.09

< 0.0001

2.09

0.047

4.28

0.0003

PRL

3.24

0.004

6.00

< 0.0001

0.26

0.7993

LH

4.97

0.0001

14.92

< 0.0001

4.52

0.0001

FSH

-3.75

0.001

11.63

< 0.0001

-0.25

0.8071

LH:FSH

5.07

< 0.0001

7.18

< 0.0001

4.49

0.0002

HbA1c

4.80

0.0001

4.71

0.0001

3.10

0.0049

PCOM

3.00

0.006

8.88

< 0.0001

3.81

0.0008

Table 5 presents the difference between the three study groups for each parameter at baseline and 6 months, using the MANOVA test.

Table 5. MANOVA test: baseline vs 6 months – differences between groups

Parameters

F value

p value

Critical f value

Menstrual cycle

19.68

< 0.0001

3,06

Abdominal circ.

4.38

0.014

3,06

Testosterone

7,24

0,001

3,06

PRL

19,54

<0,0001

3,06

LH

30,53

<0,0001

3,06

FSH

34,85

<0,0001

3,06

LH:FSH

9,96

0,0001

3,06

eco PCOS

21,20

<0,0001

3,06

The data was compared initially and at 3 months of therapy for the study groups two by two, as shown in Table 6. When the inositol and OCP groups are compared, statistically significant differences are found for FG score, menstrual cycles, abdominal circumference, PRL, LH, FSH and ultrasound polycystic morphology. When groups 1 and 3 were compared, differences were only noticed for testosterone, PRL and menstrual cycles length and as for comparing groups 2 and 3 significant for FG score, menstrual cycles, abdominal circumference, LH, FSH and PCOM.

Table 6. T-Test baseline vs 3 months – study groups comparison

Parameters

group 1 vs group 2

group 1 vs group 3

group 2 vs group 3

t test

p value

t test

p value

t test

p value

FG score

5.40

< 0.0001

0.79

0.431

2.77

0.008

Menstrual cycle length

3.28

0.003

7.26

< 0.0001

-2.45

0.022

Abdominal circ.

4.89

< 0.0001

0.32

0.751

-4.62

< 0.0001

Testosterone

0.43

0.674

5.07

< 0.0001

1.12

0.275

PRL

3.33

0.002

4.74

< 0.0001

1.34

0.185

LH

7.90

< 0.0001

0.67

0.505

-7.72

< 0.0001

FSH

13.92

< 0.0001

0.63

0.530

-10.82

< 0.0001

LH:FSH

-0.24

0.809

0.07

0.948

0.26

0.796

HbA1c

-0.43

0.671

-0.42

0.679

-0.02

0.981

PCOM

6.78

< 0.0001

1.03

0.306

-5.10

< 0.0001

Groups were compared again after 6 months of treatment using the unpaired t-test. Results are shown in Table 7.

Table 7. T-Test baseline vs 6 months – study groups comparison

Parameters

group 1 vs group 2

group 1 vs group 3

group 2 vs group 3

t test

p value

t test

p value

t test

p value

Menstrual cycle length

6.84

< 0.0001

2.45

0.018

-2.45

0.022

Abdominal circ.

4.32

0.0001

4,08

0,0002

-0.20

0.843

Testosterone

0,93

0,361

5,13

<0,0001

0.77

0.445

PRL

4,56

0,0000

4,39

0,0001

0.92

0.363

LH

16,91

0,0000

0,18

0,856

-15.60

< 0.0001

FSH

16,51

0,0000

1,71

0,094

-14.85

< 0.0001

LH:FSH

5,48

0,0000

-1,22

0,230

-5.59

< 0.0001

PCOM

4,80

0,0001

0,98

0,333

-3.67

0.001

Discussion

A number of studies attempted to compare different treatment approaches for women with PCOS and data is still inconclusive, outcomes depending individually. While metformin and OCPs have been extensively studied, literature data on inositol therapy is still poor and needs further study. The present study aimed to compare inositol with the more commonly used metformin and oral contraceptives and determine whether one of them is superior to others. No real differences were found when comparing the results of the different forms of T-Test with the results of ANOVA and MANOVA tests.

As for OCPs, normal menstrual cycles were restored at 3-month follow-up in 100% of cases, but the decrease in menstrual cycle length was not significant (19.35%, p=0.359). Improvement in ultrasound aspect of the ovaries was found in all patients as soon as 3 months of treatment (p<0.0001). FG score was also significantly improved after 6 months of treatment and PRL status at 6 months after initiation of OCPs (29,85%, p<0.0001). Our findings show a decrease in testosterone levels by 50%, in LH levels by 77,71% after 3 months and of 69.81% (p<0.0001) in FSH levels from 3 month follow up on. LH to FSH ratio decreased consecutively by 54.01% (p=0.0005) after 6 months. This confirms existing data on improving testosterone levels and LH-FSH profile. OCPs have been also found to normalize free androgen index and SHBG values. Abdominal circumference did not seem to improve in the OCP group, but this could be explained by the baseline value close to the normal upper limit for the studied group. There is also literature data showing a negative impact of OCPs on BMI. Adding metformin to therapy was proposed in order to attenuate this effect [1,16,17].

Regarding metformin therapy, its role in reducing symptoms of PCOS is supported by literature, with the exception of hirsutism, although in some studies it was proven  to reduce acne, hirsutism and improve fertility. Menstrual cycle pattern normalized significantly by 54,78% at 3 months follow-up (p=0.0008) and remained stable at 6 months. There was a clear improvement in free testosterone after treatment with metformin starting from 3 months follow-up (p=0.0007) and continuing to decrease and a decrease of LH:FSH ratio by 27.65%  (p=0.0002) for patients treated with metformin for 6 months. Other studies support our data with similar results. One study described a decrease in ovarian volume by 10% (p=0.001) marking an improvement at ultrasound examination, which was also found in our study after 6 months (47,37%, p=0.0049). Metabolic parameters were, as expected, improved with metformin therapy in the majority of studies. A decrease by 4.81 % in HbA1c after only 3 months of treatment (p<0.0001) was noticed, while literature data shows differences of up to 15% after 6 months. Abdominal circumference decreased by 8.17% (p<0.0001) after the same time period [7,18-25].

More research papers on use of inositols in women with PCOS have been published for the past couple of years. Our paper aimed to bring a contribution to current knowledge. The most significant improvement in all our study groups was assessed for the inositol group at 3-month follow-up. All the monitored parameters, both endocrine and metabolic, have been significantly improved with the exception of FG score. Other publications have found an improvement with inositol therapy even for this parameter. A decrease of 38,53% (p=0.006) in menstrual cycle length was found, which is extremely comparative other literature findings, but mean length value is still greater than normal. PRL levels decreased by 20,08% (p=0.004) after 6 months treatment, LH levels recorded a 15,54% decrease (p=0.0002) after 3 months and FSH up to 17.46% (p=0.001) after 6 months of treatment; we did not find a significant improvement for FSH values in other publications. LH:FSH ratio decreased by 20% (p=0.001) after 3 months of treatment, which was similar to other findings. Testosterone levels improved by 50%. A decrease by up to 4.33% (p<0.0001) was documented for abdominal circumference, also for HbA1c  a significant 3.82% decrease was found (p=0.010). Our work supports other papers findings, a decrease in BMI and in HbA1c have also been reported. As to ultrasound examination, we found a statistically significant improvement of 25% (p=0.003, p=0.0001) regarding PCOM with each 3 months, yet to our knowledge other studies could not find a significant improvement [26-29].

OCPs vs Metformin

The present study showed favorable outcomes for OCPs after 3 months of treatment, a statistically significant difference in effectiveness was in favor of OCP treatment in regard to decreasing FG score and LH levels. When evaluating of PCOM aspect evolution, OCPs are also superior (all patients were negative after 3 months), but there was a significant difference in initial parameters which favored the OCP group.Metforminhad better results in decreasing abdominal circumference and menstrual cycle length, but it should be taken into account that the values for the OCP group were closer to normal at baseline and this could benefit the metformin group to achieve a greater improvement. Regarding HbA1c, metformin was also superior compared to OCP, which did not attain a significant improvement.

Multiple studies compared efficacy of these two agents, most of the result were comparable to ours. Metformin has been shown to improve most metabolic parameters, but also OD and fertility in some cases, while OCPs had better outcomes in ameliorating HA symptoms and endocrine parameters [1,22].

Metformin vs Inositol

Combining the stastical results after 3 month follow-up, inositols clearly showed to be superior in decreasing abdominal circumference, improving PRL levels, and twice as effective regarding PCOM aspect. There was a statistically significant difference in effectiveness in favor of metformin for menstrual cycle length; for HbA1c, metformin was superior but not statistically significant.

There is only few literature data in this regard and results are conflicting. Some recent studies found improvements in the endocrine and clinical outcomes in clear favor to metformin while other report the two are equally effective in normalizing both metabolic and clinical characteristics. Given the lack of conclusive data, current guidelines do not support use of inositols in treating women with PCOS and considers its use still experimental.[1,26,27,29]

Inositol vs OCPs

Currently there is no data comparing inositols and oral contraceptive outcomes. Our findings show superior results for OCPs on endocrine parameters: PRL, LH and LH:FSH. OCPs were also quicker in improving PCOM (100% negative for PCOM at 3 months). Worth mentioning that initial values have already been started in favor of the OCP group at baseline. The inositol group took at least twice as long reach the same improvement (%). Similarly to metformin, the insulin sensitizer was better than OCPs in improving abdominal circumference and menstrual cycle length.

The multiple initial differences between the study groups, the relatively short follow-up of only 3 months for HbA1c and FG score, the different time from diagnosis and the lack in monitoring lifestyle intervention are some of the limitations of this study. One of its strengths was comparing OCP treatment with inositol, which to our knowledge was not done to this extent.

Conclusion

The findings of this study showed superior outcomes for OCPs in improving endocrine parameters: PRL, LH, FSH, LH:FSH ratio and polycystic morphology aspect on ultrasound. Inositols and metformin also improved these parameters, but to a lower extent.

Both insulin sensitizers (metformin and inositol) turned out triumphant in reducing abdominal circumference and menstrual cycle length, with better results for metformin in restoring menstrual cycle pattern, while an exceptional performance was described for the inositol group in improving abdominal circumference, testosterone and PRL levels.

Some of the results may have been influenced by a distribution closer to the normal range that could benefit certain therapy outcomes. A randomization at baseline might be of help in future studies.

Given the little data and the big potential of inositol treatment, there is a real need for more extensive research in this regard. Up until now, studies showed great outcomes for inositols, and considering the absence of the typical gastrointestinal side effects of metformin, they may be considered a real alternative to metformin or as complementary therapy to OCPs.

Significant differences in clinical and biochemical parameters have been found between outcomes for the diverse treatment choices, still none of them turned out superior in ameliorating all main components (HA, OD and PCOM). The treatment in each case of PCOS should be individualized to the patient’s symptoms and needs.

Abbreviations

PCOS – Polycystic ovary syndrome

MI – Myo-Inositol

DCI – D-chiro-Inositol

OCP – Oral contraceptive pills

PCOM – Polycystic ovarian morphology

FG score – Ferriman-Gallwey score

HA – Hyperandrogenism

OD – Ovarian dysfunction

MANOVA – Multifactorial analysis of variance

References

  1. Teede H, Misso M, Costello M, Dokras A, Laven J, et al (2018) International evidence-based guideline for the assessment and management of polycystic ovary syndrome. National Health and Medical Research Council (NHMRC) 2018.
  2. Goodman NF, Cobin RH, Futterweit W, Glueck JS, Legro RS, et al (2015) American Association Of Clinical Endocrinologists, American College Of Endocrinology, And Androgen Excess And Pcos Society Disease State Clinical Review: Guide To The Best Practices In The Evaluation And Treatment Of Polycystic Ovary Syndrome – Part 1. Endocr Pract.
  3. Azziz R (2016) Introduction: Determinants of polycystic ovary syndrome. Fertil Steril.
  4. Karkanaki A, Vosnakis C, Panidis D (2011). The clinical significance of anti-müllerian hormone evaluation in gynecological endocrinology. Hormones.
  5. Meier RK (2018) Polycystic Ovary Syndrome. Nursing Clinics of North America.
  6. S.m S, K.a P (2014). Epidemiology, diagnosis, and management of polycystic ovary syndrome Clin Epidemiol.
  7. H.J. T, M.L. M, M.F. C, A. D, J. L, et al (2018) Recommendations from the international evidence-based guideline for the assessment and management of polycystic ovary syndrome. Hum Reprod.
  8. Bani Mohammad M, Majdi Seghinsara A. Polycystic Ovary Syndrome (PCOS), Diagnostic Criteria, and AMH. Asian Pac J Cancer Prev 18:17–21.
  9. LJ M, SK H, RJ N, HJ T, Moran Lisa J et al (2011). Lifestyle changes in women with polycystic ovary syndrome. Cochrane Database Syst Rev.
  10. Mena GP, Mielke GI, Brown WJ (2019). The effect of physical activity on reproductive health outcomes in young women: a systematic review and meta-analysis. Hum Reprod Update.
  11. Jin P, Xie Y (2018). Treatment strategies for women with polycystic ovary syndrome. Gynecological Endocrinology.
  12. Kalra B, Kalra S, Sharma JB (2016) The inositols and polycystic ovary syndrome. Indian J Endocrinol Metab 20: 720–4.
  13. Bednarska S, Siejka A (2017) The pathogenesis and treatment of polycystic ovary syndrome: What’s new? Adv Clin Exp Med.
  14. Aswini R, Jayapalan S (2017) Modified Ferriman–Gallwey score in hirsutism and its association with metabolic syndrome. Int J Trichology.
  15. Kissling GE (2017) Statistical methods. In: The Clinical Chemistry of Laboratory Animals, Third Edition.
  16. Feng W, Jia YY, Zhang DY, Shi HR (2016). Management of polycystic ovarian syndrome with Diane-35 or Diane-35 plus metformin. Gynecol Endocrinol.
  17. Luque-Ramírez M, Nattero-Chávez L, Ortiz Flores AE, Escobar-Morreale HF (2018). Combined oral contraceptives and/or antiandrogens versus insulin sensitizers for polycystic ovary syndrome: A systematic review and meta-analysis. Hum Reprod Update.
  18. Jaganmohan C, Vannan M, Ali A, S P (2017) Evaluation of Clinical Efficacy of Metformin Therapy in Polycystic Ovary Syndrome. J Young Pharm.
  19. Pasquali R, Gambineri A (2013) THERAPY OF ENDOCRINE DISEASE: Treatment of hirsutism in the polycystic ovary syndrome. Eur J Endocrinol.
  20. Dardzińska JA, Rachoń D, Kuligowska-Jakubowska M, Aleksandrowicz-Wrona E, Płoszyński A, et al (2014) Effects of metformin or an oral contraceptive containing cyproterone acetate on serum C-reactive protein, interleukin-6 and soluble vascular cell adhesion molecule-1 concentrations in women with polycystic ovary syndrome. Exp Clin Endocrinol Diabetes.
  21. Cosma M, Swiglo BA, Flynn DN, Kurtz DM, LaBella ML, et al (2008). Insulin sensitizers for the treatment of hirsutism: A systematic review and metaanalyses of randomized controlled trials. Journal of Clinical Endocrinology and Metabolism.
  22. Morin-Papunen L, Vauhkonen I, Koivunen R, Ruokonen A, Martikainen H, et al (2003). Metformin versus ethinyl estradiol-cyproterone acetate in the treatment of nonobese women with polycystic ovary syndrome: A randomized study. J Clin Endocrinol Metab.
  23. Tao T, Wu P, Wang Y, Liu W (2018). Comparison of glycemic control and β-cell function in new onset T2DM patients with PCOS of metformin and saxagliptin monotherapy or combination treatment. BMC Endocr Disord.
  24. Celik O, Acbay O (2012) Effects of metformin plus rosuvastatin on hyperandrogenism in polycystic ovary syndrome patients with hyperlipidemia and impaired glucose tolerance. J Endocrinol Invest.
  25. Seyam E, Hefzy E (2018). Long-term effects of combined simvastatin and metformin treatment on the clinical abnormalities and ovulation dysfunction in single young women with polycystic ovary syndrome. Gynecol Endocrinol.
  26. Jamilian M, Farhat P, Foroozanfard F, Afshar Ebrahimi F, Aghadavod E, et al (2017). Comparison of myo-inositol and metformin on clinical, metabolic and genetic parameters in polycystic ovary syndrome: A randomized controlled clinical trial. Clin Endocrinol (Oxf).
  27. Fruzzetti F, Perini D, Russo M, Bucci F, Gadducci A (2017). Comparison of two insulin sensitizers, metformin and myo-inositol, in women with polycystic ovary syndrome (PCOS). Gynecol Endocrinol.
  28. Artini PG, Di Berardino OM, Papini F, Genazzani AD, Simi G, et al (2013). Endocrine and clinical effects of myo-inositol administration in polycystic ovary syndrome. A randomized study. Gynecol Endocrinol.
  29. V. T, D. R, V. I, S. DC, C. DF, et al (2017). Metformin vs myoinositol: which is better in obese polycystic ovary syndrome patients? A randomized controlled crossover study. Clin Endocrinol (Oxf).

CD44 cleavage product CD44-intracellular domain regulates gene transcription and tumorigenesis

Abstract

CD44 is a multifunctional transmembrane glycoprotein that is expressed in many cancers and can regulate invasion and metastasis. CD44 can interact with a multitude of ligands to promote metastasis and invasion. CD44 is also a known cancer stem cell marker. Due to alternative splicing, CD44 can exist in multiple isoforms besides standard CD44 isoform. Recent studies have shown that CD44 can be proteolytically cleaved into CD44-intracellular domain (ICD). Specifically, this cleavage product ICD translocates into the nucleus to activate transcription of a variety of genes that are critical to inflammation, cell survival, glycolysis, and cancer metastasis.

Keywords

Cancer, Metastasis, CD44, CD44-ICD, Transcriptional Factor.

CD44 – Transmembrane Glycoprotein

CD44, a cell surface receptor for osteopontin (OPN) and hyaluronic acid (HA) and other ligands is known to play critical roles in cancer cell migration, invasion, and tumor growth [1-6]. Multiple isoforms of CD44 exists due to the insertion of alternative exons at the extracellular domain site [5]. CD44 is expressed ubiquitously and distributed widely in fetal and adult tissues with varying degrees of expression [7-9].

CD44-Intracellular Domain (ICD)

CD44 can undergo sequential proteolytic processing to create an intracellular domain (ICD) fragment that can translocate into the nucleus to regulate the expression of a few genes [10-18]. This sequential cleavage of CD44 to generate the ICD fragment can be first mediated by metalloproteases (MMPs) at the ectodomain portion to create a fragment known as CD44 extracellular truncation (EXT). Sequentially, cleavage by γ-secretase at the transmembrane domain generates the CD44-ICD fragment. This fragment is capable of translocating into the nucleus to regulate gene transcription [13, 18].

CD44-ICD Transcriptional Factor

CD44-ICD has recently been shown in several cancers as the main factor responsible for tumorigenic potential of the cells. Specifically, in prostate cancer, CD44-ICD was found to be associated with the master regulator of osteoblastogenesis RUNX2 to mediate the transcription of matrix metalloproteinase 9 (MMP-9) gene [24]. Additionally, CD44-ICD interacts with a novel consensus sequence in the promoter region of the MMP-9 gene to regulate its expression. Furthermore, CD44-ICD activates multitudes of genes involved in cell survival, tumor invasion, glycolysis, etc. in breast cancer cells [11]. Cleavage product CD44-ICD has also been shown to support the activation of stemness factors Nanog, Sox2, Oct4, thereby promoting tumorigenesis of breast cancer [19]. In thyroid cancer cells, CD44-ICD has been shown to trigger activation of the CREB transcription factor thus sustaining proliferative signaling [10]. Studies have also shown that CD44-ICD has the capability of regulating the transcription of CD44 itself [14]. In other cell types like chondrocytes, CD44-ICD release has been shown to exert a competitive effect on full-length CD44 function [20].

Conclusion

The multifunctional receptor CD44 is involved in a variety of functions ranging from aggregation to migration and metastasis. CD44 can interact with different ligands to elicit many cellular functions. Emerging studies have analyzed the role of CD44-ICD in mediating and promoting tumorigenesis. CD44-ICD upregulates and activates genes involved in invasion, migration, and tumorigenesis. Taken together, CD44-ICD could be a therapeutic target in cells, including cancer cells that express CD44.

References

  1. Senbanjo LT, Chellaiah MA (2017) CD44: A Multifunctional Cell Surface Adhesion Receptor Is a Regulator of Progression and Metastasis of Cancer Cells. Front Cell Dev Biol 5: 18.
  2. Interaction between CD44 and hyaluronan promotes bone metastasis (2013) Bonekey Rep 2: 402.
  3. Desai B, Ma T, Chellaiah MA (2008) Invadopodia and matrix degradation, a new property of prostate cancer cells during migration and invasion. J Biol Chem 283: 13856–13866.
  4. Desai B, Rogers MJ, Chellaiah MA (2007) Mechanisms of osteopontin and CD44 as metastatic principles in prostate cancer cells. Mol Cancer 6: 18.
  5. Cichy J, Puré E (2003) The liberation of CD44. J Cell Biol 161: 839–843.
  6. Draffin JE, Hill A, Johnston PG, Waugh DJ (2003) CD44 Expression on prostate cancer cells correlates with adhesion to bone marrow endothelial cells. Clinical Cancer Research 9: 6181s-6181s.
  7. Desai B, Ma T, Zhu J, Chellaiah MA (2009) Characterization of the expression of variant and standard CD44 in prostate cancer cells: identification of the possible molecular mechanism of CD44/MMP9 complex formation on the cell surface. J Cell Biochem 108: 272–284.
  8. Gupta A, Cao W, Chellaiah MA (2012) Integrin αvβ3 and CD44 pathways in metastatic prostate cancer cells support osteoclastogenesis via a Runx2/Smad 5/receptor activator of NF-κB ligand signaling axis. Mol Cancer 11: 66.
  9. Gupta A, Cao W, Sadashivaiah K, Chen W, Schneider A, Chellaiah MA (2013) Promising noninvasive cellular phenotype in prostate cancer cells knockdown of matrix metalloproteinase 9. ScientificWorldJournal 2013: 493689.
  10. De Falco V, Tamburrino A, Ventre S, Castellone MD, Malek M, Manié SN, Santoro M (2012) CD44 proteolysis increases CREB phosphorylation and sustains proliferation of thyroid cancer cells. Cancer Res 72: 1449–1458.
  11. Miletti-González KE, Murphy K, Kumaran MN, Ravindranath AK, Wernyj RP, Kaur S, Miles GD, Lim E, Chan R, Chekmareva M et al (2012) Identification of function for CD44 intracytoplasmic domain (CD44-ICD): modulation of matrix metalloproteinase 9 (MMP-9) transcription via novel promoter response element. J Biol Chem 287: 18995–19007.
  12. Takahashi N, Knudson CB, Thankamony S, Ariyoshi W, Mellor L, Im HJ, Knudson W: (2010) Induction of CD44 cleavage in articular chondrocytes. Arthritis Rheum 62: 1338–1348.
  13. Nagano O, Saya H (2004) Mechanism and biological significance of CD44 cleavage. Cancer Sci 95: 930–935.
  14. Okamoto I, Kawano Y, Murakami D, Sasayama T, Araki N, et al. (2001) Proteolytic release of CD44 intracellular domain and its role in the CD44 signaling pathway. J Cell Biol 155: 755–762.
  15. Okamoto I, Kawano Y, Tsuiki H, Sasaki J, Nakao M, et al. (1999) CD44 cleavage induced by a membrane-associated metalloprotease plays a critical role in tumor cell migration. Oncogene 18: 1435–1446.
  16. Murakami D, Okamoto I, Nagano O, Kawano Y, Tomita T, et al. (2003) Presenilin-dependent γ-secretase activity mediates the intramembranous cleavage of CD44. Oncogene  22: 1511.
  17. Okamoto I, Tsuiki H, Kenyon LC, Godwin AK, Emlet DR, et al (2002) Proteolytic cleavage of the CD44 adhesion molecule in multiple human tumors. Am J Pathol 160: 441–447.
  18. Senbanjo LT, AlJohani H, Majumdar S, Chellaiah MA (2019) Characterization of CD44 intracellular domain interaction with RUNX2 in PC3 human prostate cancer cells. Cell Communication and Signaling 17: 80.
  19. Cho Y, Lee HW, Kang HG, Kim HY, Kim SJ, et al. (2015) Cleaved CD44 intracellular domain supports activation of stemness factors and promotes tumorigenesis of breast cancer. Oncotarget 6: 8709–8721.
  20. Mellor L, Knudson CB, Hida D, Askew EB, Knudson W (2013) Intracellular domain fragment of CD44 alters CD44 function in chondrocytes. J Biol Chem 288: 25838–25850.

Vertebroplasty vs. SHAM for Treating Osteoporotic Vertebral Compression Fractures: A Double Blind RCT (VOPE)

Abstract

Introduction: Osteoporotic Vertebral Compression Fractures (VCF) affects 20% of postmenopausal women and can lead to long-term disability.

The effect of Percutaneous Vertebroplasty (PVP) has been debated, since two double-blind RCTs was performed. Our purpose was to investigate the clinical effects of PVP compared with a SHAM procedure in acute osteoporotic VCFs focusing on VAS during activity.

Methods: 52 patients were included in the study, and randomized to either PVP or SHAM. 6 patients were excluded during the study, due to malignancy or need for further surgery. Patients, investigators collecting data, and the statisticians were blinded.

Results: 46 patients were eligible for statistical analysis, 22 patients in the PVP group and 24 patients in the SHAM group. In both groups the VAS-scores, and HRQL scores improved significantly from baseline values (p<0.05). There was a statistical significant higher VAS-score in the SHAM-group throughout the trial period (p=0.001), with main contribution from VAS at forward bending.

Conclusion: Our study shows statistical significant higher VAS-score in the SHAM group during the trial period, both groups improved significantly in all clinical parameters. However the limitations of the study and the data at hand do not provide sufficient evidence of the benefits of PVP for treating osteoporotic vertebral compression fractures. Focus in the future of PVP and acute VCFs must be on the 3 months convalescence period and the cost benefit analysis of early mobilization.

Introduction

Osteoporosis is a generalized disease of the bones defined by reduced bone mass. According to the WHO, osteoporosis is defined by bone mass 2.5 Standard Deviations (SD) below peak bone mass. Bone Mineral Density (BMD) can be measured by a DEXA-scan. The T-score indicates if BMD is above or below peak bone mass. A T-score < -2.5 is by definition, osteoporosis. Using this definition every third woman above 50 years old has osteoporosis [1,2].

Osteoporosis is seen in women twice as often than in men. The risk of having an osteoporotic fracture increases with age. Osteoporosis occurs due to age-related loss of bone mass and loss of bone mass caused by other life processes, most important of which is the reduced level of estrogen in postmenopausal women [3].

In many women, there is a general reduction in height caused by compression fractures in vertebral bodies. A vertebral fracture can cause back pain, a kyphotic deformity and reduce pulmonary function when they occur in the thoracic spine [4].

Percutaneous Vertebroplasty (PVP) involves the percutaneous injection of bone cement into fractured vertebrae. PVP is indicated for Vertebral Compression Fractures (VCFs) due to osteoporosis, metastatic disease, multiple myeloma or hemangioma. The method was developed in 1980s in France for the treatment of vertebral hemangiomas and osteolytic vertebral tumors [5]. Indications were later expanded to include osteoporotic VCFs [6]. The method is described safe, with very few complications and can be performed in general anaesthesia or local anaesthesia [6,7].

Worldwide 3 non-blinded RCTs has been performed, where the effect of PVP has been compared with conservative treatment [10,11,12] and 3 RCTs where PVP was compared with a sham-procedure, periostal injection of lidocaine [8,9,20]. All of these studies have investigated the effect on patients with osteoporotic VCFs. The non-blinded trial published by Voormolen et al where terminated after 2 weeks as most of the conservative patients crossed over to the PVP group [11].

The other non-blinded trial published by Rousing et al, included patients with acute back pain and VCF. They randomized between PVP and conservative brace treatment [12]. Significant pain relief was noted 4–24 hours postoperatively in PVP group. At 3 and 12 months follow-up there was no significant difference in pain level, physical performance evaluated by sit down testing, between the two treatment arms. The most recent non-blinded RCT published in 2016 involving 107 patients found significant pain relieve in patients with PVP acute osteoporotic VCFs compared with conservative treatment consisting of 2 weeks bed rest, optimal pain medication and prescription of physiotherapy [10].

The two RCTs by Buchbinder et al and Kalmes et al [8 ,9] showed no significant difference in pain relief between PVP and the sham-procedure, and not a substantial relief of pain in general. In the study by Kalmes [9] the patients included had a history of back pain up to 52 weeks, and a total of 131 patients included. Amount of PMMA cement injected was not recorded. In the study by Buchbinder [8] including 78 patients the patients were included both with and without edema present on the MRI scan and a VAS score at inclusion from 30–100.

The primary purpose of this study was to compare the Visual Analog Back Pain scores (VAS) [13] at rest and with during mobilization weekly during the first 12 weeks in a double-blind placebo-controlled RCT of PVP vs. SHAM for acute osteoporotic VCFs. Secondary outcome measures of interest were improvements in the EuroQOL-5D (EQ5D) [14] and the Short Form-36 Physical Composite Summary Scores (SF-36 PCS) [15] compared to baseline one year after the procedure.

Methods

Study Design

A double-blinded placebo-controlled RCT to determine the efficacy of PVP in patients with acute osteoporotic VCFs.

The study was approved by the regional Ethics Committee and was registered on clinicaltrials.gov (NCT#01537770). Trial protocol as approved by the ethics committee is displayed at the above mentioned NCT#. Partially funded by the Danish Rheumatism association.

Inclusion Criteria

Osteoporotic VCF from T5-L5, >70 in VAS at Inclusion, </= 8 weeks of back pain and a Magnetic Resonance Imaging Short Tau Inversion Recovery(MRI-STIR) sequence showing edema using a Philips Achieva 1.5 Tesla scanner, (Andover, MA).

Exclusion Criteria

Patients with a history of malignancy, age below 50 years, known allergy towards PVP components, dementia as determined on the MMSE [16], osteoporotic fractures of the long bones and those unable to consent were excluded.

Level of evidence: 1

Randomization was a block randomization design using 80 sealed envelopes (blocks of 20). Procedures were performed under local anaesthesia using the V-Max Mixing and Delivery System (DePuy Acromed). Subjects were placed prone on a Jackson table and Lidocaine was used to anesthetize the entry points. The 11-gauge needles were then inserted into the fractured vertebral body via the pedicles under fluoroscopic guidance and a biopsy specimen was taken. In all cases, bone cement was mixed to create the odor similar to a PVP-procedure. 2 ml of Lidocaine (10 mg/ml) was injected in the SHAM group. 2–4 ml of bone cement was injected in the PVP group.

VAS at rest and during forward bending was collected at enrollment, 6 hours postoperatively, weekly for the first 3 months and at 1 year.. A Danish version of SF-36 [15], EQ5D [14], data on pain medication use and standing full-length spine radiographs were collected at enrollment and at 3 and 12 months. Blood samples were also drawn and analysed to exclude infections and malignancies.

The primary investigator performed all screening procedures and follow-up examinations, and was blinded to the subject’s assigned treatment arm throughout the study period.

Statistical Analysis

Power analysis

Power calculation was performed to find a difference in VAS of 20(0–100) with SD of 0.20. A difference of 20 was chosen, as this was past the Minimal Clinical Important Difference (MCID) reported in other studies [17,18]. This resulted in a power calculation suggesting a minimum of 23 patients needed in each group. Our aim prior to enrolment was 40 in each group.

The statistical analyses were conducted in SAS version 9,4 (SAS institute, Carry, NC). Repeated measures ANOVA was used to determine differences in VAS between PVP and Sham group. Unpaired student’s t-test was used to compare continuous variables and Fisher’s exact test was used to compare categorical variables between groups.

Least-square Means and standard errors of pain scores from a numerical self-reported VAS on a scale of 0 to 100 were calculated from measures collected in two different positions – standing and bending forward – at pre-op, at 6 hours post-treatment (rest only), at week 1–12, and at one year post-treatment. A paired t-test or Wilcoxon signed rank test was used to test for differences between baseline and each subsequent time period. Multiple comparisons were adjusted using Tukey’s test.

Trends over time, by treatment group and by position are compared using a repeated measures mixed effects model, adjusted for timing past baseline, position (at rest or bending) and type of treatment administered(PVP or SHAM). An independent and blinded statistician performed the statistical analyses.

Results

A total of 342 potential subjects were referred to our outpatient clinic between 2011–2014 and were screened in order to find eligible patients to include in this study. All patients included signed an informed consent form to participate in a clinical trial, and that the data could be published in a blinded format. The patients were informed of the option of dropping out at any time without any reason needed.

The reasons for not enrolling 290 of the screened patients in the study were mainly that the time from symptom onset was exceeding the 8 week period, at the time they were referred to our clinic, and patients unwillingness to participate in a clinical trial. In total 52 patients were included. During the trial period 2 patients were excluded postoperatively due to malignant biopsies. 4 patients were excluded due to the need for further spine surgery. (Figure 1) No complications including cement leakage or infections occurred perioperative or during the postoperative period. 46 subjects were included in the final analyses; 24 in the Sham procedure and 22 in the PVP treatment. There were no differences in patient demographics and Bone Mineral Density t-scores between the two groups.

IJOT 19 - 124_Emil Jesper Hansen_f1

Figure 1.

Table 1. Patient Demographics.

Table 1

SHAM

PVP

p-value

Age (years)

69,33 (53–84)

70,59 (54–90)

0,309

Sex M/F

2/22

4/18

0,322

BMD T-score

-2,2 (0,24)

-2,7 (0,25)

0,875

No. Levels treated

28

27

0,932

New VCFs

5 (21%)

4 (19%)

0,688

Vertebral Levels

Th7-L5

Th6-L5

VAS and SE for each time period and position are shown in Table 2: VAS scores 12 months follow-up.

Table 2. Means and Standard Errors of VAS by treatment and Group and position.

Table 2

SHAM

PVP

Position

Mean(SE)

Means (SE)

Resting

Baseline

53,04 (4,35)

40,55 (4,55)

Hour 6

26,45 (4,82)

32,76 (5,07)

Week 1

21,13 (4,35)

24,52 (4,65)

Week 2

19,08 (4,35)

17,52 (4,65)

Week 3

13,87 (4,45)

13,57 (4,65)

Week 4

10,42 (4,35)

12,62 (4,65)

Week 5

10,17 (4,45)

11,81 (4,65)

Week 6

8,83 (4,35)

9,00 (4,55)

Week 7

8,29 (4,35)

10,52 (4,65)

Week 8

8,29 (4,35)

8,00 (4,65)

Week 9

8,04 (4,35)

6,82 (4,55)

Week 10

7,57 (4,35)

7,40 (4,77)

Week 11

7,21 (4,35)

6,17 (5,03)

Week 12

6,88 (4,35)

8,64 (4,55)

Week 52

16,04 (4,35)

16,06 (5,03)

Forward bending

Baseline

76,08 (4,35)

74,68 (4,55)

Week 1

41,83 (4,45)

26,80 (4,77)

Week 2

34,83 (4,45)

28,52 (4,65)

Week 3

28,83 (4,45)

17,81 (4,65)

Week 4

26,27 (4,55)

17,33 (4,65)

Week 5

27,14 (4,55)

14,33 (4,65)

Week 6

21,09 (4,45)

15,27 (4,55)

Week 7

19,26 (4,45)

13,62 (4,65)

Week 8

19,77 (4,55)

13,24 (4,65)

Week 9

15,87 (4,45)

10,00 (4,55)

Week 10

14,00 (4,65)

10,50 (4,77)

Week 11

16,48 (4,45)

9,50 (5,03)

Week 12

18,70 (4,45)

16,09 (4,55)

Week 52

30,67 (4,65)

28,35 (5,16

VAS; Visual Analog Scale 0 to 100

Table 3. Health-related Questionnaires.

Table 3

SHAM

PVP

p-value

SF36 PCS

Baseline

25,53 (4,64)

25,12 (6,86)

0,406

3 months

33,93 (10,56)

31,44 (10,03)

0,219

12 months

35,15 (11,92)

31,90 (9,19)

0,16

SF36 MCS

Baseline

44,29 (13,10)

42,00 (9,75)

0,255

3 months

51,4 (10,98)

49,7 (12,02)

0,318

12 months

53,60 (10,29)

48,60 (10,75)

0,063

EQ5D

Baseline

0,49

0,44

0,343

3 months

0,71 (0,23)

0,68 (0,23)

0,34

12 months

0,74 (0,22)

0,67 (0,27)

0,232

Penalized b-spline curves are shown in Figure 1 by treatment and position. The at-rest position had the lowest VAS regardless of treatment or time from baseline. Study participants in the PVP group had a faster drop in their bending VAS compared to the SHAM group.

There was a difference in treatment groups with the SHAM group having higher overall VAS (p=0.011). The VAS changes over time with highest levels experienced at baseline through week 3 and increasing moderately during follow-up (p<0.0001). Forward bending resulted in elevated VAS compared to the at-rest position (p<0.0001).

We were unable to detect a statistically significant difference between the VAS of the treatment groups at any measured time period within the same position. Before multiple comparison adjustment, there is some suggestion that the baseline VAS in the at-rest position differ by treatment (p = 0.0476).

While there was a significant difference from baseline through week 6 in the SHAM group and at baseline for the PVP group, only the PVP group difference remained significant once adjusted for multiple comparisons(adj-p=0.0002).

No statistical differences were found in SF-36 and EQ-5D scores between the two groups at 3 and 12 months follow-up in any of the parameters analysed.

At 0–12 weeks and at 12 month follow up there were a similar amount and frequency of opiods in the two groups.

Discussion

The debate whether the evidence for PVP in acute osteoporotic VCFs is sufficient enough to recommend it as a standard procedure is ongoing. We have focused on patients both at rest and during mobilization, and with a specific focus on the convalescence period the first 3 months after treatment; the latter is in contrary to the other studies on this subject. Thus a direct comparison between our results and the previous SHAM studies by Kalmes and Buchbinder, is difficult, due to the different study designs, the time of pain evaluation during the study, and the evaluation of pain at rest/ during mobilization. There are limitations to our study, the most important ones being the sample size. We did not succeed in our primary aim to include 40 patients in each group, and that weakens the study. Comparing with other studies of this patient group an intervention type, similar difficulties with sample-size and inclusion have been reported. We had a inclusion rate of about 16% (52/342), the Buchbinder et al. RCT had a 17% inclusion rate (52/500) and the Kalmes et al. RCT had a 13% rate (72/450).

We found in our study a significant higher VAS in the SHAM group throughout the follow up period (p=0.001) when applying ANOVA statistical model on our data. A study of the minimal clinically important difference in patient with acute pain was 9 mm (6–13; 95% CI) in VAS [18]. Other studies have shown a MCID on 13–30 mm, primarily in patients with chronic pain [17,19]. The maximum difference measured in our study is at week 3–5 in activity with differences of 9–13. The main contribution to the difference in VAS score were during mobilization and favours PVP treatment specifically in the first 1–12 weeks after treatment. By asking the patients of their back pain in the forward bending position, we resembled a patient moving from lying/sitting position to standing position, with axial load on the fractured vertebrae. A double blinded RCT published in 2016 by Clark et al. found PVP being a superior pain relieving agent compared with a sham procedure, which supports the trend found in our trial. However their sham treatment did not involve periostal infiltration and biopsies from the affected vertebral bodies [20], and their outcome measures regarding pain observation differed from our study and the studies by Buchbinder and Kalmes.

When comparing with the RCTs on PVP vs. SHAM by Buchbinder et al. and Kalmes et al. our findings are comparable when reviewing the Health related Quality of life questionnaires with no difference between the two groups. Our results however contradict in the VAS scores. The findings by Kalmes et al. who found no difference at any time point between the SHAM and PVP group within the first month. Similar the findings by Buchbinder et al. we are not significant between the groups within the first 6 months after surgery. There are several reasons for the difference in findings between the studies. In our opinion the main focus on the back pain in activity and the study design (differences described in the introduction section) is responsible for these differences in findings. It is remarkable that this study with fewer participants were able to detect a statistical significant difference.

Conclusion

This study set out to investigate whether PVP procedure has its relevance, in treating osteoporotic VCFs, compared with a SHAM procedure. Our study shows statistically significant difference in back pain primarily in forward bending causing significantly more pain in the SHAM group. In acute VCFs it is as well clinically relevant in the early convalescence period. Also, pain decreases over time, regardless of position or treatment and remains decreased from baseline. As suspected, there is no difference when the patients are at rest, with no axial force applied to the fractured vertebrae. With the limitations of this study and the data provided we cannot conclude if and how PVP has its place in treating osteoporotic VCFs. Out study has shown a trend towards a pain-relieving effect when patients are mobilised and applying axial force on the fractured vertebrae, and further studies with this focus and on the cost benefit of early mobilization are needed.

Funding

The study received funding from The Danish Rheumatism Association.

Trial Registration

The study was registered at clinical trials.org and approved by the National Ethics committee.

IJOT 19 - 124_Emil Jesper Hansen_f2

References

  1. Felsenberg D, Silman AJ, Lunt M et al. (2002) Incidence of vertebral fracture in Europe: results from the European Prospective Osteoporosis Study (EPOS). J Bone Mineral Res 17: 716–24.
  2. Curtis EM, Moon RJ, Harvey NC et al. (2017) The impact of fragility fracture and approaches to osteoporosis risk assessment worldwide. Bone 22: S8756–3282, 30024–8.
  3. Silverman SL, Minshall ME, Shen W et al. (2001) The relationship of health-related quality of life to prevalent and incident vertebral fractures in postmenopausal women with osteoporosis: results from the Multiple Outcomes of Raloxifene Evaluation Study. Arthritis Rheum 44: 2611–2619
  4. Suzuki N, Ogikubo O, Hansson T (2008) The course of the acute vertebral body fragility fracture: its effect on pain, disability and quality of life during 12 months. Eur Spine J 17: 1380–1390
  5. Galibert P, Deramond H, Rosat P et al. (1987) Preliminary note on the treatment of vertebral angioma by percutaneous acrylic vertebroplasty. Neurochirurgie 33: 166–8.
  6. McGraw JK, Lippert JA, Minkus KD et al. (2002) Prospective Evaluation of Pain Relief in 100 Patients Undergoing Percutaneous Vertebroplasty: Results and Follow-up. Journal of Vascular and Interventional Radiology 13: 883–6.
  7. Lee BJ, Lee SR, Yoo TY. Paraplegia as a complication of percutaneous vertebroplasty with polymethylmethacrylate: a case report. Spine 2002;27:E419-E422.
  8. Buchbinder R, Osborne RH, Ebeling PR et al.( 2009) A Randomized Trial of Vertebroplasty for Painful Osteoporotic Vertebral Fractures. N Engl J Med 361: 557–68.
  9. Kallmes DF, Comstock BA, Heagerty PJ et al. (2009) A Randomized Trial of Vertebroplasty for Osteoporotic Spinal Fractures. N Engl J Med 361: 569–79.
  10. Yang EZ, Xu JG, Huang GZ et al. (2016) Percutaneous Vertebroplasty Versus Conservative Treatment in Aged Patients With Acute Osteoporotic Vertebral Compression Fractures: A Prospective Randomized Controlled Clinical Study. Spine 41: 653–60.
  11. Voormolen MH, Mali WP, Lohle PN et al. (2007) Percutaneus vertebroplasty compared with optimal pain medication treatment: short-term clinical outcome of patients with subacute or chronic painful osteoporotic vertebral compression fractures. The VERTOS study. AJNR Am J Neuroradiol 28: 555–60.
  12. Rousing R, Hansen KL, Andersen MO et al. (2010) Twelve-Month Follow-up in Forty-Nine Patients With Acute/Semiacute Osteoporotic Vertebral Fractures Treated Conservatively or With Percutaneous Vertebroplasty: A Clinical Randomized Study. Spine 35: 478–82.
  13. Jensen MP, Karoly P, Braver S (1986) The measurement of clinical pain intensity: a comparison of six methods. Pain 27: 117–26.
  14. Sorensen J, Davidsen M, Gudex C et al. (2009) Danish EQ-5D population norms. Scand J Public Health 37: 67–74.See comment in PubMed Commons below
  15. Bjorner JB, Thunedborg K, Kristensen JS et al. (1998) The Danish SF-36 Health Survey: Translation and Preliminary Validity Studies. Journal of Clinical Epidemiology 51: 991–999.
  16. Folstein MF, Folstein SE, McHugh PR (1975) Mini Mental State. A practical method for grading the cognitive state of patients for the clinician. J Psychiatri Res 12: 189–198.
  17. Kelly AM (1998) Does the clinically significant difference in visual analog scale pain scores vary with gender, age, or cause of pain? Acad Emerg Med 5: 1086–90.
  18. Lee JS, Hobden E, Stiell IG (2003) Clinically important change in the visual analog scale after adequate pain control. Acad Emerg Med 10: 1128–30.
  19. Hägg O, Fritzell P, Nordwall A (2003) Swedish Lumbar Spine Study Group. The clinical importance of changes in outcome scores after treatment for chronic low back pain. Eur Spine J 12: 12–20.
  20. Clark W, Bird P, Gonski P et al (2016) Safety and efficacy of vertebroplasty for acute painful osteoporotic fractures (VAPOUR): a multicentre, randomised, double-blind, placebo-controlled trial. Lancet 388: 1408–1416.