Author Archives: dev

Malaria: It’s Gynecological and Obstretic Effects on Humans – A Short Note

Short Commentary

Malaria is a vector borne disease of man caused by protozoans of the genus Plasmodium – P. vivax, P.ovale, P. malariae, P. falciparum and, more recently, P. knowlesi [1]. These parasites are present within the red blood cells, and they are transmitted by mosquitoes of the genus Anopheles.

Considering the medical importance of malaria in the context of the gynaecological and obstetric fields we have as objectives in this manuscript to contribute: (i) to the divulgation of the knowledge of human malaria in a general context; (ii) to emphasize the gynaecological and obstetric effects of malaria in the human population.  In support of these objectives we present:

In article [2] we emphasized “uncomplicated malaria entails a series of recurring episodes of chills, intense fever, and sweating and often includes other symptoms such as headache, malaise, fatigue, body aches, nauseas, and vomiting. In some cases, and especially in groups, such as children and pregnant women, the disease can progress to “severe malaria,” including complications, such as cerebral malaria/coma, seizures, severe anaemia, respiratory distress, kidney and liver failure, cardiovascular collapse, and shock”.

This article [3] states that “if a woman gets malaria while pregnant, she and her baby have an increased risk of developing serious complications such as: (1) premature birth – birth before 37 weeks of pregnancy: (i) low birth weight; (ii) restricted growth of the baby in the womb; (2) stillbirth; (3) miscarriage – death of the mother.

Conclusion

It was here demonstrated that malaria infection can be one cause of human infertility, and of strong negatives effects on pregnant women and their babies. We hope that within a short period of time malaria is combated of sustained form in the world and that it is irradiated soon based, principally, in the   initiative of the WHO, Known as the E-2020 initiative and malaria elimination [4].

Keywords

Malaria; Anopheles; pregnancy; gynecology; obstetric; vector-borne diseases.

References

  1. White NJ (2008) Plasmodium knowlesi: the fifth human malaria parasite. Clin Infect Dis. 2008 Jan 15; 46: 172–3.
  2. Marrelli MT, Brotto M (2016) The effect of malaria and anti-malarial drugs on skeletal and cardiac muscles. Malaria Journal 15: 524,
  3. https://www.nhs.uk/conditions/malaria/complications/
  4. Q&A on the E-2020 initiative and malaria elimination – WHO (3 July 2019).

Microscopic Adenomyosis

Commentary

Endometriosis is a frequent, chronic inflammatory estrogen-dependent gynecological disease characterized by the presence of extrauterine endometrial tissue, that affects up to 10% of all reproductive-aged women. The incidence increases to 30–50% in women with chronic pelvic pain and infertility [1, 2]. Most common sites of the ectopic endometrial-like tissue are the pelvic peritoneum and ovaries, but they can be found also under the peritoneal surface, where endometriosis is strongly associated with pelvic pain symptoms [3]. This disease has a noteworthy morbidity, with harmful effect upon women’s social working, personal life, and relations with physicians [4]. Notwithstanding, the pathogenesis, as well as the diagnosis and therapy for endometriosis are still not perfectly delineated [5]. Recently, our group and others have generated convincing experimental data suggesting that perturbation of the fine-tuning of the female genital system development during a critical window of time in fetal life as the pathogenetic event prompting to the progression of endometriosis later in life [6–12].

The lack of knowledge about this disease justifies the fact that, to date, endometriosis is an incredibly under-diagnosed and under-treated disease, with an excessively long-time interval between the commencement of the symptoms and conclusive diagnosis of 8–12 years [1]. This is due to the fact that most of the symptoms are non-specific and there are no non-invasive diagnostic investigations able to reach a definitive diagnosis [13]. The definite diagnosis of endometriosis can be obtained only by histological examination of the ectopic tissue implants collected by invasive surgical or exploratory procedures [1].

The histologic diagnosis of endometriosis is, usually, quite simple and is based essentially on the recognition of both endometriosic glands and stroma, or at least by one of these two elements [1]. The histological appearance of these elements is straightforward; nevertheless, immunohistochemical staining for cytokeratin markers and for CD10 can aid in identification of glands and stroma in doubtful cases [14]. The different histopathological aspects of endometriosis are well known and have been described in detail in an elegant work of Clement some years ago [14]. Even though the histological diagnosis of endometriosis is relatively easy, also for pathologists who are not experts in this pathology, it has been reported that approximately only 50% of biopsy specimens from areas suggestive of endometriosis at laparoscopic examination have been proven microscopically to be endometriosis. Since the definitive diagnosis of this disease is based on histological examination, it is important for the correct management of the patients, to avoid false negative results at histology.

This phenomenon is particularly true in the case of adenomyosis, a condition of endometriosis in which the endometrial glands are embedded into the myometrium of the uterus [15]. Based on the Sampson’s theory, endometriosis and adenomyosis have been considered for a long time two different clinical entities and it took approximately 80 years to put forward a new theory reunifying their pathogenesis [16]. Indeed, adenomyosis is still considered today an ‘elusive’ or ‘enigmatic’ disease because of the struggle in diagnosis, and of the indefinite and vague pattern of symptoms which may accompany it. Nevertheless, the frequent association of adenomyosis with other pelvic pathologies is a further aspect which complicates the understanding of related symptoms [17]. Finally, since the moderate to severe degrees of adenomyosis can be accurately diagnosed preoperatively by good-quality ultrasound or magnetic resonance imaging, it would be desirable in the near future to correlate symptomatology with specific findings on imaging and with pathological data.

In our experience it has happened more than once to review cases, reported as negative for adenomyosis, which showed the presence of microscopic adenomyosis foci that had escaped the observation of the pathologist. As an example, in Figure 1 we show a case of multiple microscopic adenomyosis in the posterior wall of the uterus of patients with endometriosis. Indeed, ultrasound analysis had shown alterations suggestive of adenomyosis of the posterior uterine wall, but the histological analysis of the tissue taken was negative. A careful analysis of the histological preparation, however, showed the presence of microscopic endometriotic glands. Immunohistochemical analysis with cytokeratin antibodies confirmed the epithelial nature of these structures. In Figure 2 we show another case of microscopic adenomyosis, in which two small glandular structures were found in the wall of the uterus, as clearly demonstrated by immunohistochemical analysis for cytokeratin. Interestingly, analysis by CD10 clearly showed that in microscopic adenomyosis the stromal component is absent.

IGOJ-19-Alfonso Baldi_f1

Figure 1. A case of microscopic adenomyosis in the posterior wall of the uterus is depicted. In this case a multifocal microscopic adenomyosis with several very small glands was evidenced

A) Histological appearance of the multifocal adenomyosis (Hematoxylin and Eosin; original magnification X20)

B) Immunohistochemical staining for pan-cytokeratin (ABC; original magnification X10)

C) Higher magnification of figure 1B (ABC; original magnification X20)

IGOJ-19-Alfonso Baldi_f2

Figure 2. A different case of microscopic adenomyosis in the posterior wall of the uterus is shown. In this case a single small glandular structure was found

A) A small glandular structure evidenced by the immunohistochemical staining for pan-cytokeratin (ABC; original magnification X10)

B) Higher magnification of figure 1° (ABC; original magnification X20)

C) The microscopic adenomyosis does not include stroma, as demonstrated by the negative stainining for CD10 (ABC; original magnification X20)

Currently, by means of ultrasound and magnetic resonance imaging analyses, is possible to define for adenomyosis a spectrum of lesions, ranging from increased thickness of the junctional zone to evident adenomyosis and adenomyomas, which in turn can be sub classified [18]. Moreover, it is commonly accepted by the scientific community that adenomyosis is a progressive disease that changes in appearance during the reproductive years. Therefore, it has been recognized the need of a consensus classification of uterine adenomyosis [18].

Based on our experience, microscopic adenomyosis could be considered the earliest form of adenomyosis and should enter the consensus classification of adenomyosis. Furthermore, in the light of this observation, we claim that such an initial state of adenomyosis is a source of symptomatology, thus explaining the presence, as often happens, of patients with negative diagnostic tests but with symptomatology in place, for which even doubts are often raised about the presence of this pathology. Microscopic adenomyosis also provides a rational basis for the occurrence that surgical interventions often do not resolve the symptoms of chronic pelvic pain. Nevertheless, the histological features of microscopic adenomyosis give us clues to the developmental dynamics of endometriosis and adenomyosis. The prevalent glandular-epithelial composition in microscopic adenomyosis may lead to the hypothesis that the role of the stromal component becomes fundamental in a successive phase, providing an essential support to the glandular structures by virtue of its sensitivity to the higher estrogenic growth input with respect to the epithelial component [19]. Finally, we also noted that the greater is tthe multifocal representation of the glands present, the greater is the symptomatic component of pelvic pain.

In conclusion, we propose to consider microscopic adenomyosis as a specific clinical entity and to include it in the classification of uterine adenomyosis Careful histological analysis and, in doubtful cases, the use of immunohistochemistry should always be performed, to eventually confirm the presence of microscopic glands in patients with clinical and instrumental signs suggestive for adenomyosis. This would be very important to reduce the delay in the diagnosis of this clinical entity, which is still high today and causes significant problems for both patients and physicians.

References

  1. Bulun SE (2009) Endometriosis. N Engl J Med 360: 268–279.
  2. Signorile PG, Campioni M, Vincenzi B, D’Avino A, Baldi A (2009) Rectovaginal septum endometriosis: an immunohistochemical analysis of 62 cases. In Vivo 23: 459–464.
  3. Baldi A, Campioni M, Signorile PG(2008) Endometriosis: pathogenesis, diagnosis, therapy and association with cancer. Oncol Rep 19: 843–846.
  4. Fuldeore M, Chwalisz K, Marx S, Wu N, Boulanger L, et al. (2001) Surgical procedures and their cost estimates among women with newly diagnosed endometriosis: a US database study. J Med Econ 14: 115–123.
  5. Benagiano G, Brosens I (2006) History of adenomyosis. Best Pract Res Clin Obstet Gynaecol 20: 449–463.
  6. Signorile PG, Baldi F, Bussani R, D’Armiento M, De Falco M, Baldi A (2009) Ectopic endometrium in human fetuses is a common event and sustains the theory of mullerianosis in the pathogenesis of endometriosis, a disease that predisposes to cancer. J Exp Clin Cancer Res 9: 28–49.
  7. Signorile PG, Baldi A (2010) Endometriosis: new concepts in the pathogenesis. Int J Biochem Cell Biol 42: 778–780.
  8. Signorile PG, Spugnini EP, Mita L, Mellone P, D’Avino A, et al. (2010) Pre-natal exposure of mice to bisphenol A elicits an endometriosis-like phenotype in female offspring. Gen Comp Endocrinol 168: 318–325.
  9. Signorile PG, Baldi F, Bussani R, D’Armiento M, De Falco M, et al. (2010) New evidence of the presence of endometriosis in the human fetus. Reprod Biomed Online 21: 142–147.
  10. Signorile PG, Baldi F, Bussani R, Viceconte R, Bulzomi P, et al. (2012) Embryologic origin of endometriosis: analysis of 101 human female fetuses. J Cell Physiol 227: 1653–1656.
  11. Bouquet de Jolinière J, Ayoubi JM, Lesec G, Validire P, Goguin A, et al. (2012) Identification of displaced endometrial glands and embryonic duct remnants in female fetal reproductive tract: possible pathogenetic role in endometriotic and pelvic neoplastic processes. Front Physiol 3: 444.
  12. Crispi S, Piccolo MT, D’Avino A, Donizetti A, Viceconte R, et al. (2013) Transcriptional profiling of endometriosis tissues identifies genes related to organogenesis defects. J Cell Physiol 228: 1927–1934.
  13. Ballard KD, Lowton K, Wright JT (2006) What’s the delay? A qualitative study of women’s experience of reaching a diagnosis of endometriosis. Fertil Steril 85: 1296–1301.
  14. Clement PB (2007) The pathology of endometriosis: a survey of the many faces of a common disease emphasizing diagnostic pitfalls and unusual and newly appreciated aspects. Adv Anat Pathol 14: 241–260.
  15. Thylan S Adenomyosis (1995) an ignored uterine disease. Nurse Pract 20: 8–9.
  16. Benagiano G, Brosens I, Carrara S. Adenomyosis (2009) new knowledge is generating new treatment strategies. Womens Health (Lond) 5: 297–311.
  17. Peric H, Fraser IS (2006) The symptomatology of adenomyosis. Best Pract Res Clin Obstet Gynaecol 20: 547–555.
  18. Gordts S, Brosens JJ, Fusi L, Benagiano G, Brosens I (2008) Uterine adenomyosis: a need for uniform terminology and consensus classification. Reprod Biomed Online 17: 244–248.
  19. Dyson MT, Kakinuma T, Pavone ME, Monsivais D, Navarro A, et al. (2015) Aberrant expression and localization of deoxyribonucleic acid methyltransferase 3B in endometriotic stromal cells. Fertil Steril 104: 953–963.

Post-Traumatic Stress Disorder: Diagnosis and Management

Approximately one in three people in the UK report exposure to a significant traumatic event during the course of their life [1]. Traumatic events can include serious accidents or illness, physical or sexual assault, and neglect. This exposure rate is likely to be considerably higher for those working in trauma-prone occupations such as the military, emergency services, and in less developed countries where traumatic events are more commonplace [2]. Following exposure to a traumatic event, many individuals will experience a degree of short-term distress; however, the majority will recover in time without the need for formal psychological treatment. In a minority of cases, traumatic experiences can lead to psychological injuries which may manifest as adjustment disorders, Post-Traumatic Stress Disorder (PTSD) or depression. In particular, the development of PTSD can have a profoundly negative impact on one’s quality of life, with symptoms potentially affecting one’s relationships with others, workplace performance, sleeping patterns and daily functioning. PTSD can also have adverse consequences for physical health, with a recent meta-analysis finding PTSD to be significantly associated with musculoskeletal pain, cardio-respiratory symptoms, and gastrointestinal health [3].

Diagnosing PTSD

To meet criteria for a diagnosis of PTSD, the individual is required to have been exposed to ‘actual or threatened death, serious injury or sexual violence’ [4] either through direct contact, witnessing, or by indirectly learning that a very close family member/friend has been exposed to a violent or accidental trauma; or from an accumulation of direct/indirect exposure to aversive details of traumatic event(s) – usually through the course of professional duties (e.g. personnel working with child abuse cases, journalists reporting on violent criminal proceedings) [4]. The Diagnostic and Statistical Manual (DSM-5) details four core symptom clusters (B-E in Table 1) that must be present in order to make a diagnosis of PTSD:

These symptoms must have been experienced for one month or more to meet diagnostic criteria [4]. Up until 2018 there were few differences between the classification of PTSD as described by the DSM and ICD classification systems. However, in 2018, the ICD-11 recognised both PTSD and Complex PTSD (CPTSD) as stress disorders [5]. CPTSD can develop in a subset of individuals who are either particularly vulnerable or where trauma exposure is often prolonged or recurrent, from which escape is difficult or not possible (e.g. experiences of torture, slavery, childhood sexual/physical abuse) [5]. For a diagnosis of CPTSD to be made, an individual must first meet the ICD-11 diagnostic requirements for PTSD and then three additional symptom clusters related to a Disturbance of in Self-Organisation (DSO).

Table 1. DSM-5 PTSD Diagnostic Criteria

Criterion A

Traumatic stressor

Criterion B

Intrusive re-experiencing of the event (such as traumatic nightmares or flashbacks)

Criterion C

Avoidance of reminders of the traumatic event

Criterion D

Alterations in arousal and reactivity (such as hypervigilance, exaggerated startle response, or irritability)

Criterion E

Negative alterations in mood and cognitions (such as persistent negative affect or self-perception, or amnesia for key parts of the trauma not caused by alcohol, head injury and/or drugs)3

Table 2. ICD-11 Complex PTSD Criteria

1. Meets diagnostic requirements for PTSD;

2. Problems in affect regulation;

3. Beliefs about oneself as diminished, defeated or worthless, accompanied by feelings of shame, guilt or failure related to the traumatic event;

4. Difficulties in sustaining relationships and in feeling close to others.

By definition, a diagnosis of PTSD denotes that an individual is experiencing significant functional impairment which can extend to their personal, family, social, educational, occupational or other important areas of functioning. Symptoms of posttraumatic stress in the absence of such impairment does not constitute a diagnosis of PTSD, although may warrant other diagnostic labels, such as a trauma-related adjustment disorder.

Prevalence and Risk Factors for PTSD

Recent estimates have found the one-month prevalence of PTSD in the general UK population is 4.4% [1] with overall prevalence rates being similar between adult men and women. However, young women (16–24 years) have been found to be more likely to meet PTSD criteria (12.6% compared with 3.6% of men of the same age), although this effect declines with age [1]. Rates of PTSD also differ considerably between occupational groups, with prevalence rates of up to 20% of ambulance workers, up to 20% of war reporters, and between 7–30% of combat troops [6,7].

IJOT 19 - 128_Neil Greenberg_F1

Figure 1. Flow chart for PTSD treatment. NICE 2018

While anyone can develop PTSD after a traumatic event, incidence increases with trauma severity. Other risk factors for PTSD include exposure to previous trauma, psychiatric disorder history, lower educational attainment, appraisals of the work in operational theatre as being above an individual’s trade or experience, and low unit/organisation morale or poor social support [8,9]. PTSD is also highly comorbid with other mental health disorders, with comorbidity rates often greater than 80%. The most common comorbid conditions are depression, anxiety, and substance misuse [8].

PTSD Treatment

Formal therapeutic intervention is often unnecessary in the first month following trauma exposure; in fact, evidence suggests that the early provision of psychological debriefing or trauma-counselling is potentially harmful as it may increase the likelihood of longer-term mental disorders (National Institute For Health And Care Excellence [NICE], [10]). Instead, having social support and a temporary reduction in exposure to stressors facilitates recovery in most cases. NICE guidelines advocate ‘active monitoring’ of distressed trauma-exposed individuals in the first month post-incident [10].

Evidence shows that therapies that involve an element of talking about the traumatic experiences tend to have better outcomes than supportive counselling or by managing symptoms with psychiatric medication alone [10]. Several specialist trauma-focused psychological interventions have been developed to effectively address PTSD, including exposure therapy, Trauma Focused Cognitive Behaviour Therapy (TF-CBT) and Eye Movement Desensitisation and Reprocessing (EMDR). TF-CBT has been found to be effective for improving PTSD symptoms following exposure to a variety of trauma types, including sexual assault, childhood abuse and combat trauma. EMDR is also a mainstream PTSD treatment although not recommended for war-related PTSD. Both treatments are generally delivered as 8 to 12 weekly sessions. NICE guidelines currently endorse TF-CBT for individuals who present with PTSD one to three months post-trauma. For individuals whose PTSD symptoms have been present for longer than three months, TF-CBT should also be offered but it is likely they will require additional sessions [10].

Medication for PTSD is not recommended as a routine first-line treatment strategy, although it can often be complimentary in treating symptoms and comorbid depression, or severe hyperarousal. NICE guidelines advise that Selective Serotonin Reuptake Inhibitor (SSRI), such as sertraline, or venlafaxine is considered for adults with a diagnosis of PTSD if the patient has a preference for drug treatment [10].

Role Of Healthcare Professionals

During the course of clinical practice, healthcare professionals may encounter patients who have been exposed to a range of traumas, including providing physical care for those who have been physically injured in traumatic events. The NICE guidelines recommend healthcare professionals ask questions about trauma exposure – providing the patient with examples of potential traumatic events. Questions should also include whether the patient has experienced specific symptoms (e.g. avoidance, dissociation, nightmares, hyperarousal, etc.) [10].

While some healthcare professionals may feel ill-equipped to ask about trauma exposure or have concerns that such questions may provoke further patient distress, they should not avoid doing so. Being able to discuss a traumatic experience can be cathartic and, if distress is evident, then a referral for a formal assessment can be arranged. Asking about trauma exposure, and associated symptoms, sensitively as well as the impact that the trauma has had on a patient’s daily functioning, should be within the capability of all healthcare professionals. For example, an orthopaedic surgeon should consider and feel confident asking such questions when treating a patient who has suffered life changing injuries following a road traffic accident.

 Individuals who are identified as having PTSD should be provided with appropriate guidance about the condition (e.g. the Royal College of Psychiatrist PTSD information leaflet) and advised to attend a formal mental health assessment, particularly where there are concerns about the chronicity or severity of symptoms. Information should also be provided to the family members or caregivers about supporting their loved one following a traumatic event. Families/caregivers may also help encourage individuals to attend formal assessments which is important as avoidance is a key PTSD symptom and unfortunately most people in the UK who have PTSD do not receive any professional intervention [1].

Particularly following workplace trauma, there is good evidence that peer-support programmes can be especially effective in facilitating recovery [11]. In a UK military context, investing in efforts to improve informal and formal support for trauma-exposed troops has been found to be successful, both in protecting the mental health of personnel and in reducing the stigma around mental health problems within the military [6]. Thus, it may be beneficial for healthcare professionals to be provided with information regarding local organisations and peer-support groups, such as MIND, Big White Wall or the Veterans Gateway for military veterans.

It should be noted that while the media often portrays certain groups, such as emergency service personnel or military veterans, as being particularly reluctant to seek help for mental health difficulties, a failure to seek formal support for trauma-related psychological problems reflects a societal issue rather than the mindset of specific professions [1]. Therefore, it is recommended that healthcare professionals encourage patients and colleagues with chronic and impairing trauma-related symptoms to access social support or formal treatment. A further consideration is that treatment options for more complex presentations of PTSD, while available on the NHS can be challenging to access depending on where someone lives.

As with any mental health problem, the family members of an individual suffering with PTSD can also be vicariously affected. Research has shown that spouses and children of individuals with PTSD can experience significant mental health difficulties themselves, including secondary PTSD symptoms and emotional dysregulation problems [12, 14]. The provision of psychoeducation to families, an assessment of family member’s needs, as well as emotional support may be beneficial to augment familial coping.

Summary

In summary, while most people who experience traumatic events may have short-term distress, only a minority will develop PTSD. PTSD can have a debilitating effect on not only their lives, but the lives of their families, colleagues and friends. In the initial period after a traumatic event, the majority of people benefit from access to social support and a temporary reduction in stress. For the minority who do develop PTSD, there are evidence-based talking trauma-therapies which can improve functioning and psychological wellbeing. While it is ideal to access such treatments within months of a trauma, so that the negative impact on one’s life is kept to a minimum, treatment can be effective even after a delay – allowing those with PTSD to continue to lead fulfilling lives once again, even if the full resolution of symptoms is not possible in some cases.

References

  1. Fear NT, Bridges S, Hatch S, Hawkins V, Wessely S (2016) Posttraumatic stress disorder. In: McManus S, Bebbington P, Jenkins R BT (eds), editor. Mental health and wellbeing in England: Adult Psychiatric Morbidity Survey.  Leeds: NHS Digital, Leeds, England Pg No: 991.
  2. Perkonigg A, Kessler RC, Storz S, Wittchen H-U (2016) Traumatic events and post-traumatic stress disorder in the community: prevalence,risk factors and comorbidity. Acta Psychiatr Scand 101: 46–59.
  3. Pacella ML, Hruska B, Delahanty DL (2013) The physical health consequences of PTSD and PTSD symptoms: A meta-analytic review. J Anxiety Disord 27: 33–46.
  4. American Psychiatric A. (2013) Diagnostic and Statistical Manual of Mental Disorders (DSM-5®) [Internet]. American Psychiatric Pub Pg No: 991.
  5. World Health Organisation. (2018) ICD-11 – Mortality and Morbidity Statistics.
  6. Greenberg N, Jones E, Jones N, Fear NT, Wessely S (2010) The injured mind in the UK Armed Forces. Philos Trans R Soc B Biol Sci 366: 1562.
  7. McFarlane AC, Williamson P, Barton CA (2009) The impact of traumatic stressors in civilian occupational settings. J Public Health Policy 30: 311–27.
  8. Bisson J, Ehlers A, Matthews R, Pilling S, Richards D, et al. (2007) Psychological treatments for chronic post-traumatic stress disorder. Br J Psychiatry 198: 97–104.
  9. Iversen AC, Greenberg N (2009) Mental health of regular and reserve military veterans. Adv Psychiatr Treat 15: 2.
  10. National Institute for Health and Care Excellence N. Post-traumatic stress disorder: management (2018).
  11. Brooks S, Amlôt R, Rubin GJ, Greenberg N (2018) Psychological resilience and post-traumatic growth in disaster-exposed organisations: overview of the literature. J R Army Med Corps Pg No: 1–5.
  12. Leen-Feldner EW, Feldner MT, Knapp A, Bunaciu L, Blumenthal H (2013) Offspring psychological and biological correlates of parental posttraumatic stress: Review of the literature and research agenda. Clin Psychol Rev 33: 1106–33.
  13. Diehle J, Brooks SK, Greenberg N (2016) Veterans are not the only ones suffering from posttraumatic stress symptoms: what do we know about dependents’ secondary traumatic stress? Soc Psychiatry Psychiatr Epidemiol  Pg No: 1–10.
  14. Williamson V, Stevelink SAM, Da Silva E, Fear NT (2018) A systematic review of wellbeing in children: a comparison of military and civilian families. Child Adolesc Psychiatry Ment Health Pg No: 12: 46.

Hemiarthroplasty or Total Hip Replacement for intracapsular Hip Fractures? A Dilemma in Trauma Surgery

Hip fractures in the elderly are a common and devastating injury, placing a considerable burden on healthcare systems around the world. In the UK there are over 70,000 hip fractures annually, costing around £2billion [1].Given the ever-ageing population, future estimates suggest that that over 6 million hip fractures/year will occur worldwide by 2050 [2].Mortality and morbidity following these injuries remains high, in England with a 30-day mortality of 8.5% [3].

Displaced intracapsular fractures are at risk of non-union and avascular necrosis, and treatment in the form of a hemiarthroplasty or Total Hip Replacement (THR) is recommended [4]. The choice between these remains controversial [5], with potential benefits and risks associated with each. Traditionally, hemiarthroplasty has been the mainstay of treatment as it is less complex and thus quicker surgery, with reduced bleeding and complications [6]. However, some studies suggest improved function following a THR [7], and surgeons worry about long-term acetabular wear from hemiarthroplasties, and the subsequent need for conversion to a THR [8].

Population studies in the USA [9], Finland [10] and South Korea [11] have shown trends demonstrating increasing utilisation of THR in these patients for this fracture. In the UK, in 2011, the National Institute of Health and Clinical Excellence (NICE) produced guidance on when a THR should be offered to hip fracture patients [12]. They recommended offering a THR to patients who: (a) could walk independently, (b) were not cognitively impaired, and (c) were medically fit for anaesthesia and the procedure [12]. By 2017 the first of these criteria was revised to patients who are able to walk independently outdoors with no more than the use of a stick [13]. Despite this, in the UK compliance to NICE guidelines remains poor, with one study, published in 2016, of over 100,000 patients showing less than a third of eligible patients received a THR [4].

Several potential reasons exist regarding this low compliance. First, these cases require an experienced arthroplasty surgeon [4], not always feasible especially in smaller centres, contributing to a delay in treatment, and increased morbidity and mortality. In our unit, we have shown in an as of yet unpublished retrospective study of patients who all met the NICE criteria that those receiving a THR waited considerably longer than hemiarthroplasty patients (3.7 days versus 1 day respectively, P < 0.05). Second, it has been acknowledged the precise indications for THRs in hip fractures are not well defined [4] with some authors feeling the current NICE criteria are too inclusive [14], particularly in patients with significant co-morbidities (the most common reason hemiarthroplasties were chosen over THRs) [14]. This was supported as hemiarthroplasty patients were older, and had significantly increased 1 year mortality, suggesting greater frailty in these patients, despite all being eligible for THRs [14]. In our local study we too found those undergoing a hemiarthroplasty were older (mean age 83 vs 73 years) and had an increased 1 year mortality (18.2% vs 8.3%), despite all patients meeting NICE criteria.Indeed, one population-based study on THR usage in hip fractures showed NICE guidance was less likely to be followed in older patients, and those with worse cognition, ASA grade and ambulatory status [4].

The literature on the outcome of THRs compared to hemiarthroplasties is also equivocal, with a variety of studies supporting each approach. One recent meta-analysis of prospective studies supported THR [15], demonstrating improvements in function as measured by the Harris Hip Score (HHS) and Quality of Life (SF-36), reduced re-operation rates [15]and beyond 4 years no difference in dislocation rates [15].However, the authors acknowledge inconsistencies in trial design [15], and it is worth noting the implants and selection criteria varied widely between studies. Interestingly, the authors also conclude those patients older than 80 years, or those with a short life expectancy, both THR and hemiarthroplasty are both reasonable interventions [15].

Another retrospective UK study using over 7,000 matched patients, on a national database, showed no difference in revision rates between implants [16]. This finding was reinforced by another study showing the conversion rate of hemiarthroplasties to THRs for acetabular wear was low, particularly in older patients (1.4% in patients older than 75 years) [8].

The short to medium term dislocation rate in THR patients has been shown to be significantly higher than for hemiarthroplasty patients [16,17]. A randomised prospective study assessing long-term outcomes at 12 years found no difference in complication or re-operation rates between groups, and actually demonstrated equivalent function as measured using the modified HHS [5]. This study concluded by advising cemented hemiarthroplasty in hip fracture patients aged greater than 70 years, in the absence of radiological evidence of joint degeneration [5].

In conclusion, THR surgery was once famously described as the ‘operation of the century [18], helping to revolutionise the management of patients crippled with osteoarthritis [18]. Its role in these patients is not disputed. However its role in trauma remains controversial [5]. We feel THR can also achieve excellent results in hip fracture patients, but at present the ideal patient, and precise indications are not well defined [4]. Furthermore emergency surgery is usually defined ‘as life or limb saving’ which should be as simple and expeditious as possible, particularly in the elderly and infirm. The decision for THR or hemiarthroplasty is multi-factorial and includes surgical experience, facilities and importantly patient morbidity/ASA, frailty and age. It is our opinion that current NICE guidelines are too inclusive. Until more conclusive data shows otherwise, surgical decision-making should remain at the discretion of the attending surgical team and local circumstances.

References

  1. Royal College of Physicians (2014)  National Hip Fracture Database annual report London
  2. Dhanwal DK, Dennison EM, Harvey NC (2011) Epidemiology of hip fracture: worldwide geographic variation. Indian J Orthop 15–22.
  3. Neuburger J, Currie C, Wakeman R (2015) The impact of a national clinician-led audit initiative on care and mortality after hip fracture in England: an external evaluation using time trends in non-audit data. Med Care 686–91.
  4. Perry DC, Metcalfe D, Griffin XL (2016) Inequalities in use of total hip arthroplasty for hip fracture: population based study. BMJ
  5. Tol CJM, van den Bekerom MPJ, Sieneveldt (2017) Hemiarthroplasty or total hip arthroplasty for the treatment of a displaced intracapsular fracture in active elderly patients. 12-year follows up of randomised trial. Bone Joint J 250–54
  6. Keating J, Grant A, Masson M (2005) Displaced intracapsular hip fractures in fir, older people: a randomised comparison of reduction and fixation, bipolar hemiarthroplasty and total hip arthroplasty. Health Technol Assess1–65.
  7. Avery PP, Baker RP, Walton MJ (2011) Total hip replacement and hemiarthroplasty in mobile, independent patients with a displaced intracapsular fracture of the femoral neck: a seven-to ten-year follow-up report of a prospective randomised controlled trial. J Bone Joint Surg Br 93: 1045–8.
  8. Grosso MJ, Danoff JR, Murtagh JS (2017) Hemiarthroplasty for displaced femoral neck fractures in the elderly has a low conversion rate. J Arthroplasty 32: 150–54.
  9. Bishop J, Yang A, Githens M (2016) Evaluation of contemporary trends in femoral neck fracture management reveals discrepancies in treatment. Geriatr Orthop Surg Rehabil 7:135–41.
  10. Hongisto MT, Pihlajamaki H, Niemi S (2014) Surgical procedures in femoral neck fractures in Finland: a nationwide study between1998 and 2011. Int Orthop 38: 1685–1690.
  11. Lee YK, Ha YC, Park C (2013). Trends of surgical treatment in femoral neck fracture: a nationwide study based on claim registry. J Arthroplasty 28: 1839–1841.
  12. National Institute for Health and Clinical Excellence (2011). NICE clinical guideline 124. Hip fracture: the management of hip fracture in adults. NICE
  13. National Institute for Health and Clinical Excellence (2017) NICE clinical guideline 124 (addendum).  Hip fracture: the management of hip fracture in adults. NICE
  14. Walker LC, Lee LH, Webb M (2016) Provision of total hip replacement for displaced intracapsular hip fracture and the outcomes: an audit of local practice based on NICE guidelines. Hip Int 26: 153–7.
  15. Lewis DP, Waever D, Thorninger R (2019) Hemiarthroplasty vs Total hip arthroplasty for the management of displaced neck of femur fractures: a systematic review and meta-analysis. J Arthroplasty; 34:1837–1843.
  16. Jameson SS, Lees D, James P (2013) Cemented hemiarthroplasty or hip replacement for intracapsular neck of femur fracture? A comparison of 7732 matched patients using national data. Injury 44: 1940–44.
  17. Van den Bekerom MP, Hilverdink EF, Sierevelt IN (2010) A comparison of hemiarthroplasty with total hip replacement for displaced intracapsular fracture of the femoral neck: a randomised controlled multicentre trial in patients aged 70 years and over. J Bone Joint Surg Br 92B: 1422–8.
  18. Learmonth ID, Young C, Rorabeck C (2007) The operation of the century: total hip replacement. Lancet 370: 1508–1519.

A Case of Necrotizing Fasitis in a Patient Injecting Pomegranate Juice into Her Thigh

Introduction

Necrotizing Fasciitis (NF) is a disease characterized by rapidly spreading necrosis of soft tissues and fascia, which can lead to rapid death if not treated appropriately [1, 2]. Etiology includes surgical incision, insect sting, incision, abrasion, contusion, injection, skin ulcer, perirectal abscess, incarcerated hernia, burn, splinter ingestion, birth and penetrating trauma [3]. In 70% of NF cases, the agent can be isolated in wound culture; 20% for blood culture. Gram-positive bacteria are in the foreground and 70–90% of the cases are polymicrobial [4].

Early diagnosis, broad-spectrum antibiotic therapy and surgical debridement are essential. Despite treatment, 30% of the patients die [5]. In this case report, we wanted to report the treatment of a NF patient who injected pomegranate juice with the thought of storing energy in his right thigh and right elbow of a drug addict, homeless and foreign national (Ukrainian Citizen) with serial debridement and skin grafting.

Case

A 36-year-old male patient of unknown nationality who was abandoned to the emergency department was consulted with the preliminary diagnosis of abscess in the extremities. In the examination of the patient; swelling, redness and ballotmaning of the right hip compared to the left hip. He also had an infected discharge wound on the anterior face of the right elbow. The patient’s general condition was fond, orientated, cooperative. Glaskow coma score was 14 and neurological examination was normal. In laboratory tests CRP: 326 mg / l, WBC: 23.19 10³ / mcl, Hb: 12.9 g / dl, Na: 134mmol / L, creatinine: 0.8 mg / dl (70.7 mmol / L), glucose: 122mg / dl ( 11.3 mmol / L). In the presented case, the LRINEC (Laboratory Risk Indicator for Necrotizing Fasciitis) score was calculated to be 8 during the first application (Table I).

On radiological examinations, X-ray radiography showed gas shadows compatible with NF in the right thigh region (Figure 1). MRI; Fluid collections were observed starting from the right gluteal region and extending to the proximal of the thigh, the largest of which was approximately 6.5 × 4 cm lateral to the proximal section of the thigh (abscess?) (Figure 2). Superficial tissue USG; There were diffuse edema findings in the right arm and a 45mm collection-abscess.

Table 1. Laboratory Risk Indicators for Necrotizing Fasciitis (LRINEC).

Value

LRINEC score

Values of the case

C-reaktif protein (mg/L)

<150

>150


0

4


326

White blood cell count (cell/mm3)

<150

15–25

>25


0

1

2


23

Hemoglobin level (g/dL)

>13.50

11–135

<11


0

1

2


12.9

Sodium level (mmol/L)

≥135

<135


0

2


134

Creatinine level (mg/dL)

≤1.6

>1.6


0

2


0.8

Olucoie dOzeyi (mg/dL)

≤180

>180


0

1


122

Emergency debridement was planned in the emergency department within 6–8 hours due to worsening of the general condition, high infection parameters, hemodynamic instability, change in consciousness and septic shock. Radical debridement, abscess drainage, abundant washing was performed and culture samples were taken in the operating room conditions (Figure 3,4). He was transferred to the postoperative intensive care unit. Subsequently, serial debridement was performed 5 times at 48 hour intervals. At each debridement stage, the patient was evaluated for amputation. In this process, he was treated by infectious diseases according to the patient’s clinic, blood parameters and culture results. Two weeks later, when he did not need intensive care, he was transferred to the orthopedic clinic. The patient underwent re-debridement and a Vacuum-Assisted Wound Care System (VAC) was applied.

In the wound culture sample, Escherichia Coli was produced. Methicillin-resistant Staphylococcus epidermidis was isolated in blood cultures. One week later, Acinetobacter Baumannii was isolate in blood culture too. 2 weeks after admission CRP was 141 mg / l, WBC was 11.99 × 10³ / mcl, Hb value was 8.3 g / dl, Na: 137 mmol / L, Kr: 0.44 mg / dl (38.5 mmol / L), glucose: 77mg / dl (7.13 mmol / L). LRINEC score was 2.

As a result of the complete disappearance of infection findings 1.5 months later, wound areas were closed with skin grafts taken from the opposite thigh (Figure 5,6). After the lack of medical needs of the patient for lack permission to remain in Turkey it was deported by mobile discharged. The whole process took 2.5 months.

IJOT 19 - 125_Ertürk C_F1

Figure 1.F X-ray image of gas shadows on patient’s right thigh

IJOT 19 - 125_Ertürk C_F2

Figure 2. MRI image of abscess on the right thigh of the patient

IJOT 19 - 125_Ertürk C_F3

Figure 3. Drained abscess on the right elbow of the patient

IJOT 19 - 125_Ertürk C_F4

Figure 4. Perop right thigh drainage image

IJOT 19 - 125_Ertürk C_F5

Figure 5. Right thigh image after serial debridements

IJOT 19 - 125_Ertürk C_F6

Figure 6. Appearance of the thigh after grafting

Discussion

Although rare, every surgeon treats at least one NF case throughout his life [6]. Rapidly spreading necrosis can cause systemic sepsis, toxic shock syndrome and multiorgan failure [7]. The patient was in septic shock when we operated.

LRINEC risk score was accepted as high risk with 8 points at the first admission [8]. Early, aggressive treatment is required and necrotizing fasciitis is an surgical emergency [9]. The patient should be evaluated as a whole and the decision of amputation should be reviewed at every stage. The recommended intravenous antibiotic therapy depends on the etiological factors; however, clindamycin, penicillin and third-generation cephalosporins can be started empirically [10].

Delay of the first debridement may increase mortality up to 71% [11]. Although we considered the possibility of amputation after each debridement in our case, we have always emphasized limb sparing surgery [3]. In addition, the length of hospital stay in NF cases brings a significant financial burden [12].

As a result; Many problems were dealt with during the diagnosis, treatment and discharge phase of the patient, who was a foreign national, had no relatives and no insurance. We tried to apply the early diagnosis, antibiotic therapy and surgical debridement approaches, which are the principle of NF, appropriately. After serial debridement, wound and blood culture, antibiotic therapy and VAC treatment, skin grafting was applied to the wounds. With the treatment principles, the patient’s survival and return to life were achieved.

References

  1. Trent JT, Kirsner RS (2002) Diagnosing necrotizing fasciitis. Adv Skin Wound Care 15: 135–8.
  2. File TM Jr, Tan JS, DiPersio JR (1998) Group A streptococcal necrotizing fasciitis. Diagnosing and treating the “flesh-eating bacteria syndrome”. Cleve Clin J Med 65: 241–9.
  3. Carter PS, Banwell PE (2004) Necrotising fasciitis: a new management algorithm based on clinical classification. Int Wound J 1: 189–98.
  4. Shaikh N, El-Menyar A, Mudali IN, Tabeb A, Al-Thani H (2015) Clinical presentations and outcomes of necrotizing fasciitis in males and females over a 13-year period. Ann Med Surg (Lond) 4: 355–60.
  5. Sun X, Xie T (2015) Management of Necrotizing Fasciitis and Its Surgical Aspects. Int J Low Extrem Wounds. 14: 328–34.
  6. Naqvi GA, Malik SA, Jan W (2009) Necrotizing fasciitis of the lower extremity: a case report and current concept of diagnosis and management. Scand J Trauma Resusc Emerg Med Pg No: 17–28.
  7. Fichev G, Kostov V, Marina M, Tzankova M (1997) Fornier’s gangrene: a clinical and bacteriological study. Anaerobe 3: 195–7.
  8. Wong CH, Khin LW, Heng KS, Tan KC, Low CO (2004) The LRINEC (Laboratory Risk Indicator for Necrotizing Fasciitis) score: a tool for distinguishing necrotizing fasciitis from other soft tissue infections. Crit Care Med 32: 1535–41.
  9. McDonald LS, Shupe PG, Raiszadeh K, Singh A (2014) Misdiagnosed pneumothorax interpreted as NF of the chest wall: case report of potentially prevntable death. Patient Saf Surg 8: 20.
  10. Shaikh N, El-Menyar A, Mudali IN, Tabeb A, Al-Thani H (2015) Clinical presentations and outcomes of necrotizing fasciitis in males and females over a 13-year period. Ann Med Surg (Lond) 4: 355–60.
  11. Kuncir EJ, TillouA, Hill CR, Ptrone P, Kimbrell B, Asencio JA (2003) Necrotizing soft tissue infections. Emerg Med Clin North Am 21: 1075–87.
  12. Widjaja AB, Tran A, Cleland H, Leung M, Millar I (2005) The hospital costs of treating necrotizing fasciitis. ANZ J Surg 75: 1059–64.

Promoting Medication-Adherence by Uncovering Patient’s Mindsets and Adjusting Clinician-Patient Communication to Mindsets: A Mind Genomics Cartography

Abstract

We present a new approach to understanding how patients want doctors to communicate to them. The approach uses Mind Genomics, an emerging science in experimental psychology, which looks at the way people make decisions about the everyday. Respondents in an experiment evaluated different combinations of messages (elements) in vignettes. The results suggest three minds (privacy-oriented; doctor oriented; control-oriented), requiring three different types of messages. These mind-sets also pay attention to the messages in different ways, as shown by the pattern of their response times. We present a PVI (personal viewpoint identifier), which in six questions can suggest the mind-set to which a new person might belong.

Introduction

Patient self-management programs are the aim of health systems and public health policy makers. The main goal of health systems is to improve clinical outcomes of patients by engaging them to adhere to medications, to adopt a healthy lifestyle and to properly manage their illnesses. Patient adherence is defined as the degree to which patients follow physician’s guidelines and recommendations. Patient non-adherence has been a challenge for clinicians with evidence indicating that 25% to 50% of patients are non-adherent [1–4]. Furthermore, patients suffering a more severe illness in serious diseases were surprisingly less adherent [5]. Consequently, across illnesses non-adherence results in comorbidities, re-admissions to hospitals, in lower quality of life and in economic burdens for public health systems. Adherence to guidelines and medications was found to promote illness-self management (e.g., appointments, screening, exercise, and diet).Adherence is affected by: clinician-patient relationship, the illness itself, the treatment, patient characteristics and socioeconomic factors [6].

Patients expect their physicians to inspire them through communication leading to patient trust which is strongly related to medication-adherence[7–9]. Physician-patient communication was found to enhance patient adherence to decrease re-admissions [10,11]. To promote adherence patients need to understand the illness, the risks it entails and the treatment benefits [11]. Clinician-patient communication is an essential in adherence promotion [11–14]. Moreover, the odds of patient adherence are 2.16 times higher if a clinician communicates effectively [2,5,15].

Communication entails support, empathy and compassion leveraging collaborative patient-physician decision-making [9,12]. Whereas ‘content communication’ focuses on clinical aspects of the disease (e.g., the illness, the treatment regimens), ‘process communication’ focuses on psychosocial aspects (motivation, drivers, life–meaning, gathering information about the patient and environment, understanding how to remove barriers to adherence and identifying steps in the change process towards adherence.

‘Process communication has been report found to effectively raise patient-adherence [2,10,16–19]. Furthermore, patients who perceived their clinicians as their partners to the change process demonstrated a 19% higher medication-adherence. Furthermore, training physicians on ‘process communication’ improved patient-adherence by 12% [5,18,19]Essentials of behavioral research: methods and data analysis McGraw-Hill; 2007.

Despite evidence those clinicians’ skills of process communication are central to patient-adherence; clinicians mostly use content communication and have difficulties crossing this chasm [20]. Several factors underlie the challenge of crossing this chasm. First, there is a lack of sufficient training on psychosocial communication during and after medical school [20]. Second, there is a low prioritization of such skills in training programs [21]. Third, there is a lack of incentives for physicians to participate in such training [22]. Finally, there are misconceptions among physicians who perceive psychosocial communication as time consuming [23] when in fact it requires shorter, more effective time [18].

Previous studies suggest that interventions to improve psychosocial communication among clinicians should focus on a variety of aspects, not just one. These aspects are, respectively, verbal and nonverbal communication, affective communication, psychosocial communication and task-oriented behavior that create opportunities for active patient involvement throughout the change process towards patient-adherence [24]. Previous studies indicate that in order to reduce barriers which stand in the way of optimal health outcomes, communication is to be personalized enabling clinicians to understand what is most relevant for each particular patient and tailor the messages accordingly [4].

But what do we know about the mind of the patient? How can we find out what the patient feels to be important? What does the patient feel is relevant and irrelevant for her or him? In response to existent discourse in the literature, in 2011we conducted an internet experiment using Mind-Genomics to investigate combinations of messages on ‘living with the regimen’ (Moskowitz, unpublished observations).We identified three mind-sets. This study extends the 2011 study looking more closely at messages about how people feel about themselves in terms of how the doctor communicates with them. Our objective is to identify participants by psychographic mindsets so clinicians may quickly identify the belonging of each patient to a mindset and use tailored effective communication congruent to that mindset-segment in the context of medication adherence.

Method

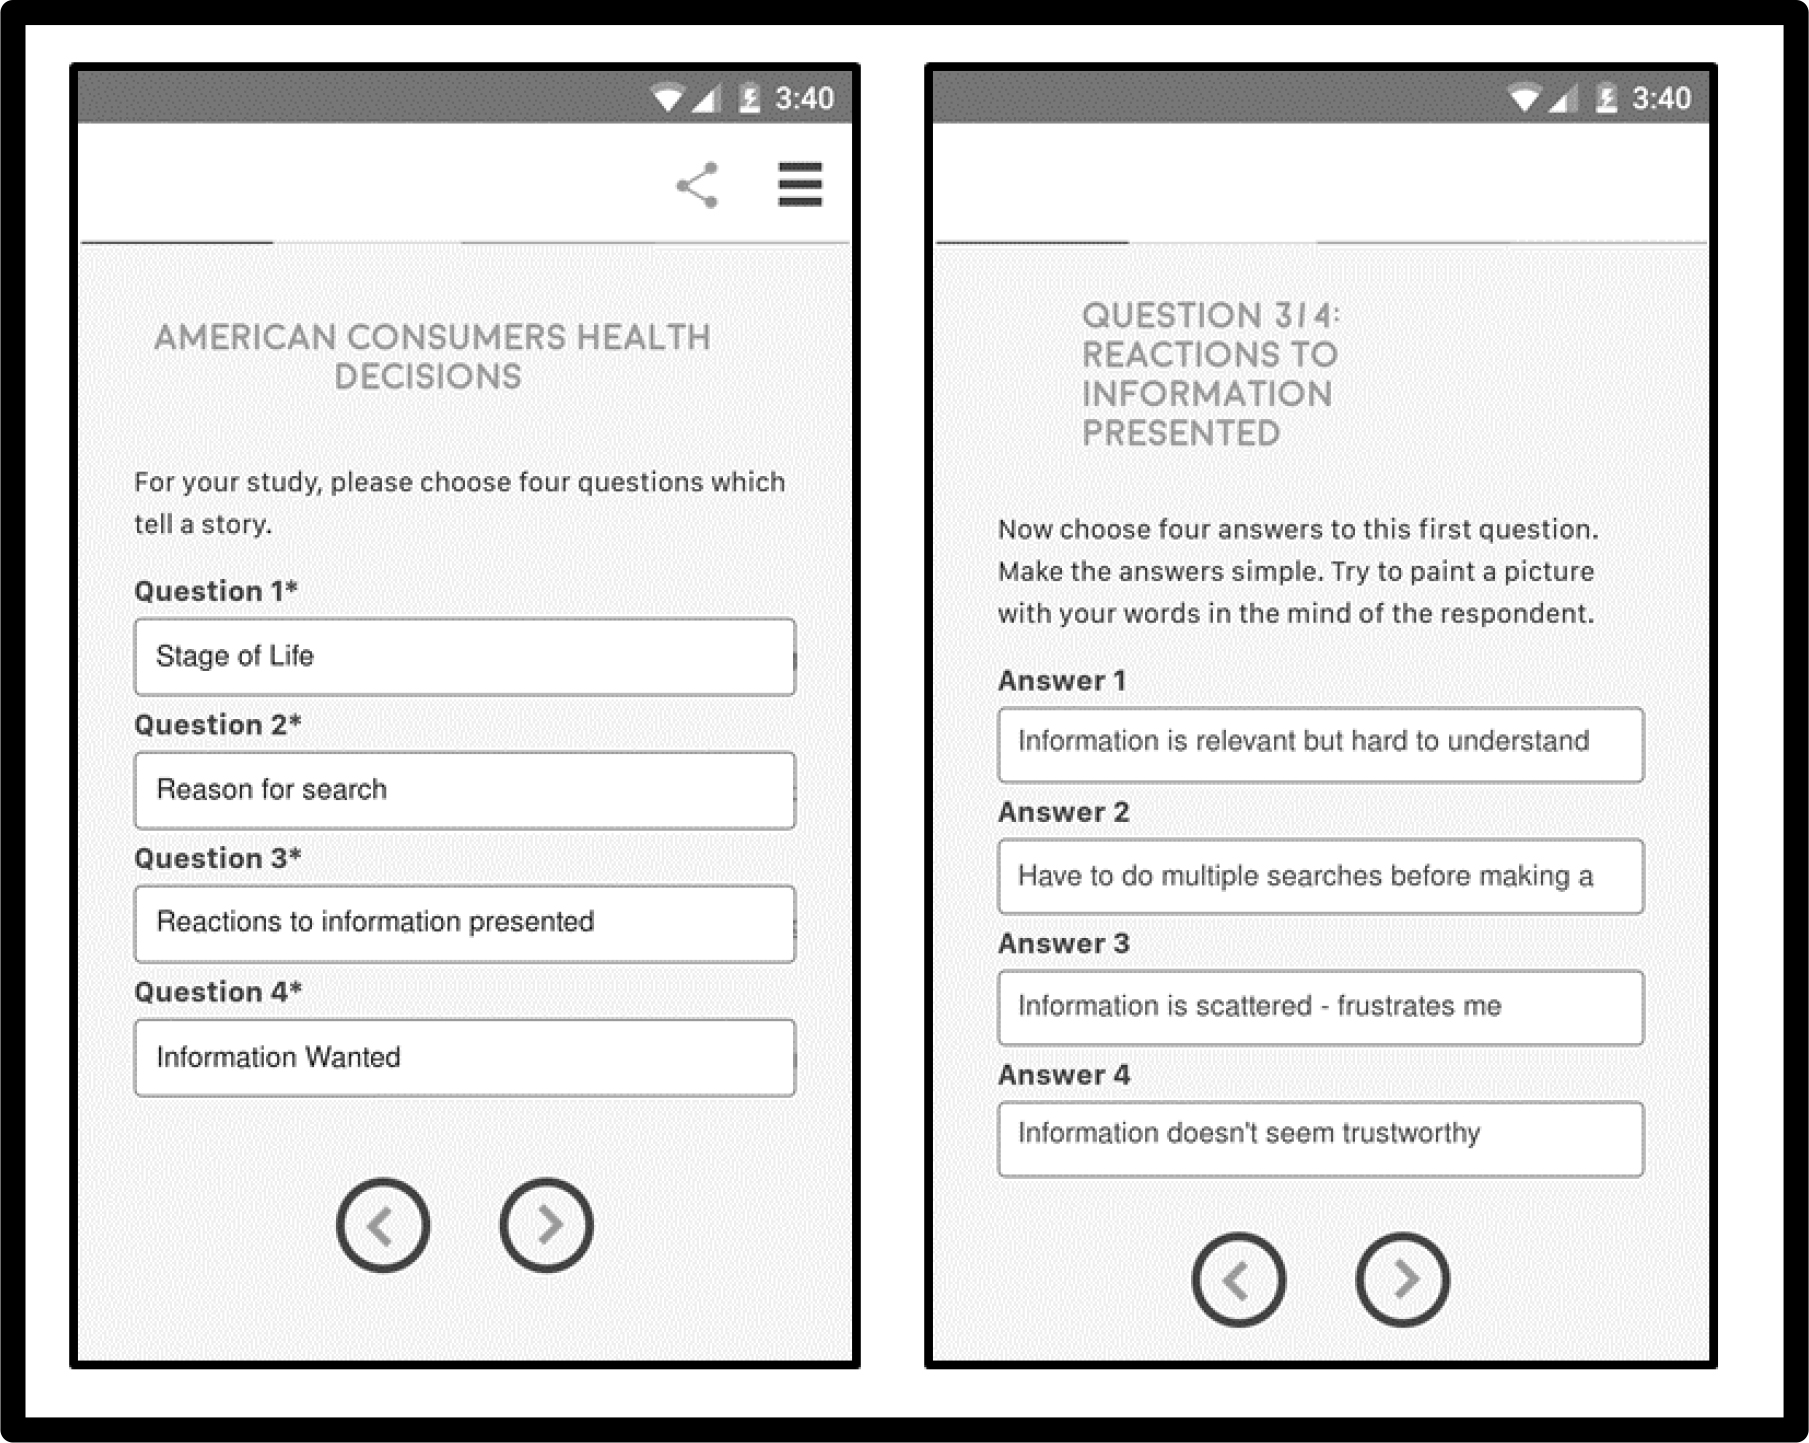
Mind Genomics works in a Socratic fashion, first identifying a topic, then requiring the researcher to ask four questions, and finally requiring the researcher to provide four separate answers to each question. Inspired by existing literature and research instruments, we shaped questions which ‘tell a story’ [25–30]. Once the questions are asked, the answers are quickly provided. Asking the questions forces the researcher to think critically. Table 1 shows the four questions and the four answers to each question. The series of questions probe the way the person feels about information. The ‘story’ underlying the four questions is not sequential, but rather topic, as if an interview were being conducted with a person to under how the person feels about giving and receiving information about his or her own health status.

Table 1. Raw material comprising four questions, and four answers to each question

Question A: How would you like your doctor to discuss your health with you?

A1

Doctor talks to me, face to face… not just those phone calls with clinical message

A2

Doctor explains to me WHY this medicine, and what should I DO

A3

My friends explain this stuff to me… I’m more comfortable with them

A4

Doctor guides me to the Internet sites… so I CAN TAKE CONTROL

Question B: What honestly is your relationship with your health?

B1

I’m pretty private about my health… no one’s business

B2

I don’t feel like going to the doctor… even for the most severe symptoms… I can take care of it

B3

When it comes to illness, I’m on Google, so I really become an expert

B4

I’m nervous about health – but really want to be healthy to see my kids, grandkids, or even relatives and friends in the years to come

Question C: How do you interact with your family about your health?

C1

My family is always there to listen, and support me… I like that

C2

My family and others butt-in to my health… I want my privacy

C3

I really am happy when someone takes control, and tells me what to take, and schedules my meds for me

C4

I’m pretty private… my health meds are my business… and maybe the doctor’s, but that’s all

Question D: Do friends and family play an important role in your life?

D1

My family means the world to me

D2

I reach out to talk to friends about my health and illness

D3

I reserve my friends for non-medical talks, like politics, or people

D4

My friends really are there to listen to me about my medical experience – sometimes I feel I’m wearing out my welcome

Procedure

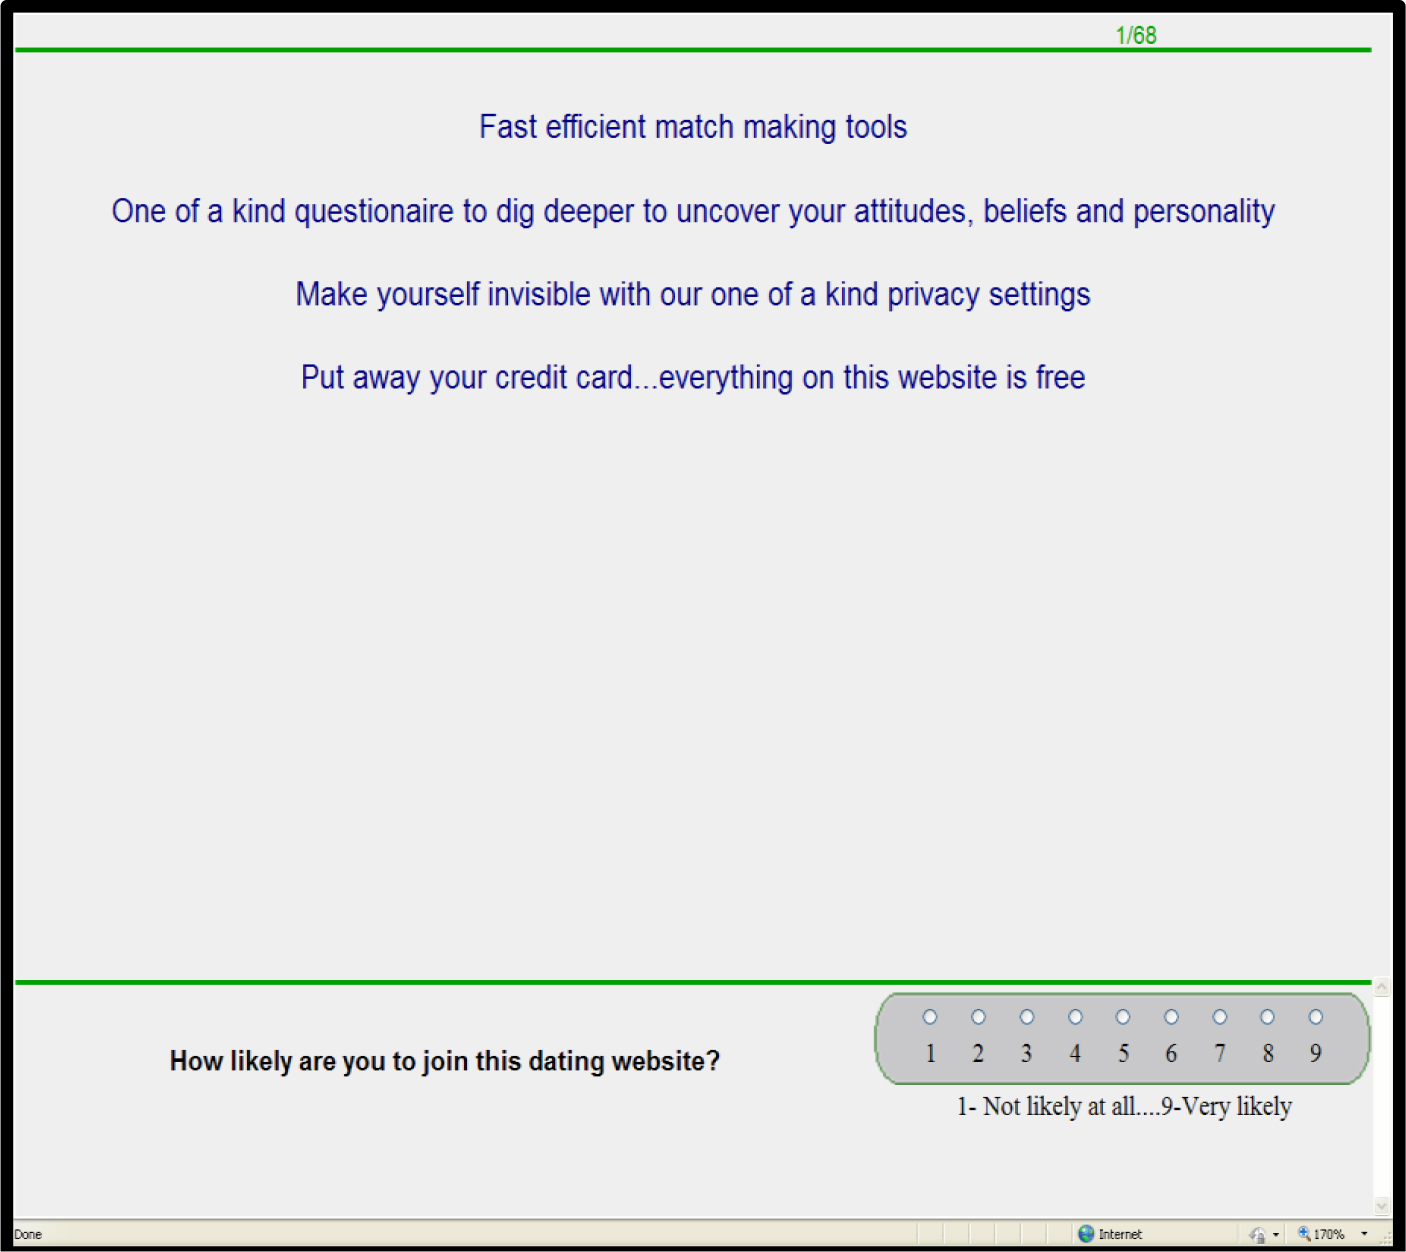
Vignettes: The test stimuli for Mind Genomics comprise easy-to-read vignettes, containing 2–4 answers or elements, at most one answer or element from each question. The vignettes are created according to an experimental design, which prescribes the specific combination. Each respondent evaluated 24 vignettes created according to the same basic design, with the specific combinations changing in a deliberate fashion according to a permutation scheme [31]. Thus, the entire experiment covered 24×100 or 2400 vignettes, most of which differed from each other.

It is important to note that the Mind Genomics approach to understanding is similar metaphorically to the MRI machine, which takes many different ‘pictures’ of the underlying tissue, each picture from a different angle and vantage point. Afterwards, a computer program combines these different views into a single 3-D image of the underlying tissue. Each individual picture may have error, but the entire pattern becomes clear once these individual pictures are combined. In a like fashion, Mind Genomics gets the response to many different vignettes, and then synthesizes the overall pattern. Each individual observation is ‘noisy’ with a base size of ‘1’ but the pattern is not as noisy.

The approach of Mind-Genomics covers a wide range of alternative clinical and psychosocial communication concepts, each with elements revealing response patterns by using various permutations of the same stimuli, responses to different combinations of the answers of elements, in order to obtain a stable estimate of the underlying pattern Conventional science attempts to minimize the error around each observation through replication of the same stimulus (average to increase precision)or through reduction of extraneous factors which could increase the error variability (suppressing noise to increase precision).

The respondents were selected at random from a pool of 20+ million respondents in the United States, with approximately equal distribution of age and gender. The respondents were part of the panel provided by the strategic partner of Mind Genomics, Luc.id, Inc. Respondents were compensated by Luc.id.

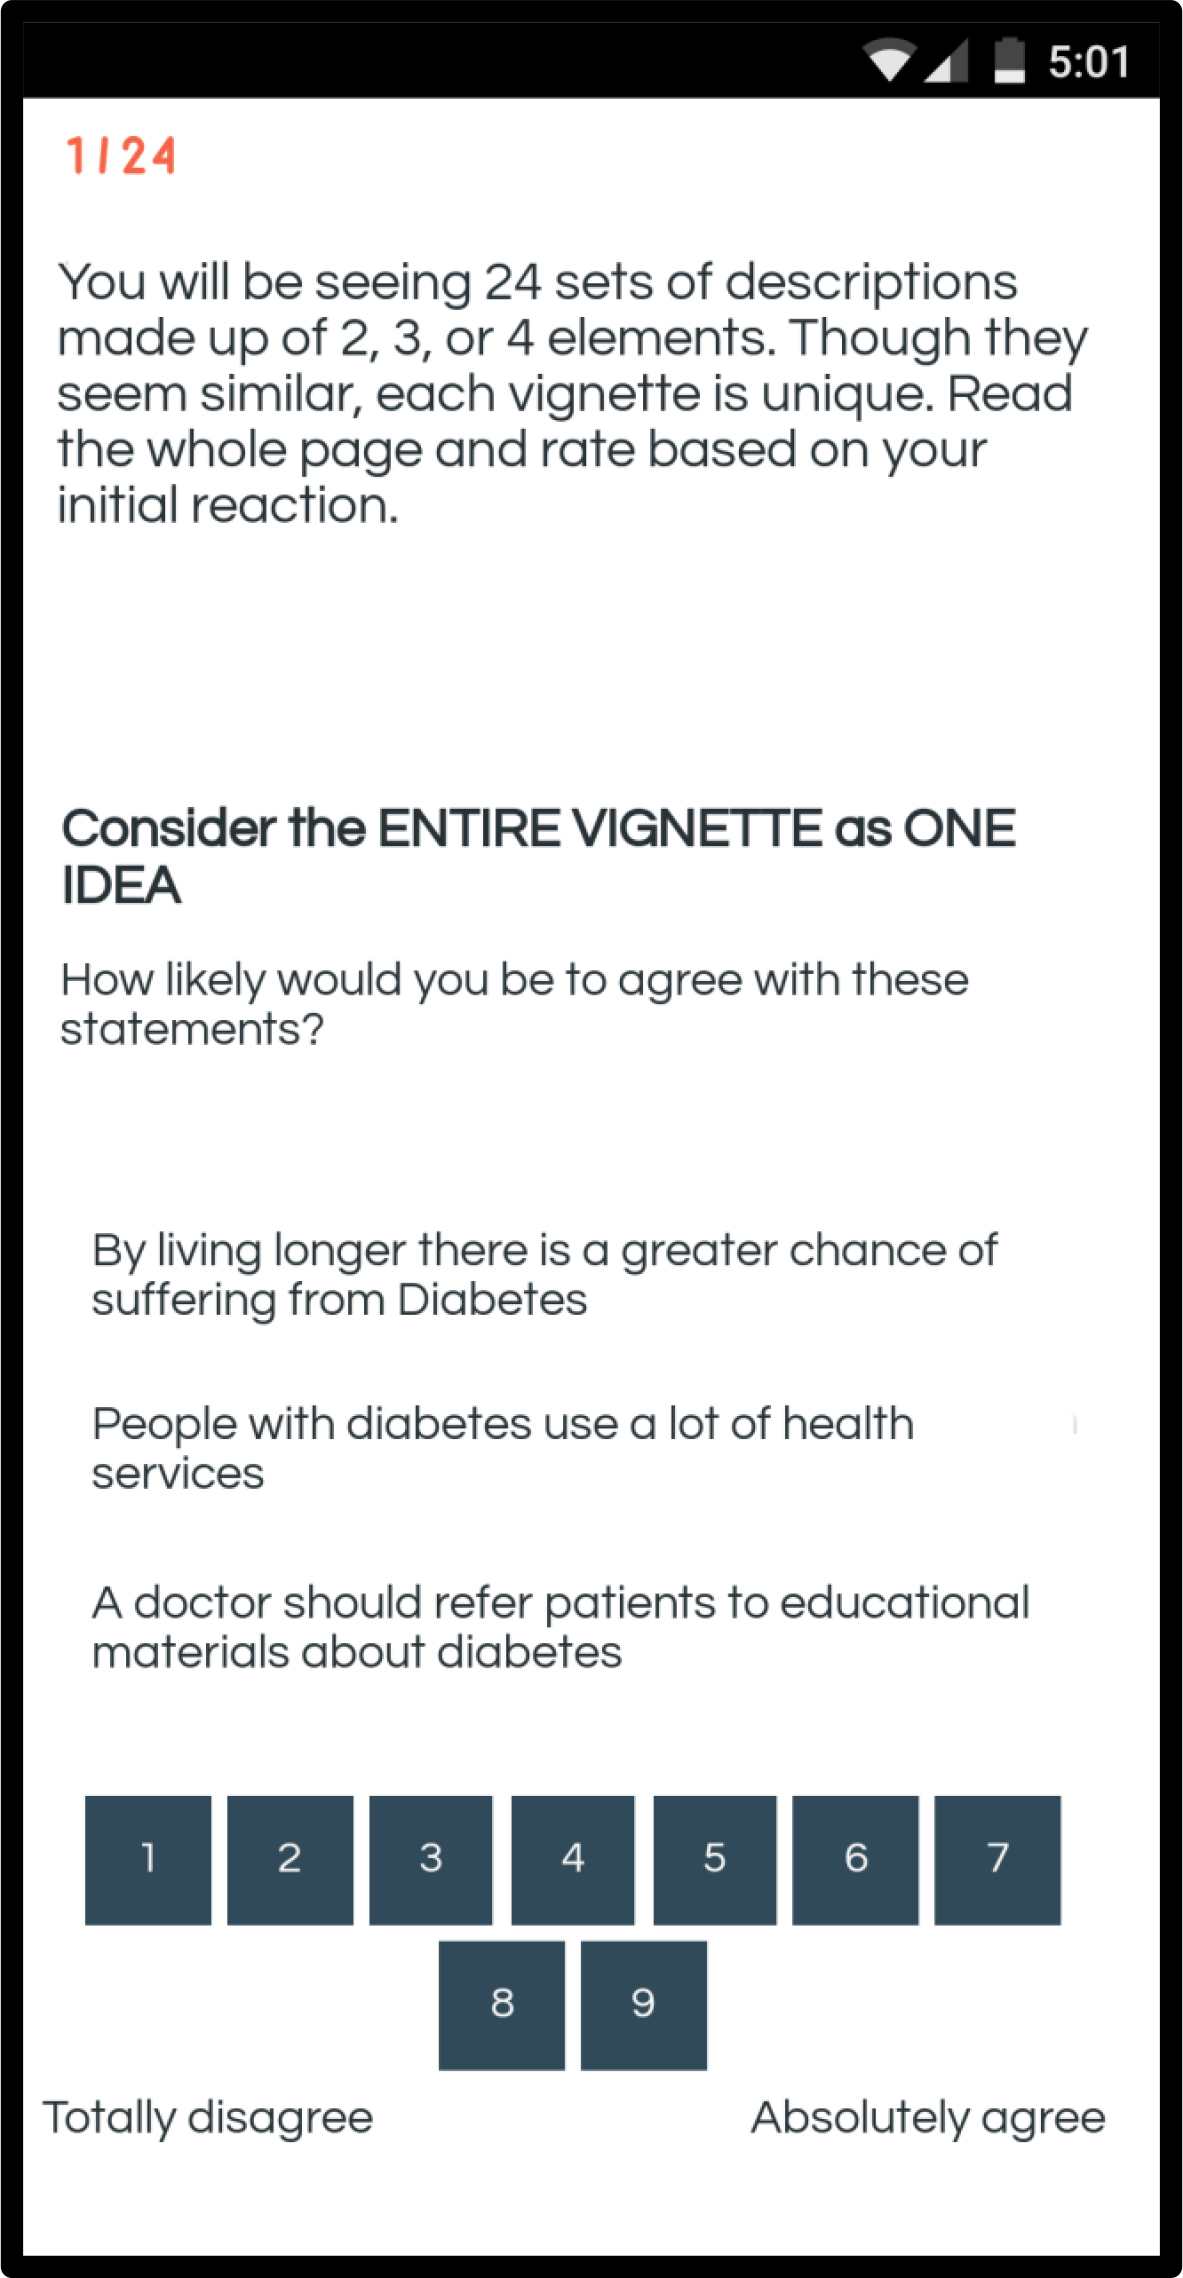
Each respondent who participated clicked on an embedded link in the email invitation and was taken to a first slide which oriented the respondent. The respondent was told to consider the entire vignette, the combination of elements (answers) as a ‘whole’ and to rate it on the scale below. The questions were never shown to the respondent. Only the answers were shown; the questions served simply as a way to elicit the set of appropriate answers that would be shown to the respondent in the vignette.

Imagine if these qualities were reflected on a magnet. How does this capture your thoughts?

1= Not at all like me. If this is a magnet, it just won’t work for me

5= Very much like me. This magnet will really help me

A surface analysis of the responses – distribution and means

Most surveys work with the responses to single questions and compute the mean of the responses. Mind Genomics proceeds by experimentation, presenting the respondent with combinations of answers or elements, and obtains their rating. The actual ratings themselves pertain to different test stimuli. Furthermore, an inspection of the different patterns across gender and ages fails to give us any insight into the mind of the respondent with respect to feelings about discussing one’s own state of health and receptivity to health information. The means across key subgroups (Table 2) provides little insight, other than perhaps that older respondents had a longer response time, on average, than did younger respondents. A deeper analysis is necessary to understanding the meaning of the data, not just the surface morphology of the response patterns.

Table 2. Mean ratings on the 5-point rating scale, by total panel, gender, and ages


5- Point RATING

Binary TOP2 (Works YES)

Binary BOT2 (Works No)

Response Time

Total

3.2

42

31

5.0

Male

3.1

42

32

4.7

Female

3.2

42

31

5.4

Age 18–30

3.2

38

30

4.3

Age 31–49

3.4

53

27

4.5

Age 50–64

2.9

34

37

6.1

Transforming the data in preparation for regression modeling

In consumer research an oft-heard complaint from managers who use the data is ‘what does the rating point mean?’ In consumer research, the values of the scales are not necessarily easy to understand. That is, for researchers and respondents it seems easy to use the 5-point or 9-point or even a 100-point like rt scale. It may take a bit of use for a respondent, but sooner or later, usually sooner, the respondent falls into a pattern and intuitively senses that ‘this vignette is a 3 or a 4.’

One strategy commonly used, and adopted here, divides the scale into two regions, typically the high region (scale points 4–5) to denote a positive feeling about the vignette, and the remaining low region (scale points 1–3) to denote a negative feeling. We are interested in both sides of the scale, however, specifically what ‘works’ and what ‘don’t work’. Thus, we divide the scale twice, first into the top part and then second into the bottom part:

Works YES – Ratings 1–3 transformed to 0, ratings 4–5 transformed to 100

Works NO – Ratings 1–2 transformed to 100, ratings 3–5 transformed to 0.

The transformation removes some of the granular information but makes the results easy to understand. Managers who work with the data understand in an intuitive sense, because the information is presented in a all-or-none fashion.

Regression Modeling

The experimental design makes it straightforward to apply OLS (ordinary least-squares) regression to the raw data, after transformation. The data matrix comprises 16 independent variables, the elements, coded as 1 when present in the vignette, and coded as 0 when absent from the vignette. The matrix comprises three dependent variables, the binary transformation for Works YES (4–5 coded as 100, 1–3 coded as 0), the binary transformation for Works NO (1–2 coded as 100, 3–5 coded as 0), and the response time in seconds with the resolution to the nearest tenth of second. The response time is defined as the recorded time between the appearance of the vignette on the respondent’s screen and the time to assign a rating, which the respondent did by pressing a key.

Results –Total Panel

OLS regression generates an equation relating the presence/absence of the 16 answers or elements to the response. Table 2 shows the parameters of the three equations, one each for the positive Works YES, the negative Works NO, and the response time.

The additive constant (Works YES, Works NO) shows the estimated percent of the time the answer would be ‘Works YES or Works NO, in the absence of any elements. The additive constant represents a baseline, but not an actual situation because all vignettes by design comprised 2–4 elements or answers.’

The coefficient for each element shows the additive percent of the responses that would be expected to shift from ‘not Works YES’ to ‘Works Yes’ (or from ‘not Works NO’ to ‘Works NO), when the element is incorporated into a vignette. Statistical analyses as well as previous research by author Moskowitz suggest a standard error of approximately 4 for the coefficient, making values of 6–7 begin to reach statistical significance.

The results lead to some immediate and easy interpretation because the test elements are cognitively rich. We don’t have to stand back and search for a pattern in the way we do when we are looking at the pattern described by set of otherwise mute measures. Rather, we can understand the nature of a pattern simply by looking at the elements which score well, with high coefficients for the two binary scales (Works YES, Works NO) and long response times.

What ‘works’ for the respondent (Adherence promotion): The additive constant is 43, meaning that in the absence of anything else, we expect about 43% of the responses to be 4–5 for ‘Works YES.’ This means that if we were to ask a person whether giving and receiving medical information from various sources in general ‘works for that person’ almost 50% of the time we would get a positive answer. The strongest performers comprise a mix of statements about getting information directly from the doctor (Doctor talks to me, face to face… not just those phone calls with clinical message) as well as emotional messages (I’m nervous about health – but really want to be healthy to see my kids, grandkids, or even relatives and friends in the years to come and My family means the world to me.)

What doesn’t ‘work’ for the respondent (Adherence prevention): The additive constant is 30; meaning about 30% of the time we will get responses that say ‘doesn’t work for me’ the key message which resonates in a negative way is ‘I don’t feel like going to the doctor… even for the most severe symptoms… I can take care of it. This is not an easy negative to resolve.

Response time: The model for response time does not have an additive constant. The rationale is that without any elements, there is no response at all.

Studies on health drive respondents to pay a great deal of attention to the vignettes. Table 2 shows that the average for the total panel is approximately 5 seconds for a vignette. The response time, when deconstructed into the contributions of the different messages, show that there is a range of response times, all of which are high compared to the response times from previous studies. In this study the estimated response times for the individual answers or elements vary from a high of 1.8 seconds to a low of 1.1 seconds. We end up with these long response times when we deal with topics relevant to the respondent, issues which engage and make the respondent think. In contrast, when we deal with less relevant topics, e.g., studies about products such as foods, we see far shorter response times. It might be that the messages are easier with foods, being tag lines and short descriptions. Whatever the reason for the difference, the response times are far longer here.

The longer response times are those which ‘engage.’ They may be positive or negative, but they ‘engage’ the respondent, holding the attention. The most engaging elements are these below, describing who the person is, and perhaps forcing the respondent to compare him or herself. One can sense that each of these statements is a ‘conversation opener.’

When it comes to illness, I’m on Google, so I really become an expert I’m pretty private about my health… no one’s business

I really am happy when someone takes control, and tells me what to take, and schedules my meds for me

My family and others butt-in to my health… I want my privacy

I’m nervous about health – but really want to be healthy to see my kids, grandkids, or even relatives and friends in the years to come

I don’t feel like going to the doctor… even for the most severe symptoms… I can take care of it

In contrast, the least engaging elements are those of practice, with a sense that there is no conversation to be started

Doctor explains to me WHY this medicine, and what should I DO

I reach out to talk to friends about my health and illness

Table 3. Coefficients relating the presence/absence of the 16 answers (elements) to the binary transformed ratings, and to response time. The table is sorted by Works YES

Works YES

Works NO

Resp Time

Additive constant

43

30

A1

Doctor talks to me, face to face… not just those phone calls with clinical message

7

-8

1.3

B4

I’m nervous about health – but really want to be healthy to see my kids, grandkids, or even relatives and friends in the years to come

6

-1

1.6

D1

My family means the world to me

6

-6

1.3

A2

Doctor explains to me WHY this medicine, and what should I DO

5

-5

1.2

D4

My friends really are there to listen to me about my medical experience – sometimes I feel I’m wearing out my welcome

1

2

1.5

C4

I’m pretty private… my health meds are my business… and maybe the doctor’s, but that’s all

1

0

1.4

A4

Doctor guides me to the Internet sites… so I CAN TAKE CONTROL

0

-3

1.4

B3

When it comes to illness, I’m on Google, so I really become an expert

-1

3

1.8

C1

My family is always there to listen, and support me… I like that

-1

0

1.5

B1

I’m pretty private about my health… no one’s business

-2

5

1.7

A3

My friends explain this stuff to me… I’m more comfortable with them

-2

0

1.3

D3

I reserve my friends for non-medical talks, like politics, or people

-3

1

1.4

D2

I reach out to talk to friends about my health and illness

-3

-2

1.1

C3

I really am happy when someone takes control, and tells me what to take, and schedules my meds for me

-5

6

1.7

C2

My family and others butt-in to my health… I want my privacy

-6

4

1.7

B2

I don’t feel like going to the doctor… even for the most severe symptoms… I can take care of it

-7

11

1.6

Scenario Analysis: Uncovering Pair-Wise Interactions among Answers/Elements: The messages that we encounter in the environment comprise combinations of ideas, rather than single ideas in ‘splendid isolation.’ We know that in the world of food, the taste of a food is determine by the interplay of ingredients, and that experimental design of ingredients can help us understand the nature of that interplay, also called ‘pairwise interaction’. In consumer research with ideas, we may test single messages (promise testing), or test combinations of messages in a final format (concept testing), but rarely do we search for significant pairwise interactions in the world of ideas. There are so-called ‘creative’ in the advertising agency who may be aware that some ideas ‘synergize’ when in pairs, but this knowledge is specific, experienced-based, and hard to create in a systematic fashion on a go-forward basis.

A key benefit of the Mind Genomics approach is the ability to cover many combinations of ideas in the vignettes, all combinations prescribed by a basic experimental design which is permuted (Gofman & Moskowitz, 2010.) Adhering to the experimental design forces the research to work with a wide number of different combinations. In fact, among the 2400 vignettes created for this study, most are unique. Within the 2400 combinations, specific pairs of messages appear several times. It is this property that the various pairs of messages appear several times across the permutations which makes it possible to hold one the options of one question constant a specific option (e.g., one of the options for Question A: How would you like your doctor to discuss your health with you?), and then assess how the vignettes perform when that specific option is held constant.

Table 4 presents the scenario analysis for the positive responses (Works YES), and Table 5 presents the scenario analysis for the negative response (Works NO). The analysis works in a straightforward manner, following these steps:

Table 4. Scenario analysis, revealing pairwise Interactions to drive perceived positive responses, ‘Works YES’

Element held constant in the vignette

A0

A1

 A2

A3

A4

Top 2 – Works YES (Positive Outcome)


No element from question A

Doctor talks to me, face to face… not just those phone calls with clinical message

Doctor explains to me WHY this medicine, and what should I DO

My friends explain this stuff to me… I’m more comfortable with them

Doctor guides me to the Internet sites… so I CAN TAKE CONTROL

A0

A1

A2

A3

A4

Additive Constant

28

53

50

50

34

B4

I’m nervous about health – but really want to be healthy to see my kids, grandkids, or even relatives and friends in the years to come

15

10

1

-5

17

D1

My family means the world to me

14

-8

3

16

11

C4

I’m pretty private… my health meds are my business… and maybe the doctor’s, but that’s all

11

-5

1

-9

11

B1

I’m pretty private about my health… no one’s business

7

7

-4

-17

-2

D2

I reach out to talk to friends about my health and illness

6

-9

-4

-7

3

B3

When it comes to illness, I’m on Google, so I really become an expert

5

12

0

-8

-6

C2

My family and others butt-in to my health… I want my privacy

2

-15

-10

-1

-5

B2

I don’t feel like going to the doctor… even for the most severe symptoms… I can take care of it

1

1

-5

-24

-6

C1

My family is always there to listen, and support me… I like that

1

-5

1

-1

-3

C3

I really am happy when someone takes control, and tells me what to take, and schedules my meds for me

0

-7

-3

-3

-7

D4

My friends really are there to listen to me about my medical experience – sometimes I feel I’m wearing out my welcome

-2

-2

-1

-2

17

D3

I reserve my friends for non-medical talks, like politics, or people

-6

-8

-3

5

4

Table 5. Scenario analysis, revealing pairwise Interactions to drive perceived negative responses, ‘Works NO’

Bot 2 – Works NO (Negative Outcome)

No element from question A

Doctor talks to me, face to face… not just those phone calls with clinical message

Doctor explains to me WHY this medicine, and what should I DO

My friends explain this stuff to me… I’m more comfortable with them

Doctor guides me to the Internet sites… so I CAN TAKE CONTROL

A0

A1

A2

A3

A4

Additive Constant

37

21

23

27

31

C3

I really am happy when someone takes control, and tells me what to take, and schedules my meds for me

9

1

7

8

7

C2

My family and others butt-in to my health… I want my privacy

6

4

4

5

5

C1

My family is always there to listen, and support me… I like that

5

3

0

-2

-1

B2

I don’t feel like going to the doctor… even for the most severe symptoms… I can take care of it

4

7

7

16

13

D3

I reserve my friends for non-medical talks, like politics, or people

2

2

6

-4

-6

D4

My friends really are there to listen to me about my medical experience – sometimes I feel I’m wearing out my welcome

2

8

2

-2

-4

C4

I’m pretty private… my health meds are my business… and maybe the doctor’s, but that’s all

0

0

1

7

-8

B1

I’m pretty private about my health… no one’s business

-5

0

7

12

9

D1

My family means the world to me

-6

2

-2

-17

-9

D2

I reach out to talk to friends about my health and illness

-8

8

0

-3

-8

B3

When it comes to illness, I’m on Google, so I really become an expert

-9

-3

4

9

8

B4

I’m nervous about health – but really want to be healthy to see my kids, grandkids, or even relatives and friends in the years to come

-11

-6

-2

8

-6

  1. Identify the variable to be held constant. In our study, this is Question A: How would you like your doctor to discuss your health with you?
  2. In our 4×4 design (four questions, four answers per question), Question A has five alternatives, comprising the four answers and the ‘no answer’ option wherein Question A does not contribute to a vignette.
  3. We sort the full set of 2400 records, one record per vignette per respondent, based upon the specific answer. This step ‘stratifies’ the database, into five strata, one stratum for each answer. One stratum comprises those vignettes without an answer to Question A.
  4. We then run the OLS regression on each stratum, but do not use A1-A4 as independent variables since they are held constant in a stratum.
  5. The coefficients tell us the contribution of each element to WORKS YES, for a specific answer.
  6. Thus, when we have A0, we deal with no answer from Question A.
  7. The additive constant is 28, meaning that for these vignettes we are likely to get only 28% positive response (works for ME, rating 4–5).The additive constant, 28, is probably the lowest level we will reach in basic response.
  8. Three very strong performing answers emerge. These are likely to lead to strong positive feelings, even starting from the low baseline of 28

    I’m nervous about health – but really want to be healthy to see my kids, grandkids, or even relatives and friends in the years to come

    My family means the world to me

    I’m pretty private… my health meds are my business… and maybe the doctor’s, but that’s all

  9. Now let us move to the strongest performing answer, A1: Doctor talks to me, face to face… not just those phone calls with clinical message. When this answer is the keystone of the vignette, the additive constant jumps up to 53. That means that in the absence of anything else, just knowing that message increases the frequency of positive answers 4–5 on the 5-point scale, namely Works YES
  10. When we combine this strong basic idea presented in A1 with the two answers or elements below, we end up with an additional 10% to 12% positive responses.

    When it comes to illness, I’m on Google, so I really become an expert

    I’m nervous about health – but really want to be healthy to see my kids, grandkids, or even relatives and friends in the years to come

  11. When we run the scenario analysis looking at the Works NO (a negative outcome), we see that without any element from question A, the additive constant is highest (37), and then decreases as the doctor becomes increasing involved. When the doctor talks with the respondent, the additive constant is lowest (A1 = face to face = additive constant 21; A2 = doctor explains = additive constant 23.)

    The most negative elements come from interactions where either the friends explain the medical material, or the doctor guides the respondent to the internet, allowing the respondent to take control.

  12. Response time. We can perform the same scenario analysis. This time, however, we eliminate the condition where an answer to A does not appear (A0). Table 6 shows the dramatic effects of interaction. The response time changes depending upon the specific element from question A about how the respondent wants to get information. A dramatic example comes from answer A1 (doctor talks to me face to face…). When A1 is paired with B1 (I’m pretty private about my health … no one’s business) the response time for element B1 is 3.0 seconds. When A4 (Doctor guides me to the internet sites…) is paired with B1, the response time for element B1 is just about half, 1.4 seconds.

Table 6. Scenario analysis, revealing pairwise Interactions to drive response time


Doctor talks to me, face to face… not just those phone calls with clinical message

Doctor explains to me WHY this medicine, and what should I DO

My friends explain this stuff to me… I’m more comfortable with them

Doctor guides me to the Internet sites… so I CAN TAKE CONTROL

A1

A2

A3

A4

B1

I’m pretty private about my health… no one’s business

3.0

2.1

2.2

1.4

B3

When it comes to illness, I’m on Google, so I really become an expert

2.6

2.3

2.2

1.8

C1

My family is always there to listen, and support me… I like that

2.5

1.4

1.6

2.3

B4

I’m nervous about health – but really want to be healthy to see my kids, grandkids, or even relatives and friends in the years to come

2.3

2.0

2.3

1.3

D4

My friends really are there to listen to me about my medical experience – sometimes I feel I’m wearing out my welcome

1.2

2.4

2.0

2.5

B2

I don’t feel like going to the doctor… even for the most severe symptoms… I can take care of it

2.2

1.8

2.5

1.4

C3

I really am happy when someone takes control, and tells me what to take, and schedules my meds for me

2.0

1.6

2.0

2.6

C2

My family and others butt-into my health… I want my privacy

1.5

1.8

1.7

2.4

D3

I reserve my friends for non-medical talks, like politics, or people

1.7

2.0

2.0

2.2

C4

I’m pretty private… my health meds are my business… and maybe the doctor’s, but that’s all

1.8

1.5

1.8

2.0

D1

My family means the world to me

1.7

1.9

1.6

2.0

D2

I reach out to talk to friends about my health and illness

1.2

2.0

1.7

1.8

It is clear from Table 6 that there is cognitive processing occurring, with the data suggesting that mutually contradictory elements, in terms of implications, the respond processes the information, attempting to resolve these contradictory elements.

Responses from Key Subgroups

Positive Outcome (Works YES): Table 7 presents the performance of the elements by key subgroups, comprising gender, age, and stated concern about their health. In the interest of easing the inspection, we present only those elements which score well with at least one of the key subgroups.

Table 7. Performance of the answers/elements by key subgroup for the criterion ofWorks YES. Only strong performing elements for at least one subgroup are shown

Top 2 – Works YES

Male

Female

Age 18–30

Age 31–49

FW 50+

Don’t think

Healthy

Concerned

Additive Constant

45

42

29

58

33

26

48

43

A1

Doctor talks to me, face to face… not just those phone calls with clinical message

5

10

7

4

12

17

-3

16

A2

Doctor explains to me WHY this medicine, and what should I DO

9

1

2

7

4

6

2

7

A3

My friends explain this stuff to me… I’m more comfortable with them

0

-3

1

3

-6

17

-6

0

A4

Doctor guides me to the Internet sites… so I CAN TAKE CONTROL

2

-2

3

4

-2

22

-4

2

B3

When it comes to illness, I’m on Google, so I really become an expert

-4

3

2

-2

-1

9

-1

-2

B4

I’m nervous about health – but really want to be healthy to see my kids, grandkids, or even relatives and friends in the years to come

3

8

10

1

8

-1

1

11

D1

My family means the world to me

4

8

3

-1

16

1

4

8

D4

My friends really are there to listen to me about my medical experience – sometimes I feel I’m wearing out my welcome

4

-2

13

-4

-2

5

0

1

The key differences emerge from the additive constants and a few elements, only. Most respondents are positive. The least positives are two groups; those age 18–30 (additive constant = 29) and those age 50+ (additive constant 33) and those not concerned with their health (additive constant = 26). The only groups which surprises are those age 50+.

Looking across subgroups, we find two messages which appear to do well on a consistent basis

Doctor talks to me, face to face… not just those phone calls with clinical message

But really want to be healthy to see my kids, grandkids, or even relatives and friends in the years to come

Looking down, within a subgroup, we find some patterns which strongly resonate, and are meaningful when we think about the needs and wants of the subgroup.

Those age 50+

I’m nervous about health – but really want to be healthy to see my kids, grandkids, or even relatives and friends in the years to come

My family means the world to me

Those who classify themselves as not concerned

Doctor talks to me, face to face… not just those phone calls with clinical message

My friends explain this stuff to me… I’m more comfortable with them

Doctor guides me to the Internet sites… so I CAN TAKE CONTROL

When it comes to illness, I’m on Google, so I really become an expert

When we perform the same analysis, this time for the lower part of the scale (Works NO), where ratings 1–2 were assigned 100, and ratings 3–5 were assigned 0, we find a different pattern. We again present only those elements which score strongly among at least one of the subgroups.

When we look at the key subgroups, we find that most of the groups begin with a low additive constant, which means that they feel these messages will not do any harm. The two groups which surprise are those who are age 50+ (additive constant = 44) and those who say that they are concerned about their health (additive constant = 48.)The likelihood is probably their fear that the ‘wrong’ thing could exacerbate a problem. In contrast those who are age 31–49 show a very low additive constant (12), as do those who classify themselves as health (additive constant = 18).

The additive constant provides only part of the story. Some of the elements drive a perception of poor outcomes, especially those who call themselves healthy. A pleasant surprise is that the elements which these self-described healthy respondents feel to lead to a bad outcome are those which talk about avoiding the medical establishment. That is, those who consider themselves health are already aware of good practices, and react negatively to poor practices, as shown by the high coefficients for this reversed scale.

I don’t feel like going to the doctor… even for the most severe symptoms… I can take care of it

I’m pretty private about my health… no one’s business

My friends explain this stuff to me… I’m more comfortable with them

Emergent Mind Sets Showing Different Patterns of What is Important

One of the ingoing premises of Mind Genomics is that within any topic area where people make decisions or have points of view there exist mind-sets, groups of ideas which ‘go together.’ Mind Genomics posits that at any specific time, a given individual will have only one of the several possible mind-sets, although over time, e.g., years or due to some unforeseen circumstance, one’s mind-set will change.

The metaphor for a mind-set it a mental genome. There is no limit to the number of such mental genomes, at least in terms of defining them by experiments. Virtually every topic can be broken down into smaller and smaller topics, and studied, from the very general to the most granular. In that respect, Mind Genomics differs from its namesake, Biological Genomics, which posits that there are a limited number of possible genes. In Mind Genomics, each topic area comprises a limited number of mind genomes, but there are uncountable topics.

The notion of mind-sets in the population, these so-called mind genomes, opens a variety of vistas. From the vantage point of psychology, the mind-genomes present the opportunity to study individual differences in the world of the everyday, and to systematize these differences, perhaps even finding ‘supersets’ of mind genomes which go across many different types of behavior. From the vantage point of biology, discovering mind-genomes holds the possibility of ‘correlating’ mind-genomes with actual genomes. And finally, from the vantage point of economics and commerce, discovering the pattern of a person’s mind genomes leads to better customer experience, and perhaps more responsiveness to suggestions about lifestyle modifications in the search for better health. The last is the focus of this study, the search for how to best communicate to people.

The process of uncovering mind genomes or mind-sets is empirical, modeling the relation between elements and responses (our Works YES model), clustering the respondents on the basis of the pattern of their coefficients, and finally extracting clusters which are few in number (parsimony), and which are coherent and meaningful, telling a ‘simple story’ (interpretability).Clustering has become a standard method in exploratory data analysis (e.g., Dubes & Jain, 1980.)

The approach to creating these mind-sets has already been documented extensively in [25–30]. It is vital to keep in mind that modeling and clustering is virtually automatic and intellectual agnostic. It takes a researcher to determine whether the clusters, the so-called mind-sets, really make sense when interpreted. There is no way for the clustering algorithm to easily interpret the meaning of the clusters other than perhaps doing a word count. The involvement of the research is vital, albeit not particularly taxing. The computer program does all the work.

The clustering based on the positive outcome models (Works YES) suggest three interpretable mind-sets, shown in Table 9 fop the positive outcome, Works YES, and in Table 10 for the negative outcome, Works NO. The names for the mind-sets were selected on the basis the elements which scored highest for the Works YES models. The mind-sets make sense (privacy seeker; doctor focus; control focus) for both the positive and the negative models (Works YES, Works NO), respectively. The clustering also parallels preliminary results from the aforementioned study run eight years before, in 2011(Moskowitz, unpublished), which suggested three similar three mind-sets of this type. It is important to note that these mind-sets are not ‘set in stone,’ but rather represent interpretable areas in what is more likely a continuum of preferences.

Table 9. Performance of the answers/elements by three emergent mind-sets for the criterion of Works YES

 Positive Outcome – Works YES
(Basis for the mind-set segmentation)

MS3 Privacy-seeker

MS2 Doctor focus

MS1 Control focus

Additive constant

45

50

34

C4

I’m pretty private… my health meds are my business… and maybe the doctor’s, but that’s all

15

-1

-13

A1

Doctor talks to me, face to face… not just those phone calls with clinical message

-7

15

16

A2

Doctor explains to me WHY this medicine, and what should I DO

-11

11

16

A4

Doctor guides me to the Internet sites… so I CAN TAKE CONTROL

-15

11

8

D1

My family means the world to me

-5

10

15

B4

I’m nervous about health – but really want to be healthy to see my kids, grandkids, or even relatives and friends in the years to come

3

2

14

D4

My friends really are there to listen to me about my medical experience – sometimes I feel I’m wearing out my welcome

-9

5

9

D2

I reach out to talk to friends about my health and illness

-11

-3

8

B3

When it comes to illness, I’m on Google, so I really become an expert

5

-16

8

A3

My friends explain this stuff to me… I’m more comfortable with them

-16

6

7

B1

I’m pretty private about my health… no one’s business

5

-19

5

D3

I reserve my friends for non-medical talks, like politics, or people

-2

-8

3

B2

I don’t feel like going to the doctor… even for the most severe symptoms… I can take care of it

5

-23

-6

C3

I really am happy when someone takes control, and tells me what to take, and schedules my meds for me

0

-3

-12

C1

My family is always there to listen, and support me… I like that

4

7

-14

C2

My family and others butt-in to my health… I want my privacy

2

-2

-18

Table 10. Performance of the answers/elements by three emergent mind-sets for the criterion of Works NO

Negative Outcome – Works NO

MS3 Privacy-focus

MS2 Doctor focus

MS1 Control focus

Additive constant

24

34

31

A3

My friends explain this stuff to me… I’m more comfortable with them

16

-5

-11

D4

My friends really are there to listen to me about my medical experience – sometimes I feel I’m wearing out my welcome

11

-8

-1

A2

Doctor explains to me WHY this medicine, and what should I DO

10

-12

-12

A4

Doctor guides me to the Internet sites… so I CAN TAKE CONTROL

10

-9

-12

B2

I don’t feel like going to the doctor… even for the most severe symptoms… I can take care of it

8

12

13

C3

I really am happy when someone takes control, and tells me what to take, and schedules my meds for me

5

9

6

B1

I’m pretty private about my health… no one’s business

4

9

4

C4

I’m pretty private… my health meds are my business… and maybe the doctor’s, but that’s all

-9

1

9

C1

My family is always there to listen, and support me… I like that

0

-8

8

A1

Doctor talks to me, face to face… not just those phone calls with clinical message

2

-14

-12

B3

When it comes to illness, I’m on Google, so I really become an expert

5

7

-2

B4

I’m nervous about health – but really want to be healthy to see my kids, grandkids, or even relatives and friends in the years to come

-2

-1

-1

C2

My family and others butt-in to my health… I want my privacy

2

6

7

D1

My family means the world to me

-4

-8

-7

D2

I reach out to talk to friends about my health and illness

2

-2

-6

D3

I reserve my friends for non-medical talks, like politics, or people

-3

3

1

Response Time (engagement) – Key Subgroups: Table 11 shows us the differences in response time across the 16 elements. The data are repeated for the total panel, along with the estimated response times for each element by each key subgroup. The patterns differ by subgroup. Some of the key results are:

  1. Males focus for longer times about being an expert and wanting privacy.

    When it comes to illness, I’m on Google, so I really become an expert

    I’m pretty private about my health… no one’s business

  2. Females focus slight longer about most of the elements than do males. Two elements capture their attention, but do not capture the attention of males

    Doctor talks to me, face to face… not just those phone calls with clinical message

    My friends explain this stuff to me… I’m more comfortable with them

  3. The youngest respondents (age 18–30) focus on only one element

    My friends really are there to listen to me about my medical experience – sometimes I feel I’m wearing out my welcome

  4. The oldest respondents focus a lot more time than other respondents on the need for expertise and privacy

    When it comes to illness, I’m on Google, so I really become an expert

    I’m pretty private about my health… no one’s business

    My family and others butt-in to my health… I want my privacy

  5. Those who say they are not concerned focus a great deal on one element

    I don’t feel like going to the doctor… even for the most severe symptoms… I can take care of it

  6. Those who say they are healthy focus on

    When it comes to illness, I’m on Google, so I really become an expert

    I’m pretty private about my health… no one’s business

  7. Those say they are concerned about their health focus a great deal on two issues, opposites of each other

    My family and others butt-in to my health… I want my privacy

    I really am happy when someone takes control, and tells me what to take, and schedules my meds for me

  8. The privacy mind-set focuses on privacy, but also on the lack of privacy (someone else taking control). Keep in mind that this is response time, not a judgment. The respondents in this mind-set pay attention to the statement about someone else taking control, rather than just disregarding it.

    When it comes to illness, I’m on Google, so I really become an expert

    My family and others butt-in to my health… I want my privacy

    I’m pretty private about my health… no one’s business

    I really am happy when someone takes control, and tells me what to take, and schedules my meds for me

  9. The doctor mind-set actually spends more time on elements which do not agree with their mind-set and spend little time on elements dealing with the doctor. It is as if they are ‘wired’ to accept the information of the doctor but have to think about contravening data.

    My friends explain this stuff to me… I’m more comfortable with them

    When it comes to illness, I’m on Google, so I really become an expert

    My family and others butt-in to my health… I want my privacy

  10. The control mind-set focus on loss of control, again spending little time on elements which agree with their mind-setI really am happy when someone takes control, and tells me what to take, and schedules my meds for me

Table 8. Performance of the answers/elements by key subgroup for the criterion of Works NO. Only strong performing elements for at least one subgroup are shown


Bot 2 – Works NO

Male

Female

Age 18–30

Age 31–49

Age 50+

Don’t think

Healthy

Concerned

Additive Constant

29

30

34

12

44

32

18

38

A3

My friends explain this stuff to me… I’m more comfortable with them

2

-1

-2

2

0

-9

10

-7

B1

I’m pretty private about my health… no one’s business

4

6

2

10

2

1

12

1

B2

I don’t feel like going to the doctor… even for the most severe symptoms… I can take care of it

13

9

2

15

13

-4

14

10

B3

When it comes to illness, I’m on Google, so I really become an expert

3

4

4

7

-1

-7

8

1

B4

I’m nervous about health – but really want to be healthy to see my kids, grandkids, or even relatives and friends in the years to come

1

-3

-9

6

-4

0

9

-10

C3

I really am happy when someone takes control, and tells me what to take, and schedules my meds for me

4

9

6

6

10

-7

9

5

D1

My family means the world to me

-4

-8

-16

2

-10

10

-8

-5

D2

I reach out to talk to friends about my health and illness

-4

1

-7

1

-1

13

-1

-2

Table 11. Response times for elements, by total panel and key subgroups


total

Male

Female

A18–30

A31–49

50+

Not concerned

Healthy

Concern

Doctor focus

Control focus

B3

When it comes to illness, I’m on Google, so I really become an expert

1.8

1.7

1.9

1.4

1.6

2.1

2.2

1.9

1.6

1.9

1.6

B1

I’m pretty private about my health… no one’s business

1.7

1.7

1.7

1.5

1.3

2.2

1.6

2.0

1.5

1.8

1.5

C2

My family and others butt-in to my health… I want my privacy

1.7

1.4

2.0

1.4

1.7

2.0

1.3

1.4

2.0

1.4

1.8

C3

I really am happy when someone takes control, and tells me what to take, and schedules my meds for me

1.7

1.5

1.8

1.0

1.8

1.9

1.6

1.2

2.0

1.4

1.9

B2

I don’t feel like going to the doctor… even for the most severe symptoms… I can take care of it

1.6

1.4

1.7

1.2

1.5

1.8

2.6

1.7

1.3

1.9

1.2

B4

I’m nervous about health – but really want to be healthy to see my kids, grandkids, or even relatives and friends in the years to come

1.6

1.6

1.6

1.4

1.6

1.6

1.5

1.5

1.6

1.8

1.4

C1

My family is always there to listen, and support me… I like that

1.5

1.5

1.5

1.1

1.4

1.8

1.8

1.1

1.9

1.3

1.7

D4

My friends really are there to listen to me about my medical experience – sometimes I feel I’m wearing out my welcome

1.5

1.5

1.6

1.9

1.0

1.9

2.0

1.2

1.8

1.8

1.3

A4

Doctor guides me to the Internet sites… so I CAN TAKE CONTROL

1.4

1.2

1.6

1.1

1.3

1.7

-0.3

1.4

1.6

1.5

1.3

C4

I’m pretty private… my health meds are my business… and maybe the doctor’s, but that’s all

1.4

1.3

1.5

1.0

1.3

1.8

1.1

1.0

1.8

1.2

1.3

D3

I reserve my friends for non-medical talks, like politics, or people

1.4

1.4

1.4

1.4

1.1

1.8

1.7

1.4

1.4

1.7

1.1

A1

Doctor talks to me, face to face… not just those phone calls with clinical message

1.3

1.0

1.6

0.9

1.1

1.8

-0.2

1.3

1.5

1.3

1.4

A3

My friends explain this stuff to me… I’m more comfortable with them

1.3

1.0

1.7

1.0

1.4

1.5

0.6

1.2

1.5

2.0

1.0

D1

My family means the world to me

1.3

1.6

0.9

1.5

0.9

1.6

1.9

1.2

1.3

1.6

1.3

A2

Doctor explains to me WHY this medicine, and what should I DO

1.2

1.0

1.4

1.1

1.1

1.6

0.6

1.0

1.5

1.4

1.3

D2

I reach out to talk to friends about my health and illness

1.1

0.9

1.3

1.4

0.7

1.3

0.3

1.1

1.1

1.4

1.0

Identifying Sample Mindsets at the Clinic

The conventional wisdom in consumer research is that we can use a person’s demographics or psychographics to predict the mind-set to which the person belongs. The actual practice is to cluster people based upon their demographics, attitudes and/or behavior, arriving at a set of individuals who LOOK different by standard measures, and then to map these clusters to different ways of thinking about the same problem.

 The conventional approach occasionally works but fails to deal with the granularity of the situations having many aspects. The different aspects of a single topic, such as dealing with medical information, may generate a variety of different groups of mind-sets, depending upon the topic of medical information, whether that be simply informative, or prescriptive, and forth. Conventional research is simply too blunt an instrument to assign people to these different arrays of mind-sets, each of which emerges from different aspects of the same general problem. Once granularity becomes a factor in one’s knowledge, the standard methods no longer work, in light of the vastly increased sophistication of one’s knowledge about a topic.

An example of the difficulty of traditional methods to assign new people to the three mind-sets uncovered here can be sensed from Table 12, which shows the membership pattern in the three mind-sets by gender, by age, and by self-described concern with one’s health. The distributions are similar across the three mind-sets. One either needs much more data, from many other measured aspects of each person, or a different way to establish mind-set membership in this newly uncovered array of three mind-sets emerging from the granular topic of the way one wants to give and get medical information.

Table 12. Distribution of mind-set membership by gender, age, and self-described concern with one’s health

Privacy focus

Doctor focus

Control focus

Total

100

38

29

33


Male

51

18

16

17

Female

49

20

13

16


Age 18–30

21

11

5

5

Age w

39

14

12

13

Age 50+

37

12

11

14

Not answered

3

1

1

1


Healthy

44

20

12

12

Concerned

49

17

13

19

Never think about it

7

1

4

2

Discovering these three mind-sets in the population by a PVI (Personal Viewpoint Identifier)

The ideal situation in research is to discover a grouping of consumers, e.g., our three mind-sets, and then discover some easy-to-measure set of variables which, in concert, assign a person to a mind-set. With such an assignment rule it may be possible to scan a database of millions of people, and assign each person in the database to one of the empirically discovered mind-sets. That process may work, but the occasions are few and far between.

An alternative method uses the coefficients from the three mind-sets to create a typing tool, a set of questions with simple answers, so that the pattern of answers assigns a person to one of the three mind-sets. The method uses the coefficients for Works YES (Table 9), identifies the most discriminating patterns, and then simulates many thousands of data sets, perturbing each data set thousands of times. These data sets are, for each mind-set, the 16 coefficients and the additive constant. The process is a so-called Monte-Carlo simulation.

The actual PVI is available at the link below, as of this writing (summer, 2019).

http://pvi360.com/TypingToolPage.aspx?projectid=78&userid= 2018

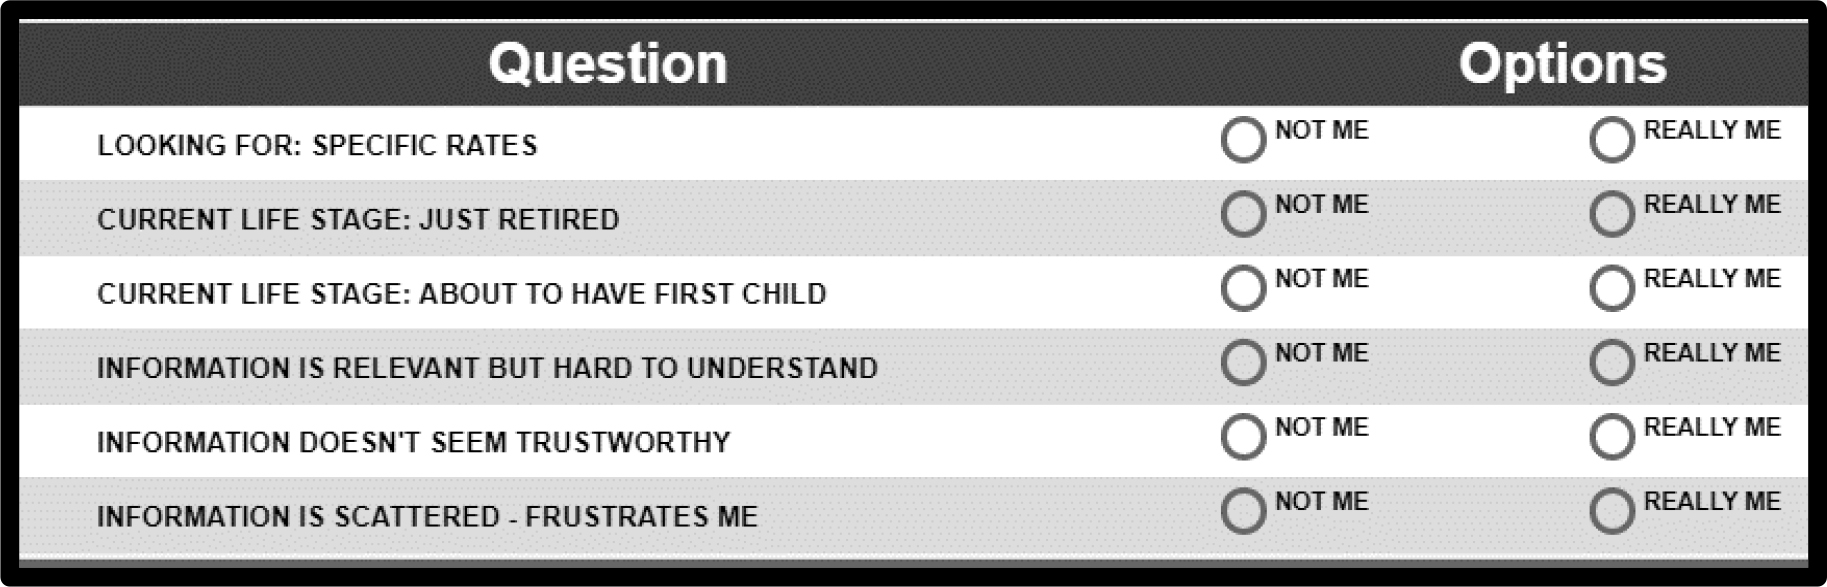
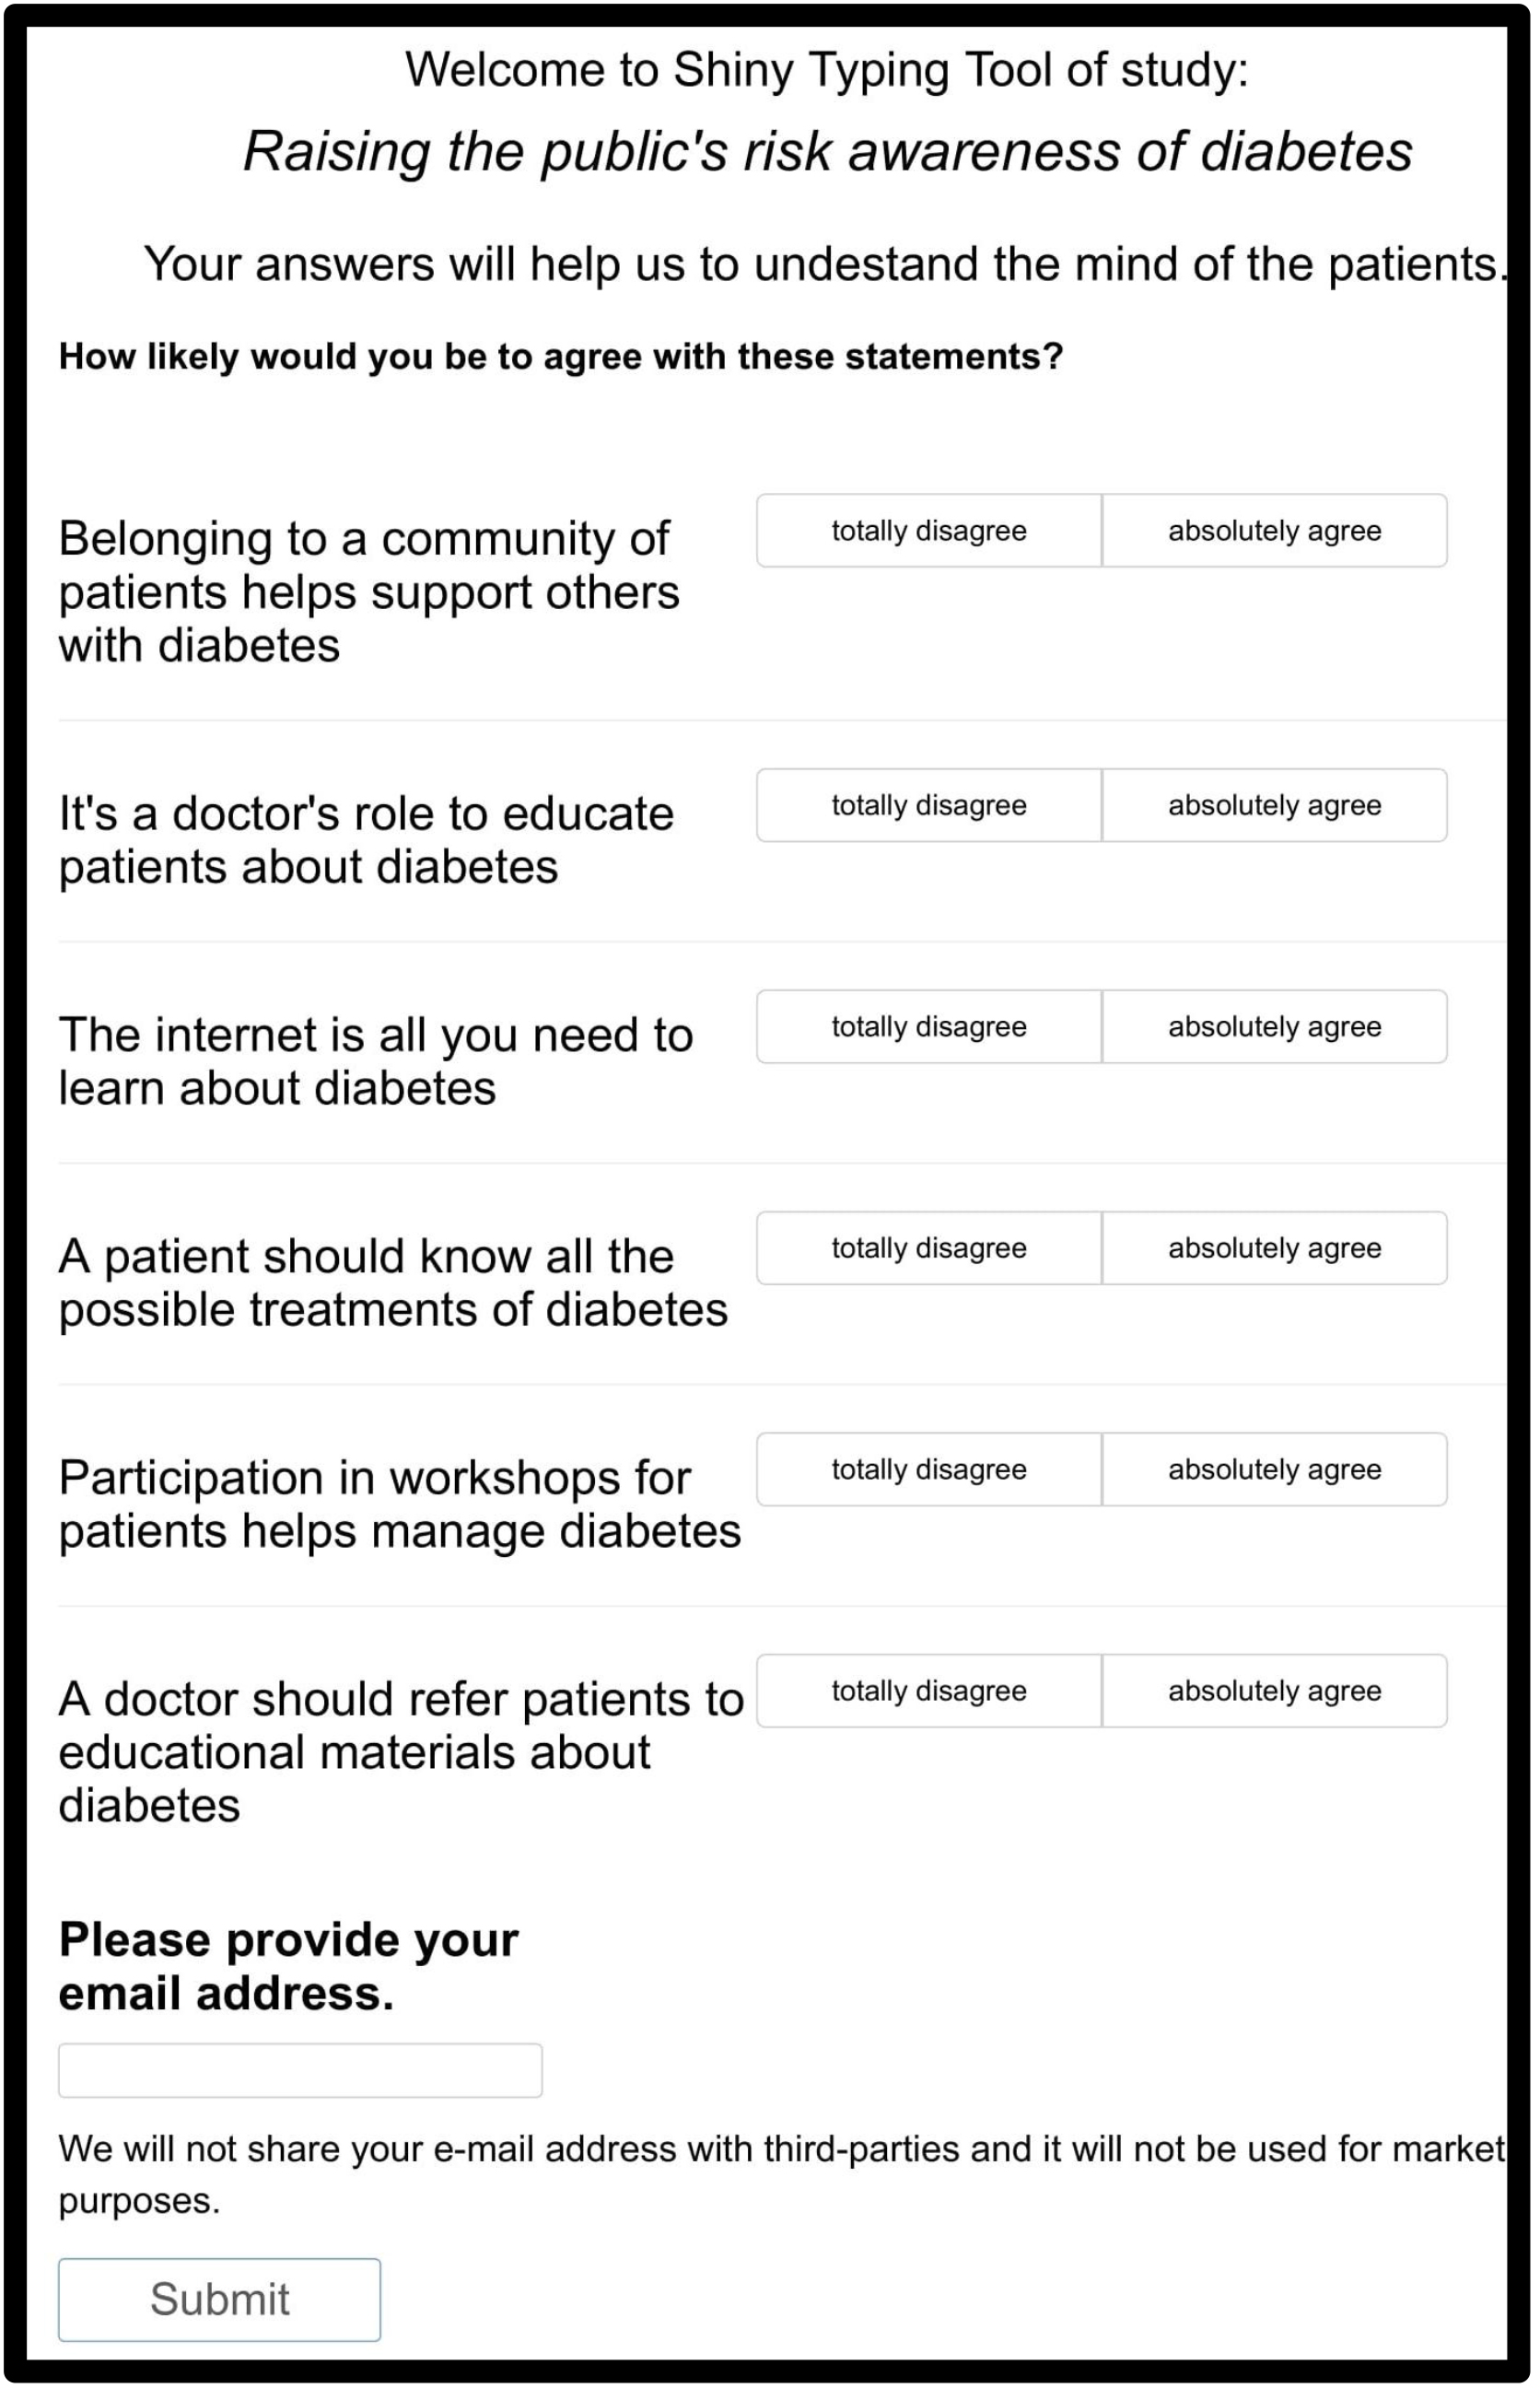
Figure 1 shows the information collected from the respondent (classification), and Figure 2 shows the actual PVI questions. In practice they are randomized. Following the six questions, the patterns of answers to which assign a person to a mind-set, we see four additional questions that the respondent who is doing the typing can answer, to provide additional information.

Mind Genomics-026 - JCRM Journal_F1

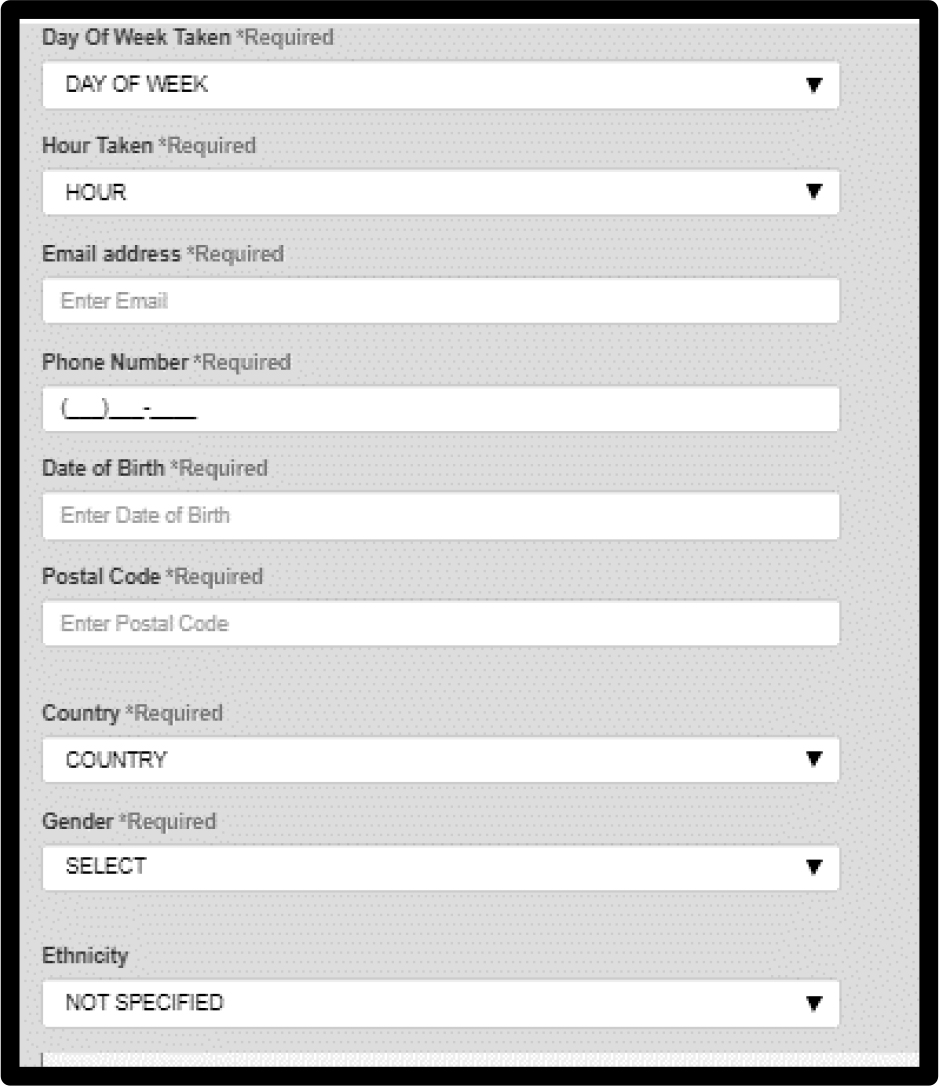
Figure 1. The self-classification, completed at the start of the PVI

Mind Genomics-026 - JCRM Journal_F2
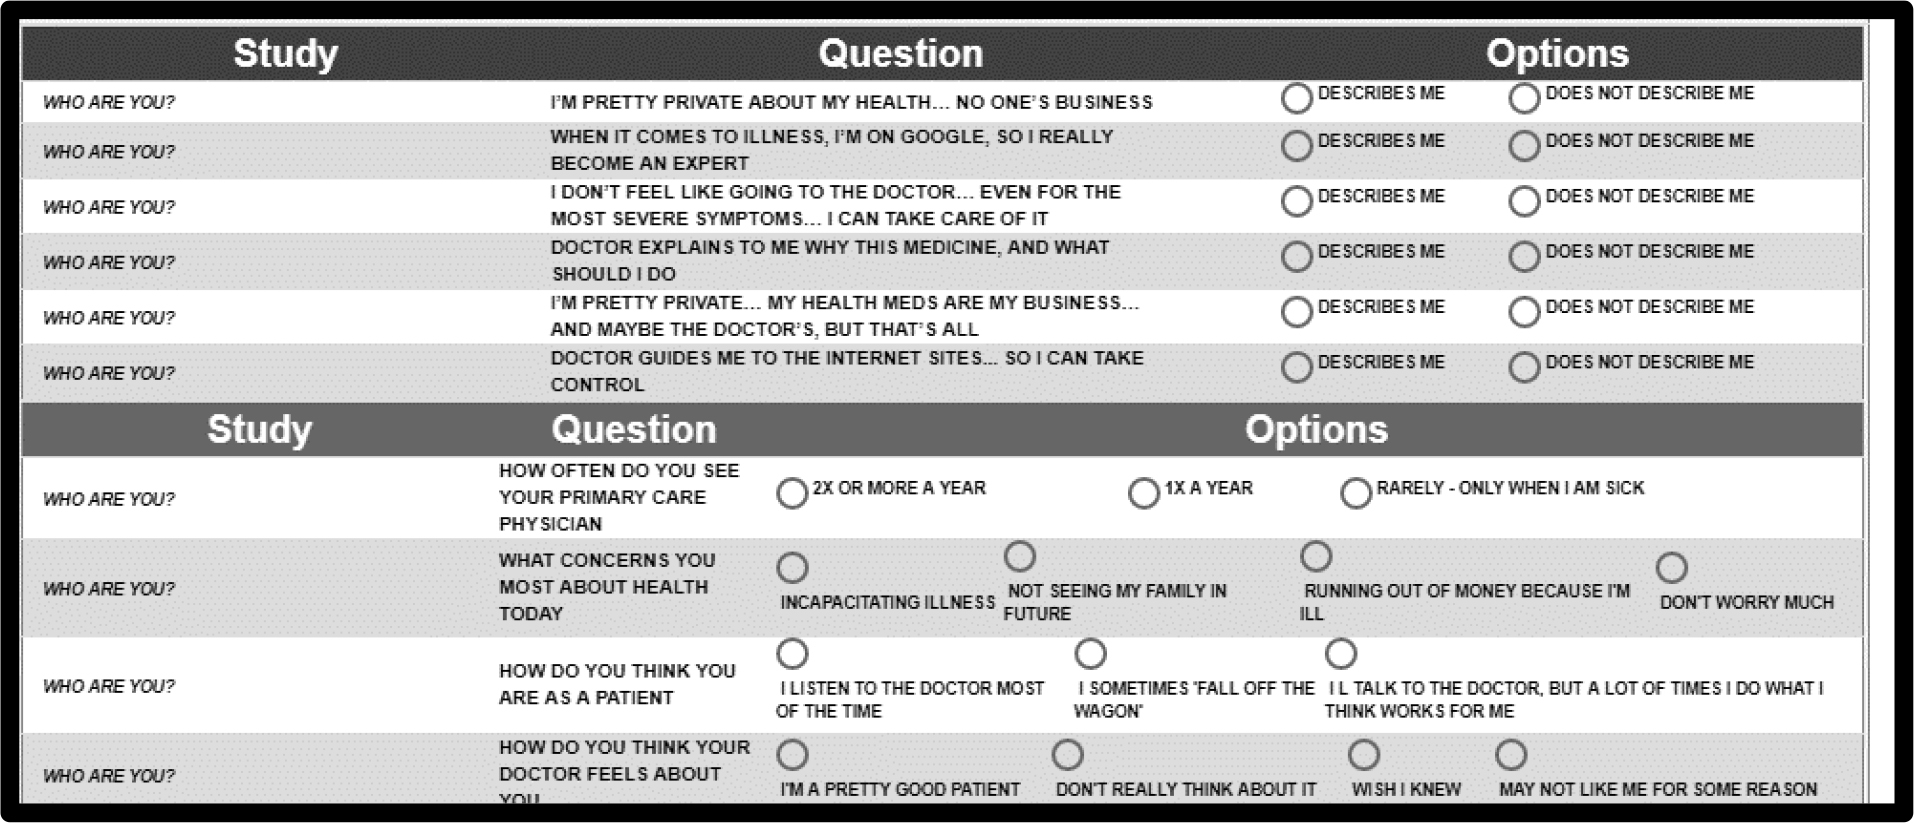
Figure 2. The actual PVI showing the six PVI questions, and the four general questions below

Discussion and conclusions

This study identified mindsets regarding how the person would like to communicate with the physician the underlying goal being to increase adherence through proper communication. Communication messaging typically involves identifying a subgroup by common characteristics of its members and according the information to group members by these characteristics (Kreuter, Strecher& Glassman, 1999). The notion underlying this approach is that group members possess similar characteristics and, therefore, will be influenced by the same message. Similarly, in health communication, messaging may be customized to a subgroup, members of which share characteristics such as illness, health conditions and needs, etc. Individuals, however, are most persuaded by personally relevant communication and are more likely to pay attention and to process such information more thoroughly (Petty &Cacioppo, 2012).

Since fitting a message to meet personal needs of patients, rather than group criteria, is more effective for influencing attitudes and health behaviors, we suggest that to promote adherence, clinicians should tailor their messages to individuals. Sophisticated approaches to tailor communication aimed at changing complex health behaviors such as adherence, call upon clinicians to integrate detailed information into communication messages for each patient (Cantor &Kihlstrom, 2000).An advantage of such strategies for communication is that messages tailored to a patient do not need to be modified very often (Schmid, Rivers, Latimer &Salovey, 2008).

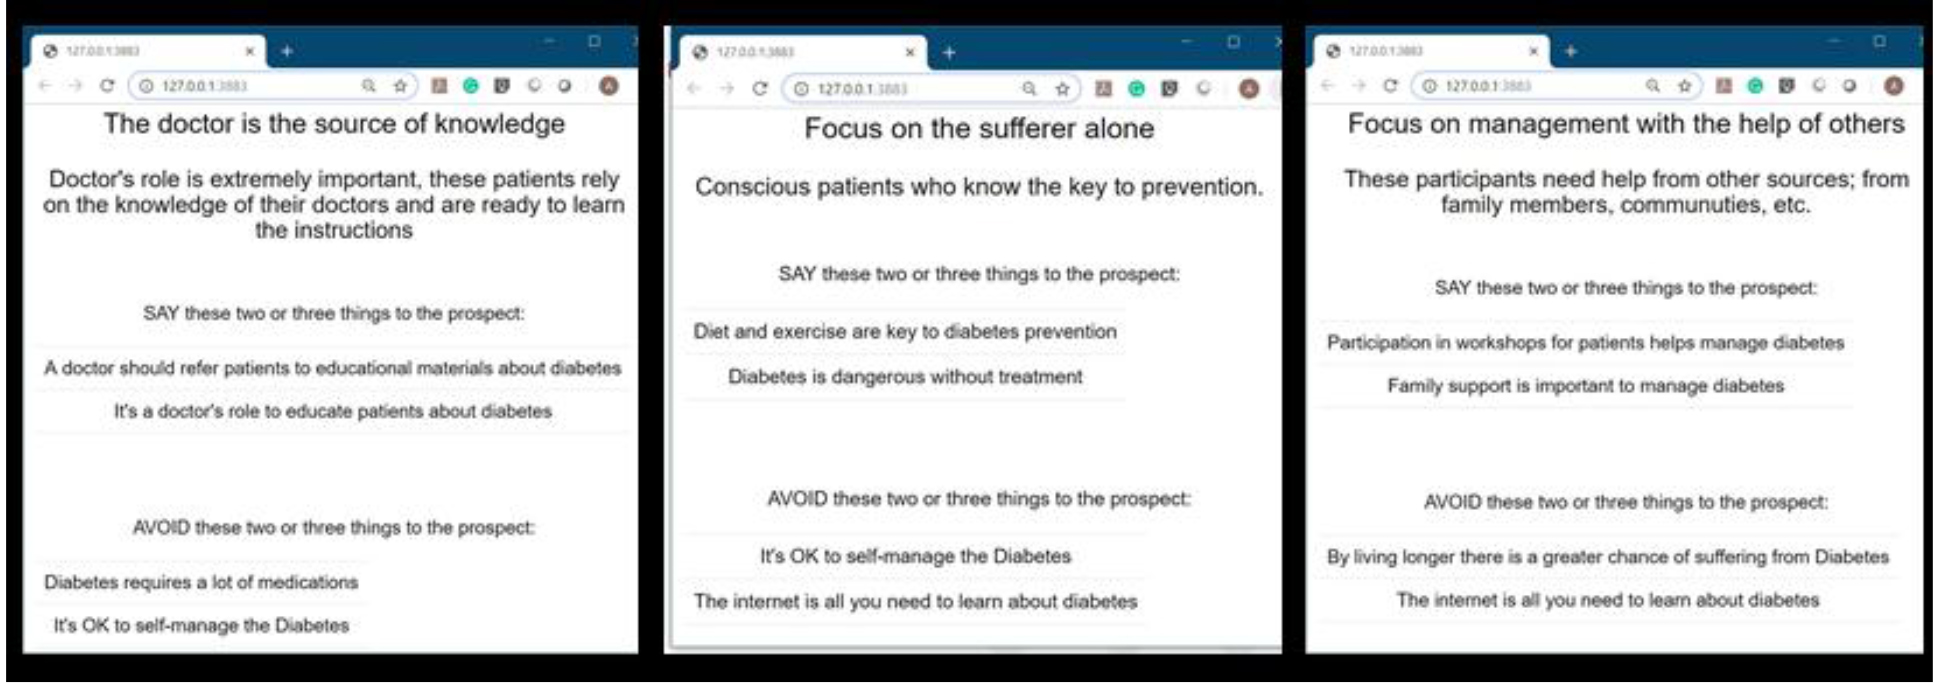
Our viewpoint enables clinicians to identify the sample mindset to which a patient in the population belongs, for a specific topic, i.e., granular. Messages about adherence and non-adherence should be congruent with those specifically strong elements for the mind-set to which the patient belongs for the particular topic. There are some messages which appear to be universal, such as the need of patients to have eye contact with the clinician. At the deeper level, the level of granular message; the data suggests three mind-sets, membership in which should be known to the physician and guide style of communication.

People belonging to the first mindset focus on privacy and expect their clinician to take control (e.g., tell me what to take, schedules my meds for me).

People belonging to the second mindset accept what the clinician advises them but spend time discussing it with other patients and enhancing their knowledge on Google. People in this mindset expect their clinician to carry a dialogue respecting the information they learned and their thoughts.

People belonging to the third mindset, need to have control. Aiming at behavioral changes and adherence promotion, clinicians might adopt communication with a tonality of process oriented, along with personal relevance for the patient.

Tailoring the message to the patient requires the clinician to assess each patient belonging to a mindset by asking the six questions according to our viewpoint identifier.

Acknowledgement

Attila Gere thanks the support of the Premium Postdoctoral Researcher Program of the Hungarian Academy of Sciences

References

  1. DiMatteo MR (2004) Variations in patients’ adherence to medical recommendations: a quantitative review of 50 years of research. MedicalCare 42: 200–209.
  2. Haskard-Zolnierek KB, DiMatteo MR (2009) Physician communication and patient adherence to treatment: a meta-analysis. Medical care 47: 826.
  3. Vermeire E, Hearnshaw H, Van Royen P (2001) Patient adherence to treatment: three decades of research, a comprehensive review. J Clin Pharm Ther26: 331–342.
  4. Zolnierek KB, DiMatteo MR(2009) Physician communication and patient adherence to treatment: a meta-analysis. Medical care 47: 826.]
  5. DiMatteo MR, Haskard KB, Williams SL (2007) Health beliefs, disease severity, and patient adherence: a meta-analysis. Medical Care45: 521–528.
  6. Sabate E (2003) Adherence to long-term therapies: Evidence for action. Geneva: World Health Organization.
  7. Gabay G, Moskowitz HR (2012)the algebra of health concerns: implications of consumer perception of health loss, illness and the breakdown of the health system on anxiety. International Journal of Consumer Studies36: 635–646.
  8. Gabay G (2015) Perceived control over health, communication and patient- physician trust. Patient Education and Counseling98: 1550–1557.
  9. Beck RS, Daughtridge R, Sloane PD (2002) Physician-patient communication in the primary care office: a systematic review. Journal of the American Board of Family Practice15: 25–38.
  10. Gabay G (2016) Exploring perceived control and self-rated health in re-admissions among younger adults: A retrospective Study. Patient Education and Counseling 99: 800–806.
  11. Osterberg L, Blaschke T (2005) Adherence to medication. N Engl J Med 353: 487–497.
  12. Chewning B, Sleath B (1996) Medication decision-making and management: a client-centered model. SocSci Med 42: 389–398.
  13. Squier RW (1990) A model of empathic understanding and adherence to treatment regimens in practitioner-patient relationships. SocSci Med 30: 325–339.
  14. Stewart MA (1984) what is a successful doctor-patient interview? A study of interactions and outcomes. SocSci Med 19: 67–175.
  15. DiMatteo MR, Haskard-Zolnierek KB, Martin LR (2012) Improving patient adherence: a three-factor model to guide practice. Health Psychology Review 1: 74–91.
  16. Haynes RB, Yao X, Degani A, Kripalani S, Garg A, et al.(2005) Interventions to enhance medication adherence. Cochrane Database Systematic Review 4
  17. Haynes R, Ackloo E, Sahota N, McDonald H, Yao X (2008) Interventions for enhancing medication adherence. Cochrane Database of Systematic Review 2: CD000011.
  18. Ratanawongsa N, Karter AJ, Parker MM, Lyles CR, Heisler M, et al. (2013Communication and medication refill adherence: the Diabetes Study of Northern California. JAMA internal medicine11: 173–210.
  19. Rosenthal R, Rosnow R (2007) Essentials of behavioral research: methods and data analysis. McGraw-Hill.
  20. Levinson W, Lesser CS, Epstein RM (2010) Developing physician communication skills for patient-centered care. Health affairs29: 1308–1310.
  21. Epstein RM, Street RL (2007) Patient-centered communication in cancer care: promoting healing and reducing suffering. National Cancer Institute.
  22. Brown RF, Butow PN, Dunn SM, Tattersall MH (2001) Promoting patient participation and shortening cancer consultations: a randomised trial. British Journal of Cancer 85: 1273.
  23. Tulsky JA (2005) Interventions to enhance communication among patients, providers, and families. Journal of palliative medicine 8: 95.
  24. Rao JK, Anderson LA, Inui TS (2007) Communication interventions make a difference in conversations between physicians and patients: a systematic review of the evidence. Med Care45: 340–349.
  25. Gabay G, Zemel G, Gere A, Zemel R, Papajorgji P, et al. (2018) On the threshold: What concerns healthy people about the prospect of cancer.Cancer Studies and Therapeutics Journal 3: 1–10.
  26. Gabay G, Gere A, Stanley J, Habsburg-Lothringen C, Moskowitz HR(2019) Health threats awareness – Responses to warning messages about cancer and smartphone Usage. Cancer Studies Therapy Journal4: 1–10.
  27. Gabay G, Gere A, Zemel G, Moskowitz D, Shifron R, et al. (2019) Expectations and attitudes regarding chronic pain control: An exploration using Mind Genomics. Internal Medicine Research Open Journal4: 1–10.
  28. Gabay G, Gere A, Moskowitz HR (2019) Uncovering communication messages for health promotion: The case of arthritis. Integrated Journal of Orthopedic Traumatology2: 1–13.
  29. Gabay G, Gere A, Moskowitz HR. (2019) Understanding effective web messaging – The Case of Menopause. Integrated Gynecology & Obstetrics Journal 2: 1–16.
  30. Gabay G, Gere A, Stanley J, Habsburg-Lothringen C, Moskowitz HR (2019) Health threats awareness – Responses to warning messages about Cancer and smartphone usage. Cancer Studies Therapeutics Journal4: 1–10.
  31. Gofman A, Moskowitz HR (2010) Isomorphic permuted experimental designs and their application in conjoint analysis. Journal of Sensory Studies 25: 127–45.
  32. Beck RS, Daughtridge R, Sloane PD (2002) Physician-patient communication in the primary care office: a systematic review. Journal of the American Board of Family Practice15: 25–38.
  33. Brown RF, Butow PN, Dunn SM, Tattersall MH (2001) Promoting patient participation and shortening cancer consultations: a randomised trial. British Journal of Cancer 85: 1273.
  34. Campbell, James D, Hans O, Mauksch, Helen J Neikirk, Hosokawa CM (1990) Collaborative practice and provider styles of delivering health care. Social Science & Medicine 30: 1359–1365.
  35. Cantor N, Kihlstrom JF (2000) Social intelligence. Handbook of intelligence 2: 359–379.
  36. Charlton CR, DearingKS, Berry JA, Johnson MJ (2008) Nurse practitioners’ communication styles and their impact on patient outcomes: an integrated literature review. Journal of the American Academy of Nurse Practitioners 20: 382–388.
  37. Chewning B, Sleath B (1996) Medication decision-making and management: a client-centered model. SocSci Med42: 389–398.
  38. Coeling, Van EH, Cukr PR (2000) Communication styles that promote perceptions of collaboration, quality, and nurse satisfaction. Journal of Nursing Care Quality14: 63–74.
  39. DiMatteo MR (2004) Variations in patients’ adherence to medical recommendations: a quantitative review of 50 years of research. MedicalCare 42: 200–209.
  40. DiMatteo MR, Haskard KB, Williams SL (2007) Health beliefs, disease severity, and patient adherence: a meta-analysis. Medical Care 45: 521–528.
  41. DiMatteo MR, Haskard-Zolnierek KB, Martin LR (2012) Improving patient adherence: a three-factor model to guide practice. Health Psychology Review 1: 74–91.
  42. Dubes R, Jain AK (1980) Clustering methodologies in exploratory data analysis. In Advances in Computers 1: 13–228.
  43. Epstein RM, Street RL (2007) Patient-centered communication in cancer care: promoting healing and reducing suffering. National Cancer Institute
  44. Gabay G (2015) Perceived control over health, communication and patient- physician trust. Patient Education and Counseling98: 1550–1557.
  45. Gabay G (2016) Exploring perceived control and self-rated health in re-admissions among younger adults: A retrospective Study. Patient Education and Counseling 99: 800–806.
  46. Gabay G, Moskowitz HR (2012)the algebra of health concerns: implications of consumer perception of health loss, illness and the breakdown of the health system on anxiety. International Journal of Consumer Studies36: 635–646.
  47. Gabay G, Zemel G, Gere A, Zemel R, Papajorgji P, et al. (2018) On the threshold: What concerns healthy people about the prospect of cancer.Cancer Studies and Therapeutics Journal 3: 1–10.
  48. Gabay G, Gere A, Stanley J, Habsburg-Lothringen C, Moskowitz HR(2019) Health threats awareness – Responses to warning messages about cancer and smartphone Usage. Cancer Studies Therapy Journal4: 1–10.
  49. Gabay G, Gere A, Zemel G, Moskowitz D, Shifron R, et al. (2019) Expectations and attitudes regarding chronic pain control: An exploration using Mind Genomics. Internal Medicine Research Open Journal4: 1–10.
  50. Gabay G, Gere A, Moskowitz HR (2019) Uncovering communication messages for health promotion: The case of arthritis. Integrated Journal of Orthopedic Traumatology2: 1–13.
  51. Gabay G, Gere A, Moskowitz HR. (2019) Understanding effective web messaging – The Case of Menopause. Integrated Gynecology & Obstetrics Journal 2: 1–16.
  52. Gabay G, Gere A, Stanley J, Habsburg-Lothringen C, Moskowitz HR (2019) Health threats awareness – Responses to warning messages about Cancer and smartphone usage. Cancer Studies Therapeutics Journal4: 1–10.
  53. Gofman A, Moskowitz HR (2010) Isomorphic permuted experimental designs and their application in conjoint analysis. Journal of Sensory Studies 25: 127–45.
  54. Haskard-Zolnierek KB, DiMatteo MR (2009) Physician communication and patient adherence to treatment: a meta-analysis. Medical care 47: 826.
  55. Haynes R, Ackloo E, Sahota N, McDonald H, Yao X (2008) Interventions for enhancing medication adherence. Cochrane Database of Systematic Review 2: CD000011.
  56. Haynes RB, Yao X, Degani A, Kripalani S, Garg A, et al.(2005) Interventions to enhance medication adherence. Cochrane Database Systematic Review 4
  57. Kreuter MW, Strecher VJ, Glassman B (1999) One size does not fit all: the case for tailoring print materials. Annals of behavioral medicine 21: 276.
  58. Levinson W, Lesser CS, Epstein RM (2010) Developing physician communication skills for patient-centered care. Health affairs 29: 1308–1310.
  59. Osterberg L, Blaschke T (2005) Adherence to medication. N Engl J. Med 353: 487–497.
  60. Petty RE, Cacioppo JT(2012) Communication and persuasion: Central and peripheral routes to attitude change. Springer Science & Business Media 6.
  61. Ratanawongsa N, Karter AJ, Parker MM, Lyles CR, Heisler M, et al. (2013) Communication and medication refill adherence: the Diabetes Study of Northern California. JAMA internal medicine 11: 173–210.
  62. Rao JK, Anderson LA, Inui TS (2007) Communication interventions make a difference in conversations between physicians and patients: a systematic review of the evidence. Med Care 45: 340–349.
  63. Rosenthal R, Rosnow R (2007) Essentials of behavioral research: methods and data analysis. McGraw-Hill.
  64. Sabate E (2003) Adherence to long-term therapies: Evidence for action. Geneva: World Health Organization.
  65. Schmid KL, Rivers SE, Latimer AE, Salove P (2008) Targeting or tailoring?. Marketing health services 28: 32–37.
  66. Squier RW (1990) A model of empathic understanding and adherence to treatment regimens in practitioner-patient relationships. SocSci Med 30: 325–339.
  67. Stewart MA (1984) what is a successful doctor-patient interview? A study of interactions and outcomes. SocSci Med 19: 67–175.
  68. Tulsky JA (2005) Interventions to enhance communication among patients, providers, and families. Journal of palliative medicine 8: 95.
  69. Vermeire E, Hearnshaw H, Van Royen P (2001) Patient adherence to treatment: three decades of research, a comprehensive review. J Clin Pharm Ther26: 331–342.
  70. Williams-Piehota P, Schneider TR, Pizarro J, Mowad L, Salovey P (2003) Matching health messages to information-processing styles: Need for cognition and mammography utilization. Health Communication15: 375–392.
  71. Zolnierek KB, DiMatteo MR(2009) Physician communication and patient adherence to treatment: a meta-analysis. Medical care 47: 826.

Frustration in Seeking Information about Health Conditions and Health Insurance: Methodological Presentation of a Mind Genomics Cartography

Abstract

The paper uses the emerging science of Mind Genomics to understand emotional responses (frustration) and prevention of decisions experienced when the respondent reads test vignettes describing websites which provide medical information (health) and/or medical insurance information (health-related finances). Respondents read and evaluated combinations of 2–4 messages (answers to questions), with the messages combined according to an experimental design. The ratings on a five- point scale provided an assessment of both estimated ‘frustration’ and estimated ‘difficulty to make a decision.’ The analysis related the presence/absence of the messages to both frustration and to inability to make a decision. Three mind-sets emerged, suggesting that the estimated frustration encountered in difficult web searches for healthcare information is not unidimensional. The three emergent mind-sets are: MS1 (moderate latent frustration), MS2 (little latent frustration but easily & strongly frustrated) and MS3 (a great deal of latent frustration, doing best with a very simple, direct search process). The paper concludes with the presentation of the PVI, personal viewpoint identifier, which allows the healthcare provider to understand the sensitivities of the prospect, in terms of what problems increase frustration for that prospect. The objective of the PVI is to improve the user experience by understanding the mind of the user.

Introduction

The use of the Internet for searching and finding health information is rising and is accompanied by the realization that the ‘experience’ itself must be made easier. We are no longer in the birthing years of the 1970’s – 1990’s, when simply having access to a large world of information sufficed, astonishing those who had grown up in a world where information was to be sought after, no matter what the difficulty [1]. Experts have been replaced by websites, by chat advisors, by guided searches, so much so that often there is no expert but rather guidance embedded in the software and the instructions emerging from the software. People often first search the internet for information about diseases, then talk to their friends, and then encounter the doctors [2]. For diseases such as cancer, in earlier days a death sentence for many has spawned an entire network of communications and information [3–5]. The same goes for diabetes [6] and for heart disease [7]. As a consequence, medical information, may be getting increasingly dense over time as medicine advances and the literature and alternative options become overwhelming, for example the “BELONG” community of cancer patients [8]. Much of this this transition and new world is contained within the words ‘user experience,’ a phrase which encompasses the range from one’s impression of the website to one’s experience with the website to achieve certain goals. In the previous generations of science this area would have been subsumed under the rubric ‘man-machine interaction’ in the world of ‘human factors.’

This paper focuses specifically on one aspect of the user experience, the source for diagnosis and treatment information, both in terms of medical information and in terms of medical coverage information. The objective is to quantify the important of different aspects of the search as they drive expected frustration and expected inability to make a decision [9]. A traditional strategy to obtain the information is by a guided interview. The research instructs respondents to answer questions about needs, asks about sources of frustration, and experienced challenges in choosing an answer. The study would also measure responses when participants are exposed to the actual information and instructed to make a decision. Our approach complements this typical study just described. Our experiment presents respondents with vignettes defining the situation and instructs the respondents to select the likely outcome based upon the description of the experience. The analysis deconstructs the response to these vignettes into the contribution of the different elements of the vignette as drivers of expected frustration.

Mind Genomics as an emerging science traces its history to a combination of statistics (experimental design [10] conjoint measurement as ways to study decision-making [11, 12]. Mind Genomics expands topics from the laboratory out to everyday life. Furthermore, Mind Genomics expands the capabilities of design of experiments, using individual permutations of a basic, fundamental design. The consequence is that one need not overthink the selection of combinations of elements to go into the design. The permutation covers a wider amount of the space, analogous to the way the MRi in medicine takes many pictures of underlying tissue, not just the ‘correct one’, which may not even be known [13,14] The result has been the creation of a new science with applications from policy to products, from law to health and everyday life [15,16].

Mind Genomics method

Mind Genomics approaches the problem by an easy to construct, easy to analyze experiment. The experiment comprises a topic (sources of frustration and choice prevention during the search for medical information on the Internet), a set of four questions which ‘tell a story’ (the Socratic approach), and then requires four simple answers to each question, or a total of 16 answers. The Mind Genomics paradigm is designed to be fast, iterative, provide optimal results, and powerful results terms of a measure of the ability of each answer to ‘drive’ the response, a measure of conscious judgment, as well as measuring response time, a metric which reflects deeper cognitive processing or emotions.

The set of four questions and the 16 answers, four answers to each question, appears in Table 1. The objective is to work with untrained respondents, over the Internet, requiring that the answers be simple, direct, and easy to comprehend. The questions in Table 1 never appear in the test stimuli. Rather, the test stimuli comprise simple vignettes, combinations of the answers, 2–4 answers for any vignette. Each vignette has at most one answer from a question, but for many of the vignettes one or two questions do not contribute an answer. This design structure is deliberate, for statistical reasons, specifically to increase the strength of the analytic tool, OLS (ordinary least-squares) regression.

Table 1. The four questions and the four answers to each question

Question 1 – Stage of Life

A1

Current disease

A2

Time since diagnosis

A3

Stage of disease

A4

Transition in life

Question 2 – Reason for search

B1

Make best decision

B2

Make best decision considering health

B3

Make best decision considering my situation

B4

Make best decision for my future

Question 3 – Reactions to information presented

C1

Information is relevant but hard to understand

C2

Have to do multiple searches before making a decision

C3

Information is scattered – frustrates me

C4

Information doesn’t seem trustworthy

Question 4 – Information Wanted

D1

Looking for: specific rates

D2

Looking for simple way to contact and get answers

D3

Looking for specific services

D4

Looking for process

Figure 1 (left panel) shows the screen shot requiring the researcher to ask four questions. Figure 1 (right panel) shows one question, and the four answers to that question. The answers should be stand-alone phrases that can be understood, in and of themselves. The set-up system for Mind Genomics thus encourages critical thinking, and in the end, a deeper understanding of the topic by combining this thinking with affordable, rapid experimentation among prospective customers.

Mind Genomics-027 - ASMHS Journal_F1

Figure 1. Screen shots from the set-up of the study. The left panel shows the four questions. The right panel shows the four answers provided by the research to question 3

Experimental design

Each respondent evaluated a unique set of 24 combinations or vignettes. Each vignette comprised 2–4 elements or answers, no more than one answer from any question. The answers were stacked atop each other. The experimental design ensures that for each individual the 16 answers appear several times, and an equal number of times. The incompleteness of the design, with some vignettes absent one or two answers, ensures that the OLS (ordinary least-squares) regression will run without any problem. When the researcher requires each vignette to contain exactly one answer or element from each question, a very common practice, the sad, actually destructive outcome is that the OLS regression can return only with relative values for the coefficients, not absolute values, the cause being the multi-collinearity among the elements due to the requirement that each vignette be ‘complete’ with exactly one answer from each question.

Statistical analysis

The rating scale comprises five points, covering two dimensions, frustration and inability to make a decision. The actual rating scale appears below

Please read the experience below about a person searching for medical information about medical insurance plans. Select which of the following phrases describe the feeling

 1=no problem
2 =not frustrated … Easy to make decision
3=not frustrated … Hard to make decision
4=frustrated … Easy to make decision
5=frustrated … Hard to make decision

We create four variables from this single scale, as follows:

The two ‘negative outcomes’

Frustrate YES (abbreviated as Frust YES) – when the rating is 4 or 5, we code this new variable, Frustrate YES, as 100. Otherwise we code Frust YES as 0.

Decide NO (abbreviated as Dec NO) – when the rating is 3 or 5, we code this new variable, Decide NO, as 100. Otherwise we code DEC NO as 0.

The two ‘positive outcomes’

Frustrate NO (abbreviated as Frust NO) – when the rating is 1,2 or 3, we code this new variable, Frust NO, as 100. It should be obvious that Frust NO is the inverse of Frust YES

Decide YES (abbreviated as Dec YES) – when the rating is 1, 2, or 4, we code this new variable, Dec YES, as 100. Otherwise we code it as 0. Again, Dec YES is the inverse of Decide NO.

The experimental design enables us to run models, at the level of the individual, relating the presence/absence of the 16 elements or answers to either the two negative outcomes, or to the two positive outcomes, respectively. The analysis pools all the data from the relevant subgroup, and runs one entire or ‘grand’ models. The analysis will, however, run individual-levels models for the mind-set segmentation, discussed below in the section on mind-sets.

The equation relating the presence/absence of the 16 elements to the ratings (positive or negative outcome) is expressed by the simple equation: Specific Outcome = k0 + k1(A1) + k2(A2) … k16(D4)

The additive constant, k0, shows the estimated value of the variable (e.g., Frust YES), in the absence of elements. Of course, all vignettes comprised 2–4 elements by design, so that the additive constant is an estimated value. It can be considered the baseline, the estimated percent of the time one is expected to hear that there a negative or positive experience, even without information about what exactly was presented.

The response time is defined as the time in seconds (to the nearest tenth of second) between the time that the vignette appears on the screen and the time that the respondent assigns a rating. The computer program measures that time. The response time model is written almost in the same way, but without the additive constant. We interpret the model as telling us the estimated number of seconds that the respondent spent ‘processing’ the specific element. The response time is a so-called objective measure, not under the control of the respondent. The respondent may not even be aware of the processing.

Total panel

Table 2 shows the parameters of five models relating the presence/absence of the 16 elements/answers from the four questions to response time (fifth data column) and to four “NET” ratings, those ratings talking about frustration (Frust YES, Frust NO), and those talking about the ability to make a decision (Dec YES, Dec NO). The table is arranged to show the elements which drive the negative outcomes (Frust YES, Dec NO), then the response time, and then the elements which drive the positive outcomes (Frust NO, Dec YES).

Table 2. Parameters of the models relating the presence/absence of the 16 elements to the NET negative and the net positive outcomes respectively, as well as to response time

NET Negative
Outcome

NET Positive
Outcome

Total

Frust Yes

Dec No

Response Time

Frust No

Dec Yes

Additive constant

20

52

 NA

80

48

C3

Information is scattered – frustrates me

38

10

1.2

-38

-10

C4

Information doesn’t seem trustworthy

19

15

1.3

-19

-15

C1

Information is relevant but hard to understand

16

16

1.5

-16

-16

D3

Looking for specifics

10

-4

1.8

-10

4

C2

Have to do multiple searches before making a decision

9

1

1.7

-9

-1

A1

Disease

4

-10

1.1

-4

10

A4

Time since diagnosis

0

-9

1.3

0

9

A2

Stage of disease

4

-9

1.1

-4

9

A3

Current Life stage: Transition

1

-7

1.0

-1

7

D2

Looking for simple way to contact and get answers

1

-2

1.7

-1

2

B2

Make best decision considering health

4

-1

1.7

-4

1

D1

Looking for prices and rates

5

-1

1.7

-5

1

B4

Make best decision for my future

-2

0

1.8

2

0

D4

Looking for process …how to ….

6

0

2.0

-6

0

B1

Make best decision

-2

1

1.7

2

-1

B3

Make best decision considering my situation

1

2

1.9

-1

-2

We begin with the additive constant, which gives us a sense of the percent of responses that will be assigned the NET rating in the absence of elements. Of course, all of the vignettes were created according to an experimental design which prescribed 2–4 elements per vignette, making the additive constant a purely calculated parameter. Nonetheless, the additive constant gives us a sense of a baseline response.

The additive constants for the two negative and the two positive outcomes are the following:

Negative: Frust Yes = 20
Negative: Dec No = 52
Positive: Frust No = 80
Positive: Dec Yes = 48

We conclude that there in general, people don’t feel that they are frustrated with the websites giving information (additive constant = 20 for Frus YES versus additive constant = 80 for Frust NO). In contrast, people feel that they cannot make a decision based upon the website (additive constant = 52 for Dec NO versus additive constant = 48 for DEC Yes).

Five specific answers or elements strongly frustrate the five frustrating elements are:
Information is scattered – frustrates me
Information doesn’t seem trustworthy
Information is relevant but hard to understand
Looking for specific answers
Have to do multiple searches before making a decision

Of these, three lead to aborting the decision
Information is scattered – frustrates me
Information doesn’t seem trustworthy
Information is relevant but hard to understand

Response time tells us additional information, namely the degree to which respondent think about the answer
Looking for process … how to…
Make best decision considering my situation
Looking for specifics
Make best decision for my future
Have to do multiple searches before making a decision
Looking for simple way to contact and get services
Make best decision considering health
Looking for: specific rates
Make best decision
Information is relevant but hard to understand

How problems interact with solutions

A key benefit of the permuted experimental design is the ability to assess the nature of the interaction between pairs of elements [13]. The approach is called scenario analysis. The scenario analysis holds a single element constant from one question, and estimates the coefficients of all elements or answers from the other questions.

The method of scenario analysis was applied to determine how the elements or answers to Question D, information wanted, interacted with the remaining elements. As will be seen in this analysis, the interactions can be dramatic. Depending upon the specific type of information wanted, some elements may be seen to frustrate not at all, or turn around and frustrate a great deal.

The process followed these steps for the first dependent variable, the negative outcome Frustrate YES

  1. Sort the 1200 records into five strata, based upon the specific element or answer from Question D. Question D contribute either no answer to a vignette, or one of four answers. We sort the database into the five strata.
  2. For each stratum, we estimate the additive constant and the 12 coefficients, A1-C4. We do not use the elements or answers from Question D because they are either absolute, or held constant.
  3. The results appear in Table 3 for the dependent variable being Frustrate YES, i.e., the combination of answers where the respondent said she or he would be frustrated, whether or not the respondent would make a decision.
  4. We begin with the additive constant, which is very low when there is no information wanted (additive constant = 18). The basic frustration is highest (additive constant = 35) when the respondent is presented with the task of ‘looking for process how to file the claim.’
  5. An element can be alternately not frustrating or very frustrating, depending upon what one is searching for. Consider element C2 (Have to do multiple searches before making a decision.) When the respondent is looking for information (specific rates or simple way to get services), there is no frustration. Multiple searches do not lead to much frustration. When the issue specific and concrete (e.g., specific coverage or process to make a claim), the multiple searches becomes frustrating.
  6. The scenario analysis provides the researcher with a new tool to understand how pairs of elements interact with each other. The researcher need not incorporate specific interactions ahead of time. Rather, the permutation of the underlying experimental design leads naturally to the emergence of interactions, and an easy way to discover them.

Table 3. Scenario analysis showing how the combination of specific elements with elements from the fourth question (information-wanted) drives Frustrate YES

Question 4: Information Wanted


Frustrate YES

none

Looking for: specific rates

Looking for simple way to contact and get services

Looking for specific coverage

Looking for process how to file claim

D0

D1

D2

D3

D4

Additive constant

18

27

23

26

35

C3

Information is scattered – frustrates me

69

26

30

41

35

C4

Information doesn’t seem trustworthy

45

8

19

20

14

C1

Information is relevant but hard to understand

44

1

11

18

18

C2

Have to do multiple searches before making a decision

19

1

-3

25

9

B2

Make best decision considering health

7

10

-2

7

-6

B1

Make best decision

4

-1

3

7

-23

B3

Make best decision considering my situation

-5

3

9

-1

-9

A2

Current disease

-9

11

6

3

-5

A1

Current disease stage

-14

9

6

-2

8

A3

Time since diagnosis

-16

4

4

-1

2

B4

Make best decision for my future

-17

3

0

-5

9

A4

Current Life stage: Transitioning

-25

14

0

2

-3

We now turn to the second dependent variable, the negative outcome of No Decision Made. The results appear in Table 4. The pattern is radically different.

Table 4. Scenario analysis showing how the combination of specific elements with elements from the fourth question (information-wanted) drives Decision NO

Question 4: Information Wanted


Decision NO
(no decision made)

none

Looking for: specific rates

Looking for simple way to contact and get services

Looking for specific coverage

Looking for process how to file claim

D0

D1

D2

D3

D4

Additive constant

22

40

40

72

59

C4

Information doesn’t seem trustworthy

34

20

10

-2

17

C3

Information is scattered – frustrates me

26

17

7

-6

5

B1

Make best decision

24

7

-7

-13

7

B3

Make best decision considering my situation

21

6

-8

-14

12

C1

Information is relevant but hard to understand

19

40

17

-2

8

B4

Make best decision for my future

15

4

-6

-2

2

B2

Make best decision considering health

14

5

-8

-5

-3

A3

Current disease

5

-3

18

-16

-28

C2

Have to do multiple searches before making a decision

3

2

9

-15

12

A2

Current disease stage

-3

-13

13

-17

-12

A4

Time since diagnosis

-3

-13

9

-9

-28

A1

Current life stage: Transitioning

-12

-4

1

-8

-16

  1. The greatest basic likelihood of no decision is ‘Looking for specific coverage’ (additive constant = 72.) The next highest likelihood of no decision is ‘Looking for process how to file a claim’ (additive constant = 59). The remaining two elements (Looking for specific rates and Looking for simple way to contact and get answers) show lower additive constants, 40 each. The take-away from this initial finding is that the likelihood of no decision is a function of what people are looking for, with the most problematic being specifics. The website should concentrate on example of specific services, or a way to provide a rate.
  2. When there is no task, the additive constant is low (22) but many of the elements drive the decision. The most severe is ‘information doesn’t seem trustworthy’ but there are many other elements which strongly drive ‘No Decision.’
  3. There are specific interactions which make intuitive sense, such as Looking for simple way to contact and get answers (D2) coupled with Current disease stage (A3). We might not immediately think of that, but the data reveals the interaction, and suggests that we pay attention to that possible problem combination.

We now turn to the third and final dependent variable, response time. As noted above, response time does not measure a cognitively meaningful response to the vignette such as Frustrate YES, Decide NO, but rather the length of time required for the respondent to process the information in the vignette, and assign a rating. The equation does not have an additive constant, because without any elements there is no predisposition to respond. Furthermore, our focus is on the effect of one of the four searches, D1-D4. We consider only four strata, each stratum fixing one of the four search goals.

Table 5 shows the parameters of the models. The response times are quite long for the individual elements, often longer than 2.3 seconds, the cut-off level beyond which the cell is shaded, and the numbers in bold text. The interactions are different across the four answer for Question D, ‘Information Wanted.’

Table 5. Scenario analysis showing how the combination of specific elements with elements from the fourth question, information-wanted, drives Response Time

Information Wanted (Question 4)


Response Time

Looking for: specific rates

Looking for simple way to contact and get services

Looking for specific coverage

Looking for process how to file claim

B2

Make best decision considering health

2.9

1.7

1.7

1.8

B1

Make best decision

2.5

2.7

1.8

1.8

A1

Current disease stage

2.3

1.1

2.0

2.0

B3

Make best decision considering my situation

2.2

2.9

2.1

2.3

B4

Make best decision for my future

2.0

2.7

1.4

2.8

C1

Information is relevant but hard to understand

2.0

2.3

2.7

2.4

C2

Have to do multiple searches before making a decision

1.9

2.1

2.9

2.2

C3

Information is scattered – frustrates me

1.6

1.6

2.8

1.8

C4

Information doesn’t seem trustworthy

1.6

1.9

2.2

2.6

A4

Time since diagnosis

1.8

1.5

1.9

2.8

A3

Current disease

1.8

1.5

1.4

1.7

A2

Current disease stage

1.6

1.4

1.4

1.7

Looking for: specific rates
Make best decision considering health
Make best decision
Current disease stage

Looking for simple way to contact and get answers
Make best decision considering my situation
Make best decision
Make best decision for my future
Information is relevant but hard to understand

Looking for specifics
Have to do multiple searches before making a decision
Information is scattered – frustrates me
Information is relevant but hard to understand

Looking for process …. how to….
Current disease stage
Make best decision for my future
Information doesn’t seem trustworthy
Information is relevant but hard to understand
Make best decision considering my situation

Key subgroups

The ability to have each respondent evaluate the precise array of vignettes makes it easy to the researcher to look at different groups of respondents, and at the same time be assured that the pooled data will both maintain the statistical independence need for OLS regression, and cover a large proportion of the design space.

We begin again with the net attribute, Frustrate YES. The additive constant shows dramatic group to group differences in the basic likelihood to say ‘frustrated’ when presented with the vignette ‘without elements’ (see Table 6). When we compare the additive constant with the net attribute, Decide NO, we find radical differences. There is a very wide range of basic levels of frustration, as shown by the additive constant, whereas a much narrower range in the basic inability to make a decision.

Table 6. Additive constants for group-based models relating the presence/absence of the 16 elements/answers to both the Net Attribute ‘Frustrate YES’ and the Net Attribute ‘Decide NO’

Frustrate YES

Decide NO

Frustrates


Age: 60 Plus

26

50

Age: 30–49

24

60

Life stage: Family

23

58

Gender: Female

23

52

Age: 23–20

21

40

Retards Decision


Life stage; Retire

18

66

Age: 30–49

24

60

Life stage: Just graduated college

1

60

Neither


Gender: Male

18

54

Age 50–59

5

54

Table 7 shows the parameters of the models by each subgroup for Frustrate YES

Table 7. Group models relating the presence/absence of NET Variable Frustrate YES to the 16 elements

Net Frustrate YES
(Frustrates Me)

Male

Female

Age 23–29

Age 30–49

Age 50–59

Age 60+

Just graduated

Family

Retire

CONSTANT

18

23

21

24

5

26

1

23

18

C3

Information is scattered – frustrates me

28

48

28

45

37

36

17

51

23

C4

Information doesn’t seem trustworthy

14

24

15

25

9

24

15

29

17

D3

Looking for specifics

14

7

-2

13

13

16

17

12

12

D1

Looking for rates

13

-2

-12

8

8

14

30

1

22

C1

Information is relevant but hard to understand

10

22

7

13

19

29

19

17

9

A1

Current life stage: transitioning

8

0

10

7

7

-14

17

2

5

A3

Current disease

8

-6

3

6

-2

-11

18

2

-3

D2

Looking for simple way to contact and get services

7

-6

-8

3

10

-5

16

-6

-4

D4

Looking for process how to file claim

7

5

-13

6

15

12

13

3

14

C2

Have to do multiple searches before making a decision

5

13

3

14

7

7

10

12

3

A4

Time since diagnosis

4

-5

-5

1

9

-11

18

-5

-1

B2

Make best decision considering health

2

7

5

3

5

5

-1

7

7

A2

Current disease stage

1

8

1

1

16

-2

12

11

10

B1

Make best decision

1

-4

0

-5

-4

11

11

-8

14

B3

Make best decision considering my situation

-4

4

6

-7

4

9

2

-6

8

B4

Make best decision for my future

-4

0

6

-6

1

0

1

0

4

Among the most frustrating elements are
Information is scattered – frustrates me
Information doesn’t seem trustworthy

Table 8 shows the parameters of the model by each subgroup for Decide NO

Table 8. Group models relating the presence/absence of NET Variable Decide NO to the 16 elements

Net Decision NO
(Prevents me from making a decision)

Male

Female

Age 23–29

Age 30–49

Age 50–59

Age 60+

Just graduated

Family

Retire

Additive constant

54

52

40

60

54

50

60

58

66

C4

Information doesn’t seem trustworthy

12

18

15

9

18

27

0

16

19

C1

Information is relevant but hard to understand

13

19

9

13

15

25

-2

16

25

C3

Information is scattered – frustrates me

7

13

11

-3

21

22

-9

11

8

C2

Have to do multiple searches before making a decision

-1

3

6

-7

-2

20

-9

-5

14

B1

Make best decision

-6

8

2

-6

5

12

-9

-3

8

B3

Make best decision considering my situation

-4

6

-8

2

-3

9

-3

-2

-5

B4

Make best decision for my future

-2

1

5

-5

2

3

5

-4

-7

B2

Make best decision considering health

-4

2

5

-12

12

0

4

-5

-7

A2

Current disease stage

-9

-9

-8

-11

-8

-7

-15

-6

7

A4

Time since diagnosis

-3

-15

-13

-5

-16

-7

-7

-15

6

A1

Current life stage: Transitioning

-4

-15

-8

-11

-13

-8

-8

-15

0

D1

Looking for specifics

-3

0

-4

3

-5

-11

9

2

-12

D2

Looking for simple way to contact and get answers

-3

-2

8

-3

-2

-11

-5

5

-9

A3

Current disease

-2

-12

-3

-11

4

-15

-12

-11

4

D4

Looking for process… how to…

0

-1

7

2

4

-15

6

5

-19

D3

Looking for specifics

-7

-3

-7

1

-4

-19

8

-1

-17

Among the elements which hinder decisions are
Information doesn’t seem trustworthy
Information is relevant but hard to understand
Information is scattered – frustrates me

The older respondents (age 50–59 and age 60+) are the most likely to report frustration or inability to make a decision.

The youngest respondents, report that they are frustrated, but they say that they can make a decision. This is an important fact. It appears that frustration may be an emotional reaction whereas decision may be a simple action.

Mind-Sets in the population based upon how easily a person is frustrated in the search

A key feature of Mind Genomics is the extraction of new-to-the-world mind-sets, based upon how the person thinks with regard to the specific topic. During the past sixty years, consumer researchers have recognized the value of dividing people by patterns, either of WHO they age (geo-demographics), what they DO (behavior), or how they THINK about general topics [17].

The notion that people differ from each other is obvious but it is not clear that one can know exactly WHAT TO SAY to a person when one knows WHO they are, what they DO, or what they BELIEVE. One could make the case, of course, that one knows certain things that one should say, but what are the precise words, the precise communication messages for a person, say in the world of health information? How does one know what to say to a person on the web, or the next person who walks in the door?

It is tempting to believe that the general segmentations based upon previous behavior will indicate what to say. The answer is not clear. Behavioral targeting is all the rage today, as of this writing (August, 2019), but it is not clear that a person who asks for rates about a health service will answer every message. The words must be correct. The sensitivity to the mind of the patient must be tuned. And, most of all, one must ‘know’ what words to do, what actions to take, not so much in the grand world at so-called 20,000 feet, where the detail is lost, but rather ‘on the ground’ in granular detail.

Mind Genomics works in the world of the concrete, the world of daily experience, the world of specific words and phrases. The studies in Mind Genomics are not posed as questions to be answers, but as vignettes to which one reacts. This structure eventuates in the above-demonstrated set of coefficients. Segmentation, in turn, becomes the identification of different and meaningful patterns of coefficients, and therefore ‘mind-sets.’ The ‘mind-set’ is a coherent pattern of coefficients, with each respondent in the study assigned to one of the mind-sets, based upon the pattern of that individual’s coefficients.

For this study, the discovery of the mind-sets was based upon clustering of individuals using the coefficients from Frustrate YES, i.e., individual patterns of getting frustrated. Frustration is a basic emotion among people, especially those who search for necessary information. The process follows these steps:

  1. Array the coefficients for Frustrate ME so that each row is a respondent, and each respondent has 16 numbers, one for each coefficient. The additive constant is not used for the cluster analysis.
  2. Cluster the respondents using K-means clustering [18]. so that individuals close together are clustered together. The measure of distance is (1-Pearson R), with Pearson R taking on the value of +1 when two patterns are identical (distance = 0) and with Pearson R taking on the value of -1 when two patterns are diametrically opposite (distance = 2).
  3. The objective of clustering and segmentation is to find a meaningful division of respondents, based upon specific criteria. Clustering is a heuristic in exploratory data analysis, not a hard-and-fast system, although the mathematics are stringent and reproducible.
  4. Compare the two-cluster and three-cluster solution. Choose the solution with the lower size only when it is easy to interpret. For these data, the three-cluster solution was easier to interpret, but interpretation is a subjective matter.
  5. Three mind-sets emerged from the clustering. The clustering program does not label these, but rather the naming of the mind-is left to the researcher. The typical naming considers the strongest performing elements, and in this study, the additive constant. Table 9 presents the strongest performing elements for each of the three mind-sets.

Table 9. How three emergent mind-sets based on what drives ‘Frustrate YES) respond to the elements in terms of the segmenting criterion, Net Frustrate YES


Net Frustration (Frustrate YES – basis of the clustering)

MS1

MS2

MS3

Additive constant

24

3

35

Mind-Set 1 – Has some latent frustration, but gets really frustrated when search is difficult

C3

Information is scattered – frustrates me

46

63

3

C4

Information doesn’t seem trustworthy

25

35

-3

Mind-Set 2 – Has very little latent frustration, but easily and strongly frustrated

C3

Information is scattered – frustrates me

46

63

3

C4

Information doesn’t seem trustworthy

25

35

-3

C1

Information is relevant but hard to understand

13

34

0

Mind-Set 3 –A lot of latent frustration, wants search to be simple, direct, give the information, gets frustrated when process is not simple, direct (KISS)

D2

Looking for simple way to contact and get answers

-9

-5

21

D3

Looking for specific service

11

4

20

D1

Looking for rates

17

-11

17

D4

Looking for process …how to…

6

1

10

B2

Make best decision considering health

-3

8

9

B4

Make best decision for my future

-17

-1

8

Elements which do not strongly drive frustrations among the mind-sets

B3

Make best decision considering my situation

-7

7

1

A1

Current life stage: Transitioning

8

3

1

B1

Make best decision

-12

2

1

C2

Have to do multiple searches before making a decision

15

17

-4

A3

Current disease

13

-3

-7

A2

Current disease stage

-2

19

-9

A4

Time since diagnosis

12

-1

-11

Mind-Set 1 – Has some latent frustration, as shown by the modest additive constant, 24. Mind-Set 1 gets really frustrated when the search is difficult. The latent frustration emerges from the relatively high additive constant of 24. The two strongest elements drive a high degree of frustration

Information is scattered – frustrates me
Information doesn’t seem trustworthy

Mind-Set 2 has almost no latent frustration (additive constant = 3), but also easily frustrated, and strongly so. The same two elements drive Mind-Set 2 compared to Mind-Set 1, only far more.

Mind-Sets 1 and 2 may be combined to generate a general mind-set which simply wants easy answers, in general.

Mind-Set 3 is altogether different. Mind-Set 3 exhibits quite strong latent frustration (additive constant = 35, wants search to be simple, direct, give the information, gets frustrated when process is not straightforward. Here are the strongest frustrating elements for Mind-Set 3:

Looking for simple way to contact and get answers
Looking for specific service
Looking for rates

When we apply the mind-sets just discovered for frustration to blockers of decision (Net Decide NO), we find that Mind-Sets 1 and 2 are similar in terms of their propensity not to decide (additive constant 58 and 60) whereas Mind-Set 3 is less hindered (additive constant 42.). Mind-Set 3 is more of a perfectionist, with B1 (make best decision) a source of failure to make a decision. Table 10 shows these results.

Table 10. How three emergent mind-sets based on what drives ‘Frustrate ME) respond to the elements hindering a decision (Net Decide NO)


NET Decide NO

MS1

MS2

MS3

Additive constant

58

60

42

C4

Information doesn’t seem trustworthy

20

12

16

C1

Information is relevant but hard to understand

17

12

22

C3

Information is scattered – frustrates me

-5

14

19

B1

Make best decision

-9

1

9

C2

Have to do multiple searches before making a decision

-8

3

7

B3

Make best decision considering my situation

-1

-3

4

D1

Looking for rates

-5

-3

2

A3

Current disease

-9

-14

2

D2

Looking for simple way to contact and get services

-4

-6

1

D3

Looking for a specific service

-7

-10

1

B2

Make best decision considering health

-10

3

0

A4

Time since diagnosis

1

-25

0

D4

Looking for process … how to…

6

-3

-2

B4

Make best decision for my future

6

-4

-2

A1

Current life stage: transitioning

-4

-22

-3

A2

Current disease stage

-6

-14

-6

When we move to response time, we find dramatic differences.

Mind-Set 2, which showed the least latent frustration (additive constant = 3), also shows the longest response times. That is, Mind-Set 2 reads everything closely.

Mind-Sets 1 and 3 both show a high level of latent frustration (additive constant = 24 for Mind-Set 1 and additive constant = 35 for Mind-Set 3.). These two mind-sets show shorter response times, consistent with their latent frustration. Mond-Set 3 appears to consider the information in a slightly deeper way than does Mind-Set 1, because its response times are slightly longer.

Finding these mind-sets in the population (The Personal Viewpoint Identifier)

A continuing result from Mind Genomics studies is mind-sets distribute in the population in ways that are unexpected. Everyday experience with the different services suggests that there are different mind-sets or preference patterns for various services. The value of a conversation with a health provider (boot, chat or live) is obtained through the personalization using tailored messaging.

Table 12 suggests that who a person IS does not correspond to the mind set to which the person belongs.

Table 11. How three emergent mind-sets based on what drives ‘Frustrate YES) respond to the elements in terms of Response Time


Response Time – To process information

MS1

MS2

MS3

D3

Looking for specific services

2.0

2.0

1.3

B3

Make best decision considering my situation

1.9

2.5

1.3

B4

Make best decision for my future

1.7

2.3

1.3

D2

Looking for simple way to contact and get answers

1.3

2.2

1.3

B2

Make best decision considering health

1.2

2.2

1.4

D4

Looking for process… how to …

1.9

2.1

1.8

D1

Looking for: specific rates

1.4

2.0

1.5

B1

Make best decision

1.2

2.0

1.8

C2

Have to do multiple searches before making a decision

1.7

1.7

1.6

A4

Time since diagnosis

0.4

1.7

1.8

C4

Information doesn’t seem trustworthy

1.2

1.6

1.1

A3

Current disease

0.4

1.6

0.8

C1

Information is relevant but hard to understand

1.1

1.5

1.9

C3

Information is scattered – frustrates me

1.1

1.5

1.2

A2

Current life stage: transitioning

0.6

1.3

1.2

A1

Current disease stage

0.8

1.2

1.2

Table 12. Distribution of mind-sets across geo-demographics and disease stage

Mind-Set 1 – Has some latent frustration, but gets really frustrated when search is difficult 

Mind-Set 2 – Has very little latent frustration, but easily and strongly frustrated 

Mind-Set 3 –A lot of latent frustration, wants search to be simple, direct, give the information, gets frustrated when process is not simple, direct 

Total

Total

14

19

17

50

Gender 

Male

10

6

10

26

Female

4

13

7

24

Age

Age 23–29

1

3

3

7

Age 30–49

10

6

6

22

Age 50–59

2

6

4

12

Age 60 Plus

1

4

4

9

Life Stage

Graduate College

3

0

3

6

Family

8

10

4

22

Retired

1

2

4

7

No Answer

2

7

6

15

During the past several years authors Gere and Moskowitz have developed a set of simple algorithms based upon the coefficients of corresponding elements emerging from the clustering program. Either all or just a limited number of the elements need to be used, but at least eight elements are required. The algorithm uses a Monte-Carlo method to identify those elements which best discriminate between two mind-sets or across three mind-sets, when ‘noise’ is added to the data. The algorithm has been labelled the PVI, the Personal Viewpoint Identifier. The PVI works with individual respondents, identifying their mind-set, and where relevant, returning information to them, either information which is informative, prescriptive, or both. Figure 2 shows an example of the PVI. The PVI returns with the mind-set of the respondent and may provide the respondent or the health maintenance organization with additional information in terms of feedback. The PVI takes approximately 30 seconds to administer.

Mind Genomics-027 - ASMHS Journal_F2

Figure 2.
The PVI for the study, showing the questions and the two possible answers to each question

Discussion and Conclusions

In a world where individuals are increasing empowered to discover information previously known only to a cadre of specialists brings with it the problem of frustration and indecision. The world of UX and CX, user experience and patient experience, respectively, have developed to address this situation. These efforts did not begin with the world of the Internet, but rather were begun much earlier by psychologists studying the interaction of people and machines, the field of human factors.

The issue of user experience is magnified when we move beyond games and shopping, with momentary risk, to the search for health information on the internet. Looking at the response times shows us the amount of time that respondents take to process the information. The response times are quite long compared to other topics.

The importance of this study stems from the use of Mind Genomics as an easy-to-implement first stage in understanding the user experience. Rather than building out the system and then first testing the system for usability, the Mind Genomics approach can suggest different aspects of what frustrates a person, what prevents a decision and the nature of the person as a user. Mind Genomics thus gives voice to the individual as well, not as a purely linked part of the user experience, but as another independent dimension, based upon the proclivities of the user. As such, Mind Genomics carries forth the vision of Goldsmith [19], who two decades ago recognized the coming tidal wave of innovation. Mind Genomics is just one of the contributors to what promises to be an increasing tidal wave of innovation as the opportunities and problems in managed health care become increasingly obvious with our aging population.

Acknowledgement

Attila Gere thanks the support of Premium Postdoctoral Research Program of the Hungarian Academy of Sciences.

References

  1. Fein R (1986) Medical care, medical costs: The search for a health insurance policy. Cambridge, MA: Harvard University Press.
  2. Fox S (2011) The social life of health information. DC: Pew Internet & American Life Project 1–33.
  3. Arora NK, Hesse BW, Rimer BK, Viswanath K,Clayman ML, et al.(2008) Frustrated and confused: the American public rates its cancer-related information-seeking experiences. Journal of general internal medicine 23: 223–228.
  4. Kim K, Kwon N (2010) Profile of e-patients: analysis of their cancer information-seeking from a national survey. Journal of health communication 15: 712–733.
  5. Viswanath K (2005) the communications revolution and cancer control. Nature reviews cancer 5: 828.
  6. Janeice-Morgan A, Janeice-Mogan M, Trauth M (2013) Socio-economic influences on health information searching in the USA: the case of diabetes. Information Technology & People 26: 324–346.
  7. Ayers SL, Kronenfeld JJ, (2007) chronic illness and health-seeking information on the Internet. Health 11: 327–347.
  8. Macinnes N,HaglundBJ (2011) Readability of online health information: implications for health literacy. Informatics for health and social care 6: 173–89.
  9. Cebul RD, Rebitzer JB, Taylor LJ, Votruba ME(2011) Unhealthy insurance markets: Search frictions and the cost and quality of health insurance. American Economic Review 101: 1842–1871.
  10. Box GE, Hunter WG, Hunter JS (1978) Statistics for experimenters. New York, John Wiley.
  11. Green PE, Rao VR (1971) conjoint measurement for quantifying judgmental data. Journal of marketing research 8: 355–363.
  12. Green PE, Srinivasan V (1990) conjoint analysis in marketing: new developments with implications for research and practice. The journal of marketing 54: 3–19.
  13. Moskowitz HR (2012) ‘Mind genomics’: The experimental inductive science of the ordinary, and its application to aspects of food and feeding. Physiology & Behavior107: 606–613.
  14. Gofman A, MoskowitzH (2010) Isomorphic permuted experimental designs and their application in conjoint analysis. Journal of Sensory Studies 25: 127–145.
  15. Moskowitz HR, Gofman A, Beckley J, Ashman H (2006) Founding a new science: Mind genomics. Journal of sensory studies 21: 266–307.
  16. Moskowitz HR, Gofman A (2007) Selling blue elephants: How to make great products that people want before they even know they want them. Pearson Education.
  17. Wells WD (2011) Life Style and Psychographics, Chapter 13: Life Style and Psychographics: Definitions, Uses, and Problems. Marketing Classics Press.
  18. Dubes R, Jain AK (1980) Clustering methodologies in exploratory data analysis. Advances in Computers 19: 113–238.
  19. Goldsmith J (2000) The Internet and managed care: A new wave of innovation. Health Affairs 19: 42–56.

Electronic Aids to Emotional Relations: A Mind Genomics Development Cartography of a ‘Dating App’

Abstract

We present a new approach to understand what draws individuals to romantic ‘dating’ sites. The approach follows a Socratic sequence, requiring the researcher to follow a set of steps. These begin with defining the topic (dating site), then ask six related questions which ‘flesh out’ the topic, and then require six answers for each question, these answers or elements providing the detail. The actual approach is an experiment, in which test participants (respondents) evaluated 48 different combinations of these answers, in short vignettes comprising 2–4 answers. The relation between the individual respondent’s ratings and the presence/absence of the 36 elements allow for a regression model, whose parameters show the contribution of the elements. The process creates a database of knowledge (what do people want), identifies complementary mind-sets, and then creates a personal viewpoint identifier (PVI) which assigns a new person to one of the mind-sets by a simpler set of six questions, and one of two possible answers. We discuss the potential of this simple, rapid, cost-effective, and powerful method to create a large library about the ‘mind of the consumer.’

Introduction

A great deal of the popular press, especially on the Internet, involves the search for relationships, especially between those who would be called ‘potential partners.’ A quick look at ‘relationship dating apps’ in Google comes up with 366 MILLION ‘hits,’ ‘dating sites’ comes up with 704 MILLION hits. Asking for the ‘best‘dating apps’ produces a long list, some which are: Zoosk®, Match®, Elite®, Silver Singles®, and so forth. Moving over to the academic world, with Google Scholar, the repository of academic publications, we see 1.4 MILLION hits for ‘dating sites’ and 33,200 hits for ‘dating apps.’

Of course, we do not have to go to Google® or the scientific literature. We need only listen to the casual conversations around us to know how focused people are on their current partners, past partners, possible partners, and of course the world of non-partners considered from the viewpoint of casual relationships.

To capitalize on this search for partners and this fascination, a variety of companies have been formed to match partners. The applications do not begin as of this writing, or even as of this century, but go back to the 1960’s with computer dating. Indeed, author Moskowitz has had personal experience with these programs as far back as 1966, when the computer was recognized as a device to ‘match profiles,’

The presumed superiority of on-line dating sites comes from claiming that an underlying algorithm is better at matching two people than the traditional methods, such as blind introduction by friends of relatives. Whether, in fact, the algorithm is better than judgment is not the topic of this study. Rather, it would appear that even if the algorithm were not as good as judgment, the dating site comes up with an assortment of prospective partners, making the pursuit of the ‘right partner’ more time-efficient [1] There are a variety of studies of the user of the dating site from different aspects of the person himself or herself [2–6] but these studies do not appear to focus on the dating site as a product to be created, like any other consumer product.

Background

We use the emerging science of Mind Genomics to understand how people respond to the features of an online dating ‘app.’ Mind Genomics is an emerging psychological science dealing with the experimental analysis of the ‘everyday,’ and, specifically, the criteria by which we make decisions [7,8] Mind Genomics is an ‘experimenting science,’ which means it bases its data on the results of experiments in which the respondents are given various combinations of messages, features, ideas, combined in assortments according to a plan, so-called experimental design [9] The objective is to estimate how every one of the different messages of features ‘drives’ a response, whether the response be interest (our first rating question), or selection of a feeling after reading the combination.

The notion of experiment is important in Mind Genomics. A great deal of information about people, about desires in relationships, and so forth, is obtained by direct questions, the survey procedure. The survey answers are tabulated, analyzed through statistics, perhaps correlated with each other and with outside information, until the answers emerge through a pattern. The survey may be attitudinal. Another approach, increasingly popular, observe behavior in a natural setting, such as search information, and establishes patterns from the search information.

Mind Genomics is neither a survey of attitudes and practices, nor an observation of free ranging behavior in a choice situation. Rather, Mind Genomics is an experiment. Mind Genomics presents the ideas in combinations, vignettes, as noted above, deconstructs the response into the contribution of the individual components of the combination, the vignette, and then identifies a pattern from the data. The components, i.e., phrases, are ‘cognitively rich.’ They are statements about behavior which can stand alone and have meaning, the type of information to which we would ordinarily be subjected. It becomes easy to discover new ideas by simply looking at the ‘meaning’ of elements which perform well together in a specific subgroup.

Putting the Mind Genomics approach into action with ‘Online Dating’

The study comes from the interest of the authors in the nature of relationships, and what people want from a technology which creates the introduction. The topic, while not seeming profound, is actually quite deep in terms of the engagement of people who ‘set up the study.’ That is, for many Mind Genomics studies the efforts to create the study are made, but there is little excitement at the beginning. The topics may be profound, but to the ordinary person, the non-expert, the topics are mundane, if not downright boring. In contrast, the group(s) working on this study and similar studies comprised mainly women, typically between the ages of 18 and 50, rather than men. The topic, the questions, the answers (elements), were generated by women.

Step 1: Choose the topic and ask six questions which ‘tell a story.’ The topic as chosen was ‘online dating,’ specifically the features that a person would find interesting, and the emotions that would be experienced when using this online dating. Table 1 presents the six questions, and for each question, six answers.

Table 1. The six questions and the six answers to each question

Question A: How does it work, and what does it do?

A1

Easy login… with Facebook

A2

Online dating made easy

A3

Meet singles all around the world

A4

Registration is fast and effortless

A5

Fast efficient match making tools

A6

Receive matches by e-mail, free

Question B: How do numbers prove your point?

B1

We are the best predictors of happy and long-lasting relationships

B2

Has more dates, more relationships and more visits than any other online dating website

B3

Over 1 million conversations per day, with 30,000 new singles everyday

B4

Over 8,000 singles online now…making more connections everyday

B5

Debbie from New York says, “I never thought I would use a dating website… but that is how I met my husband, Paul”

B6

In the USA, 1 out of every couple found their spouse online

Question C: How do you appeal to authority, and what kind of tag lines support your appeal?

C1

Date smarter, not harder

C2

One-of-a-kind questionnaire to dig deeper to uncover your attitudes, beliefs and personality

C3

Find G-d’s match for you

C4

A fun, unique way to meet people

C5

Start finding all of the Mr. and Ms’ Rights you can handle

C6

Our online dating site and dating service is modern, professional and user-friendly

Question D: How do you ensure technical security?

D1

Number one most trusted online dating website

D2

100% invitation only…to better protect your privacy

D3

Your information is stored in our database for historical and legal purposes only

D4

Make yourself invisible with our one-of-a-kind privacy settings

D5

For singles concerned with privacy, rest assured contact details are never published

D6

Ranked in 2011 as McAfee’s most secure dating website

Question E: What are ‘simple’ reason to believe

E1

Oldest online dating website

E2

Use our respectable matching system

E3

Personal match maker working with you

E4

Partnership with Match.com to increase our services to you

E5

 No other website offers relationship expertise of someone like Dr. Phil or professional match making services

E6

Our website gives more meaning to ‘we are family’ than any other

Question F: What are the fees?

F1

Free personality test…matches you with more singles in your area

F2

Online dating for the cost of a single date

F3

Free trial for your first three months

F4

No credit card required

F5

Pay as you go…no contract necessary

F6

Put away your credit card…everything on this website is free

Combining Elements (Answers To The Questions) Into An Experimental Design

One of the tenets of Mind Genomics is that people cannot easily tell the researcher ‘what is important’ or, in a more quantitative fashion, assign the level of importance of each aspect of a situation. We may believe we can, but our judgment of what we read, what we see, what we hear, feel, smell and taste is so rapid that it is likely that any post-hoc reporting of what was important for the judgment may be a rationalization, an intellectualization of an otherwise rapid, almost automatic process. Indeed, Nobel Laureate Daniel Kahneman suggests that most of our everyday decisions come from an automatic reaction to the situations which confront us, decisions that are controlled by so-called System 1. When we are asked to think in a rational way, even about what has been reacted to automatically, we invoke a slower system, so-called System 2 [10]

Mind Genomics works using experimental design, which combines the elements into vignettes, test combinations, with the property that each vignette comprises a limited number of elements (2–4), with at most one element or answer from a question. The rationale is that the experimental design is useful both for ensuring the downstream statistical analyses by regression, and a bookkeeping device to prevent the juxtaposition of potentially mutually contradictory pieces of information in one vignette.

Each respondent evaluated a set of 48 vignettes, with each respondent evaluating a set of combinations totally different from the combinations evaluated by another respondent. The structure of the underlying experimental design is maintained. The mathematics allows the elements to appear an equal number of times, and ensures that at the level of an individual respondent the 36 elements are statistically independent of each other.

The use of mixtures, and the measurement of subjective response to those mixtures, constitutes a hallmark of Mind Genomics. The research strategy focuses on the response of a respondent to a series of unique combinations, with no discernable pattern, no single ‘story,’ and therefore an array of test stimuli, which in the words of psychologist William James, constitute a ‘blooming, buzzing confusion.’ One cannot ‘game’ this system. The stimuli come quickly, change, demanding simply that the respondent react to the combinations, a response which may start out as deliberate, but quickly becomes ‘automatic’ as the respondent realizes there is no discernable pattern. It is impossible to ‘game’ the experiment. Even the most determined respondent quickly becomes defeated, and returns to virtual automatic responding.

Figure 1 shows an example of the vignette. The vignette shows a four-element combination, with the elements centered to make reading easy. There are no connectives. The ingoing assumption is that respondents will scan the vignette, graze for the necessary information, and assign their rating. The bottom of the vignette shows the actual rating scale, in this example a 9-point Likert scale, anchored at both ends. The design of the vignette makes it easy to go through a large number of different vignettes, without becoming fatigued. Furthermore, the program is set up so that as soon as the vignette is rated on the first scale (joining), the second rating scale comes up (select an emotion, Figure 2). After the respondent has rated the vignette on these two scales (joining, select an emotion), the program automatically presents the next vignette.

Mind Genomics-025 - ASMHS Journal_F1

Figure 1. Example of a four-element vignette, with the first rating scale

Mind Genomics-025 - ASMHS Journal_F2

Figure 2. Example of the same four-element vignette, this time with instructions to select the appropriate emotion experienced after reading the vignette.

Table 2. Presents the summary results, sorted by the performance on Question #1 (join)

Total

Male

Female

Age 18–38

Age 39–52

Age 53+

Base Size

52

10

42

15

16

21

Additive constant

21

19

22

34

27

8

F6

Put away your credit card…everything on this website is free

14

17

13

10

18

13

F1

Free personality test…matches you with more singles in your area

13

20

11

6

12

17

B4

Over 8,000 singles online now…making more connections everyday

12

7

13

22

16

2

A2

Online dating made easy

10

16

9

12

11

8

A6

Receive matches by e-mail, free

9

15

8

6

9

12

B3

Over 1 million conversations per day, with 30,000 new singles everyday

9

4

10

11

10

6

B1

We are the best predictors of happy and long-lasting relationships

8

1

9

12

11

2

C2

One-of-a-kind questionnaire to dig deeper to uncover your attitudes, beliefs and personality

8

8

8

10

8

6

B2

Has more dates, more relationships and more visits than any other online dating website

7

3

7

-1

17

4

E4

Partnership with Match.com to increase our services to you

7

3

8

-1

14

7

F4

No credit card required

7

6

8

2

12

8

B5

Debbie from New York says, “I never thought I would use a dating website… but that is how I met my husband, Paul”

6

6

6

12

-4

10

D1

Number one most trusted online dating website

6

-4

8

2

9

5

D5

For singles concerned with privacy, rest assured contact details are never published

6

7

5

-7

4

16

E3

Personal match maker working with you

6

7

5

6

-1

10

E5

No other website offers relationship expertise of someone like Dr. Phil or professional match making services

6

2

6

2

3

10

A4

Registration is fast and effortless

5

19

2

5

9

3

B6

In the USA, 1 out of every couple found their spouse online

4

11

3

7

9

-1

C4

A fun, unique way to meet people

4

6

3

7

4

1

A3

Meet singles all around the world

3

11

2

4

2

4

A5

Fast efficient match making tools

3

18

0

5

-2

5

C1

Date smarter, not harder

3

11

1

3

0

5

C3

Find G-d’s match for you

3

2

3

-7

5

9

C6

Our online dating site and dating service is modern, professional and user-friendly

2

8

1

-4

5

4

D4

Make yourself invisible with our one-of-a-kind privacy settings

1

-4

2

-7

6

4

D6

Ranked in 2011 as McAfee’s most secure dating website

1

-1

2

-7

5

4

C5

Start finding all of the Mr. and Ms’ Rights you can handle

-1

7

-3

-2

-5

3

E1

Oldest online dating website

-1

3

-2

-7

14

-8

A1

Easy login… with Facebook

-2

15

-6

-16

4

3

F2

Online dating for the cost of a single date

-2

6

-4

-13

-6

9

F3

Free trial for your first three months

-2

1

-2

-8

-2

3

E2

Use our respectable matching system

-3

3

-4

1

-10

0

E6

Our website gives more meaning to ‘we are family’ than any other

-3

8

-6

-7

-2

-1

D2

100% invitation only…to better protect your privacy

-4

-4

-4

-16

1

0

D3

Your information is stored in our database for historical and legal purposes only

-7

-7

-7

-20

-1

-2

F5

Pay as you go…no contract necessary

-7

-4

-8

-14

-11

0

Running The Study

Upon clicking a link in the embedded email, sent by the e-panel provider, the respondent was presented with the invitation, and the information shown in Figure 3. The information provides very little background about the reasons for the study, other than the statement ‘Today, you will taking a survey regarding Online Dating.’ Although Mind Genomics is an experiment, the term ‘survey’ is less frightening, and was used in order to assuage any fears that might be aroused by the use of the technically more correct word ‘experiment.’

Mind Genomics-025 - ASMHS Journal_F3

Figure 3. The orientation page, shown to the respondent at the start of the Mind Genomics experiment

There are some specific caveats about the actual material, such as the fact that all of the vignettes differ from each other. In the earlier visions of the program, especially those not on the web but done in person on micro-computers, many respondents stated that they felt they were seeing the same vignette several times. This is a natural reaction, stemming from the fact that the respondent sees the same elements, combined however into different vignettes. They remember some of the phrases, and when they see the phrase again, they may not realize that the other elements in the vignette have changed.

The second noteworthy piece of information is the statement that the study will take 10–15 minutes. Respondents do not like open-ended, boring experiences which seem that they will never end. By giving the respondent a sense of a 10–15-minute experience, we forestall a lot of the potential for the length of the Mind Genomics experiment to become an issue.

A parenthetic note: We should keep in mind that there were no marital requirements for this experiment when the respondents were selected. We could have limited the study to unmarried individuals, but we wanted to get a general representation of individuals, married, single, younger, older males and females, respectively.

Data Analysis By Modeling – Question #1 – Join

Each respondent evaluated a set of 48 vignettes, arranged according to an experimental design. The ratings for each respondent for question 1 (join the dating website) were transformed so that ratings of 1–6 were replaced by 0 to denote little or no interest, and ratings of 7–9 were replaced by 100 to denote moderate or high interest. A very small random number was added to each binary transformation. The binary transformation follows the common practice of researchers in the social sciences and in political polling, who have come to realize that the precision of the scale is not easily translated to meaningfulness when the results of the study are subsequently applied by managers. Most managers, and indeed most researchers, do not know what the scale means, and especially have little or no idea what the intermediate scale points signify. The binary transformation simplifies the communication of the results and the use of the data.

The first column is the element code, the second column is the element text, and the remaining columns are the results from the different groups (total, gender, age).

The base size – number of respondents in the specific group

Additive constant –percent of responses which would be 7–9 in the absence of elements. The additive constant is a purely estimated parameter since all the vignettes by design comprised 2–4 elements. Nonetheless, the additive constant can be viewed as a baseline, showing the predisposition of the respondent to be positive. The additive constants are low, with the younger respondents (age 18–38) most optimistic, and the older respondents (age 53+) least optimistic about the site.

The performance of the individual elements. Mind Genomics provides a rich database from which to extract patterns. Mind Genomics does not need a pattern to ‘jump out,’ with the elements of the pattern simply observations. Rather, each element is ‘cognitively rich,’ with many possible meanings. The patterns which emerge come from both the meaning of the individual elements which score highest, as well as the commonality among those elements.

Total panel – free is the strongest performer:

Put away your credit card…everything on this website is free

Free personality test…matches you with more singles in your area

Male – many different elements, but free and easy are the strongest performers

Free personality test…matches you with more singles in your area

Registration is fast and effortless

Fast efficient match making tools

Put away your credit card…everything on this website is free

Online dating made easy

Receive matches by e-mail, free

Easy login… with Facebook

Females – free, safe (with an emphasis on safe, no risk)

Put away your credit card…everything on this website is free

Over 8,000 singles online now…making more connections everyday

Age 18–38 – Others are involved

Over 8,000 singles online now…making more connections everyday

Age 39–52 – Free, others are involved, the system has a number of assurances of ‘performance’

Put away your credit card…everything on this website is free

Has more dates, more relationships and more visits than any other online dating website

Over 8,000 singles online now…making more connections everyday

Partnership with Match.com to increase our services to you

Age 53+ – Privacy, assurance of ‘performance’

Free personality test…matches you with more singles in your area

For singles concerned with privacy, rest assured contact details are never published

Linking Emlinking Emotions To Elements

An emerging topic of interest over the past decade has been the way emotions come into play when a person reads something or does something, the idea of affect as an accompanying feature of behavior. Often it is difficult to pinpoint the precise emotion, since there are hundreds of words which describe one or another feeling, emotion, disposition. The nomenclature of emotion makes it very difficult to select a set of words, although if a limited set is not chosen, the task becomes virtually impossible.

A parenthetical note: The same issue, description of the qualitative aspect of emotion, can be said to describe the state of our approach to the description of odor and a lesser issue but a problem nonetheless for the description of texture. The issue in emotion, olfaction, and texture, is simply the fact that there are no agreed-upon primaries, and the subjective richness of the emotion, the smell, and the touch can be simply overwhelming.

We recognized this problem, and selected five different emotions, two negative (uncertain, intimidated), one intermediate (disinterested), and two positive (curious, eager.) The emotions were not mean to describe a continuum, but simply designed to capture a variety of feelings, positive, negative, and a variety of actions (information-seeking; approach-avoidance.)

After the respondent rated the vignette on the overall evaluative criterion of ‘join,’ the respondent was instructed to rate how she or he felt when reading the vignette. The five selections became five new dependent variables. When a specific emotion or feeling was selected (e.g., uncertain) the newly created variable corresponding to that emotion was assigned the value of 100. The remaining four newly created variables were assigned the rating of 0.A small random number was added to each newly created rating.

The coefficients for the five newly created variables were estimated, this time again using OLS regression, but without an additive constant.

Table 3, 4 presents the linkages between the 36 elements and the nature of the feeling (both positives, neutral, both negatives, and then the four specific feelings).For the positive, disinterest (neutral) and negative feelings, we show the strongest linkages, shading those of 15 or higher. For the remaining four feelings (uncertain, intimidated, curious, eager) we shade those linkages of 11 or higher. A linkage of 10 is highly statistically significant in the OLS regression model

Table 3. Linkage between the 36 elements and the positive, neutral (disinterest) and negative feelings, as well as the four specific feelings

General Feelings

Specific Feelings


Positive

Disinterest

Negative

Uncertain

Intimidated

Curious

Eager

D4

Make yourself invisible with our one-of-a-kind privacy settings

16

2

8

8

8

6

2

C3

Find G-d’s match for you

8

22

-2

3

5

-2

0

F5

Pay as you go…no contract necessary

9

16

2

6

3

3

-1

F6

Put away your credit card…everything on this website is free

-1

1

26

-1

0

16

10

F1

Free personality test…matches you with more singles in your area

6

3

18

5

1

15

3

C1

Date smarter, not harder

7

2

18

7

0

15

3

C6

Our online dating site and dating service is modern, professional and user-friendly

5

4

17

6

-1

17

0

C2

One-of-a-kind questionnaire to dig deeper to uncover your attitudes, beliefs and personality

10

2

17

7

3

14

3

A6

Receive matches by e-mail, free

7

6

15

7

0

14

1

C4

A fun, unique way to meet people

6

6

15

4

2

13

2

B6

In the USA, 1 out of every couple found their spouse online

13

8

6

9

4

5

1

B2

Has more dates, more relationships and more visits than any other online dating website

13

4

11

9

4

10

1

D5

For singles concerned with privacy, rest assured contact details are never published

13

4

9

6

7

6

3

F2

Online dating for the cost of a single date

12

13

2

10

2

3

-1

D3

Your information is stored in our database for historical and legal purposes only

12

10

4

7

5

3

1

B4

Over 8,000 singles online now…making more connections everyday

12

4

12

11

1

8

4

B3

Over 1 million conversations per day, with 30,000 new singles everyday

12

4

10

7

5

10

0

D1

Number one most trusted online dating website

12

1

12

8

4

12

0

A1

Easy login… with Facebook

11

8

7

9

2

3

4

D2

100% invitation only…to better protect your privacy

11

8

6

5

6

5

1

A2

Online dating made easy

11

5

12

7

4

11

1

E1

Oldest online dating website

11

2

11

9

2

10

1

E2

Use our respectable matching system

10

5

8

6

4

7

1

E6

Our website gives more meaning to ‘we are family’ than any other

6

13

4

2

4

3

1

E4

Partnership with Match.com to increase our services to you

4

11

11

3

1

8

3

B1

We are the best predictors of happy and long-lasting relationships

6

10

11

5

1

11

0

C5

Start finding all of the Mr. and Ms’ Rights you can handle

8

10

9

7

1

7

2

F4

No credit card required

4

9

14

4

0

8

6

A5

Fast efficient match making tools

8

6

14

7

1

10

4

E5

No other website offers relationship expertise of someone like Dr. Phil or professional match making services

3

6

14

0

3

10

4

B5

Debbie from New York says, “I never thought I would use a dating website… but that is how I met my husband, Paul”

9

6

13

7

2

12

1

D6

Ranked in 2011 as McAfee’s most secure dating website

7

6

13

2

5

11

2

A3

Meet singles all around the world

8

7

12

5

3

9

3

F3

Free trial for your first three months

8

7

12

7

1

8

4

E3

Personal match maker working with you

6

6

12

3

3

9

3

A4

Registration is fast and effortless

9

9

9

7

2

7

2

Table 4. Performance of the elements by the two mind-sets

Mind-Set 1

Mind-Set 2

Base Size

37

15

Additive constant

21

22

Mind-Set 1: Lots of people, easy and free

B4

Over 8,000 singles online now…making more connections everyday

18

-3

F6

Put away your credit card…everything on this website is free

17

6

B3

Over 1 million conversations per day, with 30,000 new singles everyday

14

-4

A6

Receive matches by e-mail, free

13

-1

B1

We are the best predictors of happy and long-lasting relationships

13

-5

F1

Free personality test…matches you with more singles in your area

13

12

B2

Has more dates, more relationships and more visits than any other online dating website

12

-6

A2

Online dating made easy

11

6

A5

Fast efficient match making tools

10

-15

A4

Registration is fast and effortless

9

-3

F4

No credit card required

9

4

B5

Debbie from New York says, “I never thought I would use a dating website… but that is how I met my husband, Paul”

8

0

E4

Partnership with Match.com to increase our services to you

8

4

Mind-Set 2 – Serious dater

C3

Find G-d’s match for you

-5

22

D1

Number one most trusted online dating website

4

11

E3

Personal match maker working with you

4

11

C2

One-of-a-kind questionnaire to dig deeper to uncover your attitudes, beliefs and personality

6

10

E5

No other website offers relationship expertise of someone like Dr.Phil or professional match making services

4

8

Does not drive a respondent to join

E1

Oldest online dating website

-4

7

F2

Online dating for the cost of a single date

-4

4

D5

For singles concerned with privacy, rest assured contact details are never published

7

2

F3

Free trial for your first three months

-3

2

C6

Our online dating site and dating service is modern, professional and user-friendly

3

1

E2

Use our respectable matching system

-4

0

A3

Meet singles all around the world

6

-3

C1

Date smarter, not harder

5

-3

B6

In the USA, 1 out of every couple found their spouse online

7

-4

C4

A fun, unique way to meet people

7

-5

E6

Our website gives more meaning to ‘we are family’ than any other

-2

-5

F5

Pay as you go…no contract necessary

-8

-6

D2

100% invitation only…to better protect your privacy

-3

-7

D4

Make yourself invisible with our one-of-a-kind privacy settings

5

-8

D6

Ranked in 2011 as McAfee’s most secure dating website

6

-9

D3

Your information is stored in our database for historical and legal purposes only

-7

-9

C5

Start finding all of the Mr. and Ms’ Rights you can handle

2

-10

A1

Easy login… with Facebook

6

-22

Table 3 tells us that the majority of strong emotional linkages to these elements are either disinterest or negative. Although there are some elements which may drive an individual to say that she or he will ‘join’ the dating site, there is very little ‘massive’ positive reaction. What positive reactions occur can be traced more to curiosity than to eagerness

Discovering Mind-Sets In The Population

Underlying the Mind Genomics effort is the belief that for any specific topic where decisions are made, people exhibit a range of criteria, or ‘mind-sets.’ The effort may be very broad such as what interests an individual in an organization, or very narrow, such as the topic of joining a data site, or even a narrower aspect of the topic, such as how to pay for the site, and so forth. The key is being able to ask questions, provide relevant answers, and execute the study among the relevant respondents. The topic of ‘relevant’ is an entirely separate issue, and may be limited to individuals who are single (for a data site), individuals who have used a dating site, or even individuals who have used a specific dating site. On the other hand, the relevant respondent may be just about anyone.

In the world of genomics, we deal with a gene, and alternative versions of the same gene, alleles. The comparison to Mind Genomics is metaphoric. Whether the respondents are from a specific group or from a general population, they nonetheless often divide into groups with different points of view, so-called mind-sets, mental genomes. The experiment we have just run in the above-discussed results provide us with the tools to isolate mental alleles, mental variations of the same ‘gene,’ the gene being the ways one thinks about joining to a dating site.

Discovering mind-sets in the population of respondents combines objective statistics and subjective interpretation. Each respondent generated a model relating the presence/absence of the elements to the binary value of 0/100 (0 when the original rating was 1–6, 100 when the original rating was 7–9). The binary-transformed ratings were then used as the dependent variable and related to the presence/absence of elements. The coefficients (but not the additive constant) were used as inputs to a k-means clustering program (Jubes& Jain, 1980). The program divided the respondents into two groups (clusters, mind-sets), and then again into three groups. The criteria for dividing the respondents was mathematical in nature. The selection of the clusters, two or three, was based upon a simple pair of criteria, parsimony (fewer clusters are better than more clusters), and interpretability (the clusters must ‘tell a coherent story.’)

For these results, it was easy to interpret the two-cluster solution, suggesting two radically different mind-sets. Table 3 shows the coefficients for the two mind-sets. Both start with low additive constants, 21 and 22, respectively, suggesting that in the absence of the elements about one-fifth of the time the rating will be 7–9. This means that it is the task of the elements to drive ‘join.’ In neither mind-set are people ready to join.

The richness of the elements in terms of what they convey, how they represent the way a person feels, and the simplicity of the pattern reflects the nature of Mind Genomics. Rather than extracting a pattern from points, and thus forcing oneself to see order in possible chaos, Mind Genomics extracts a pattern from phrases which themselves are meaningful. One need not even ‘name’ the mind-sets to understand the results. Just knowing the high-scoring elements may often suffice, although it is in the nature of researchers to label groups, if only as a aide-memoire.

Mind-Set 1 responds to ‘make it easy and free.’

Over 8,000 singles online now…making more connections everyday

Put away your credit card…everything on this website is free

Mind-Set 2 is a ‘serious dater’

Find G-d’s match for you

Establishing The Consistency of The Ratings From Individual Respondents

The question is often asked whether the respondents in these Mind Genomics studies are serious in their participation, or whether they just answer at random. As of this writing (Summer, 2019) the issue of survey fraud, especially with online studies, has come to the fore as a major topic, especially because survey fraud can be committed with ‘bots’ programmed to answer surveys as if the bots were legitimate respondents.

One way to determine whether or not the respondents were actually focused on doing the project uses a measure of ‘goodness of fit’ of the equation to the data, the multiple R-square. The individual-level regression model, so-called curve-fitting model, OLS (ordinary least-squares) regression, may or may not ‘fit the data. ’When the regression model fits the data, the R-squared is high. The R-square ranges from a high of 1.00 when the regression model fits the data perfectly, to a low of 0.0 when the regression model essentially fails entirely, and is simple a ‘best fit’ but is really irrelevant,

Figure 4 shows the distribution of R-square values for the respondents, each respondent generating a single value from the model generated by her or his ratings, versus the presence/absence of the elements. R-square values of 0.25 or higher (R>0.5) suggest that the respondent is taking the study seriously. Figure 4 shows that most respondents generate reasonably high R-square statistics for their individual models.

Mind Genomics-025 - ASMHS Journal_F4

Figure 4. Distribution of R-square values by mind-set, for the individual models relating of question 1 (‘Join’) vs the presence/absence of the 36 elements

Finding Segments In The Population

It is easy to classify people by who they ARE or what they DO. These classifications can be quickly obtained from many commercial sources. Once can also define a person by one of the many different classification schemes such as PRIZM® by Claritas, Inc. in San Diego, CA. What is almost impossible, however, is to identify the likely membership in a mind-set that is relevant to a specific, local issue such as dating. How can one assign a new person to Mind-Set 1 or Mind-Set 2 for a dating site?

Recent developments by author Gere have evolved into a method which assigns new individuals to the two mind-sets, using a simple algorithm. The approach, PVI (personal viewpoint identifier), is a simplified algorithm, taken in part from the more powerful method of discriminant function analysis [11] DFA requires the raw data, whereas the PVI uses the average data to identify a set of questions, which best differentiate among the different mind-sets. The PVI is a Monte-Carlo process, which adds ‘noise’ to the coefficients to simulate ordinary variation, and identifies the best set of questions and the pattern of answers. The output of the process is the set of questions (usually six), each with two answers, and thus 64 possible patterns of answers. The pattern of answers defines mind-set membership.

Figure 5 shows the PVI. Once the respondent participates in the PVI, the program automatically assigns the respondent to a mind-set, and stores the data. The PVI can be programmed to send feedback to the respondent based upon the pattern of responses, and the mind two which the participant in the PVI is assigned.

Mind Genomics-025 - ASMHS Journal_F5

Figure 5. The PVI (personal viewpoint identifier) for the dating site

Discussion And Conclusions

The sheer volume of interest in dating sites drive researchers to focus on the site as a way to understand the motives of people, their feelings, and their behavior. In turn, business people recognize the great deal of money to be made from these dating sites because those who are on the sites are there for emotional reasons, whether sincere or feigned, whether looking for connection or for something else.

Mind Genomics brings a different focus to the issue of dating sites. The sites are interesting as a product that can be designed, as well as a micro-topic of everyday life which is of great interest to people in the world of always-connected, and the ubiquitous Internet. The consequence of a new world of interconnections through technology, and increasing social isolation of people because of the advances in technology which have destroyed the tight-knit local communities, make a perfect matrix of research opportunities for Mind Genomics to look at various aspects of dating sites. This first study looks at the site as a business opportunity, using research questions and probes typically encountered in the development of products in the world of commerce. Further studies might well focus on issues of emotionality when the site is used. These further studies would represent the application of Mind Genomics to more traditional aspects of dating sites, the aspects looked at by sociologists and psychologists.

Acknowledgement

Attila Gere wishes to acknowledge and thank the Premium Postdoctoral Research Program of the Hungarian Academy of Sciences

References

  1. Finkel EJ, Eastwick PW, Sprecher S (2012) Online Dating: A Critical Analysis from the Perspective of Psychological Science. Psychological science in the public interest
  2. Blackhart GC, Fitzpatrick J, Williamson (2014) Dispositional factors predicting use of online dating sites and behaviors related to online dating. In: Computers in Human Behavior Elsevier.
  3. Kim M, Kwon KN, Lee (2009) Psychological characteristics of Internet dating service users: The effect of self-esteem, involvement, and sociability on the use of Internet dating services. CyberPsychology&Behavior 12: 445–449.
  4. Sautter JM, Tippett  RM, Morgan SP (2010) The social demography of Internet dating in the United States. Social Science Quarterly 91: 554–575.
  5. Stevens SB, Morris TL (2007) College dating and social anxiety: Using the Internet as a means of connecting to others. CyberPsychology&Behavior 10: 680–688.
  6. Valkenburg PM, Peter J (2007) Who visits online dating sites? Exploring some characteristics of online daters. CyberPsychology&Behavior 10: 849–852.
  7. Moskowitz HR, Gofman A, Beckley J, Ashman H (2006) Founding a new science: Mind genomics. Journal of sensory studies 21: 266–307.
  8. Moskowitz HR, Gofman A (2007) Selling blue elephants: How to make great products that people want before they even know they want them. Pearson Education.
  9. Box GE, Hunter WG, Hunter JS (1978) Statistics for experimenters  New York, John Wiley
  10. Kahneman  D,  Egan P (2011) Thinking, fast and slow. New York: Farrar Straus and Giroux.
  11. Crask MR, PerreaultJr WD (1977) Validation of discriminant analysis in marketing research. Journal of Marketing Research 14: 60–68.

Messages about Diabetes: A Mind Genomics Exploration of Communicating for Medicine & Public Health

Abstract

Awareness to risks of type II diabetes, the epidemic of the 21st century, is low. We present an investigation into the messages about diabetes which resonate with respondents. The approach uses experimentally designed combinations of messages, unique for each respondent, with the property that the messages appear in a way that prevents the respondent from ‘gaming’ the experiment. Each respondent generates a unique pattern of coefficients for both important of messages, and response time to messages. The study suggests three mind-sets (Focus on the sufferer alone; The doctor is the source of knowledge; Focus on management with the help of others.) We present the PVI, personal viewpoint identifier, allowing the researcher to identify the appropriate convincing message for each respondent, who is first assigned to one of the three mind-sets by the PVI. The Mind Genomics study provides the health community with an easy-to-use system for understanding and deploying convincing messages in health-relevant situations, and may serve as an ongoing, working tool, for health maintenance among the general population.

Introduction

One only needs to open any medical journal to read about the medical issues involved in one or another aspect of diabetes. The popular press, and especially the web, are filled with stories about the issues of diabetes, the newspapers filled with latest information about specific issues involved with diabetes as a looming disaster for society, the magazines filled with stories about personal encounters with diabetes, and to those on the web innumerable advertisements about what to do and what not to do to forestall diabetes.  The sheer popularity of diabetes as an issue of discussion is witness to the growing recognition of this developing scourge of society. Type II diabetes has been recognized as a global epidemic of the 21st   century [1]. Diabetes is the seventh leading cause of death and disability worldwide [2]. Disability resulting from diabetes has grown substantially between 1990 to 2013 particularly among ages 15–69 years; age-standardized prevalence among adult men doubled from 4.3% to 9% and age-standardized prevalence among adult women increased by 60% from 5% to 8% [3]. People suffering from diabetes are at risk of developing a range of complications endangering their health, functionality and survival. Diabetes has increased across countries [4]. In 2013, 382 million people in 130 countries had diabetes [5]. It is estimated that by 2030 the number of people with Diabetes will rise to 552 million by 2030, and that by 2035 the number of people with diabetes will rise to 592 million (5–7). Despite these concerning data, only a few countries, mostly in Western Europe, seem to have a chance of halting the rise in diabetes by 2030 [4].

Health expenditures associated with diabetes create an economic burden [8]. Epidemiological and economic data for 184 countries suggest that direct global costs accounted for $1.31 trillion, based on WHO’s general health expenditure figures and data from the 2015 [9]. Furthermore, indirect costs of premature mortality and comorbidity due to diabetes accounted for 35% of the total burden with America being the largest contributor to global costs of diabetes [10].

Type II diabetes is caused by factors such as obesity, sedentary lifestyle, diet, smoking, physical and emotional stress which are modifiable [11,12]. Interventions to target modifiable risk factors can prevent or delay the onset of diabetes, but awareness of risks of diabetes is low [10]. The human suffering in diabetes and the economic burden of diabetes on health systems of every country, make diabetes an urgent matter to combat the disease [4].

Education, and especially effective communication, are critical. When people can be effectively educated about the risk and the modifiable factors that can be changed, there is the possibility that the effects of Diabetes can be reduced. One consequence of education is that those individuals who perceive themselves to be at risk of diabetes may be more conscious about what to do, and more likely to follow up on efforts which reduce their risk of developing diabetes [8].

Sadly, little attention was paid to creating effective messages which raise the awareness diabetes risks [1,12]. To be sensitive and effective, messages about risk awareness need proper shaping through framing, narrative impact or visual imagery [11]. These messages should acknowledge the role of individuals in adopting healthy behaviors, and consciously avoid activating negative stereotypes or arousing anger at the message source [13]. Effective messaging will enable health professionals and health policy makers to identify and to use the most effective message for each person in the population by mind-set segments of the sample. How do we understand the mind, and enhance risk awareness effectively?

Formal statistics provide no sense of how people ‘feel’, and to what people ‘react’. Softer yet quantitative methods provide other points of view. Mind-Genomics is an approach best described a ‘cartography of the mind’ which studies responses to different aspects of daily life experience [14–16]. Mind-Genomics maps an experience, identifies its different facets, determines to what facets the person attends, and how important each facet is for each person [14,17–22] By dealing with responses to elements of everyday experience, as they are reacted to by people, Mind-Genomics reveals how people react to the specifics of experience, looking at the nuances, and thus taking into account the richness of experience. Mind-Genomics is an empirical science, mapping aspects of experience by importance, and segmenting different groups of people by their different viewpoints, so-called mind-sets. This Mind-Genomics study identifies effective messaging to raise awareness to risk of diabetes, looking at the general population by the different mind-sets, and what will work (as well as what will fail) for each mind-set.

At the very practical level, in both the medical and non-medical worlds, what does one say to alert the population to the potential problems of diabetes? What does one say to direct people to the proper behaviors, and encourage them, in order to forestall diabetes?  And, if one puts the current messaging to the test, do the content of today’s messages strike a resonant chord in the mind of the average consumer?  Must we frighten people into a better lifestyle? [23–26].

Finally, as part of this introduction, can we identify different types of people, responding to various messages. We know from the popular press that there is a plethora of choice and the corresponding paradox of choice [27]. In the world of food, for example, we now know both from science and from the marketplace that people have different preferences for products, and will gravitate to what they like, rejecting what they dislike.  Prego, for example, is just such a phenomenon, of a product once appearing in one SKU (shop-keeping unit), but now proliferating into more than a dozen, with varieties coming in and out of the market every year. Do we have the same distribution of preferences, not for a physical food product, but rather for a message, such as the type of message to warn us about diabetes?

Method

The approach used is known as Mind Genomics, a form of experimental design in which messages are combined into short, easy-to-read vignettes, such as that shown in Figure 1 for this study. The messages are developed by a Socratic method of choosing a topic, asking four related questions which ‘tell a story,’ providing four answers to each question, and testing combinations of these answers. Mind Genomics, based upon the statistical rigor of experimental design [28] combined with simple testing of combinations by the web, creates a method which is fast, easy, affordable, iterative, and scalable.  The objective is to work with small, cost-effective groups of respondents, members of a large on-line panel, and explore different messages in an iterative fashion, to discover what ‘works’, to discover possibly ‘new-to-the-world’ mind-sets, and when possible iterate rapidly across a series of studies to fine tune messages [14,29,30.]

Mind Genomics-022 EDMJ Journal_F1

Figure 1. Example of a vignette for the diabetes study

The methods of Mind Genomics enjoy a long history. Psychologists and marketers have known for decades that the everyday experience of people is not easily uncovered by the conventional scientific method of isolate and then study. For some phenomenon, such isolation works very well to help the researcher understand the phenomenon. The everyday experience of people, the world of normal behavior where diabetes is a relevant issue, cannot be easily understood by isolating variables in a clinical way. Rather, it is important to simulate the compound and complex nature of experience, where an individual is presented with many stimuli of different types, all competing for attention.  To this end, experimental design of ideas was promoted by pioneer researchers in the world of marketing, Professors Paul Green and Jerry Wind, at the Wharton School of the University of Pennsylvania [31,32]  It is their pioneering which has stimulated the research in this paper, albeit the topic has changed from issues in marketing to issues in public health, namely diabetes.

It is important to keep in mind that Mind Genomics studies do not purport to be the ultimate in terms of what works in communication of a topic. Rather, each Mind Genomics study provides a wealth of information in and of itself, as well as a platform both for archiving scientific information, and as a jumping-off point for additional improvement. Mind Genomics thus differs from the conventional A/B tests of communication, now prevalent on the web to ‘optimize’ messaging. Mind Genomics provides structured information, not just a comparison of performance.

The process and the results

We illustrate the approach to diabetes with a small study of 50 respondents, run in March 2019. The objective of the study was to institute a new set of studies on the way to message to the public on topics of increasing importance, yet topics whose criticality has not been sufficiently established in the public’s mind. Diabetes is one of these issues, a disease which promises to become an economic scourge in the years to come.   Similar looming problems are opioid use leading to addiction, and eating patterns leading to obesity and illness.

We can best understand the issue of diabetes by following the structured approach imposed by Mind Genomics. The underlying notion is that these studies must be easy to design and implement, must produce fast results, must be very affordable, and must generate a way to implement the key findings (e.g., finding Mind-Sets in the population, responsive to different types of messages.)  The power of Mind Genomics lies both in the requirement is imposes for the researcher to ‘think’ in a structured manner, and to return with powerful data that can be acted upon quickly. Mind Genomics is thus a technology of today, the ‘push button age,’ where thinking has become superficial, where solutions are vital, where communication is the driver of change, and where iteration, redoing and correcting, is the evolving way to create products and services [33]

  1. Identify the problem, create questions, provide answers. Mind Genomics traces some of its intellectual history to the world of Socratic thinking.  When exploring a topic, Mind Genomics begins by forcing the researcher to think about four questions that can be related to each, questions which ‘tell a story.’ This step is not as easy as one might surmise. Asking a series of questions which tell a story requires the researcher to conceptualize the problem of just what is the ‘story’ behind diabetes.  Table 1 shows a set of four questions, not necessarily the only questions that could be asked.  Underneath each question are four answers. The answers are phrased in the language of ordinary people, simple, and at a level promoting ‘fast reading’ and even ‘information grazing’ as will be discussed below. This is so-called System 1 thinking, the fast, intuitive way that we think when we deal with the world of the everyday [34]. As a side note, it should be kept in mind that the respondent never sees the questions. The only material that the respondent will ever see are the answers, to be combined in a systematic way, discussed below.

    Table 1. The four questions and the four answers to each question for the diabetes study

    Question 1 – What is the risk?

    A1

     By living longer there is a greater chance of suffering from diabetes

    A2

    Diabetes is dangerous without treatment

    A3

     Diet and exercise are key to diabetes prevention

    A4

    Diabetes is the most profound disease of this century

    Question 2 – What are the healthcare needs?

    B1

     It’s OK to self-manage diabetes

    B2

     People with diabetes use a lot of health services

    B3

     Frequent doctor visits help adherence to diabetes treatment

    B4

    Diabetes requires a lot of medications

    Question 3 – What education is expected?

    C1

     It’s a doctor’s role to educate patients about diabetes

    C2

     The internet is all you need to learn about diabetes

    C3

     A doctor should refer patients to educational materials about diabetes

    C4

     A patient should know all the possible treatments of diabetes

    Question 4 – What role does the support of others play?

    D1

     Family support is important to manage diabetes

    D2

     Learning how others cope with diabetes is beneficial

    D3

     Participation in workshops for patients helps manage diabetes

    D4

     Belonging to a community of patients helps support others with diabetes

  2. Create the basic experimental design and permute it.  The underlying experimental design works with the four sets of four answers (four per question), creating a set of 24 vignettes. Each vignette comprises at most one element from each question. Many vignettes, however, are incomplete, missing either answer from one question (3-element vignette) or an answer from each of two questions (2-element vignette.)  Each element appears equally often in the set of 24 vignettes. The underlying experimental design used to construct the vignettes ensures that the 16 elements or answers appear in a statistically independent fashion, allowing the ratings to be ‘deconstructed’ by statistical methods (regression) into the separate contributions of the elements. Finally, each respondent evaluated a unique set of 24 vignettes, but the underlying structure was maintained, so that the mathematical rigor of the design could be used to create valid regression models [35]

    Table 2 shows the structure for five vignettes from one respondent, #27, male, age 31, who is defined by age as being in the younger of the two groups, and who classifies himself as being moderately concerned about diabetes. This will be the only private information needed for the respondent, and indeed even this information about WHO the respondent IS, or WHAT the respondent THINKS will not be necessary for the analysis.

    Table 2. Five vignettes from the experimental design for one respondent. The table shows the information about the respondent, the structure of the five vignettes, the binary expansion of the 16 elements, the ratings, response time, and binary-transformed ratings

    Vig#1

    Vig#2

    Vig#3

    Vig#4

    Vig#5

    Respondent #27; Male, Age 31, Younger group, Moderately concerned about diabetes

    Design

    Question A:

    Answer A4

    Absent

    Answer A4

    Answer A2

    Answer A2

    Question B:

    Absent

    Answer B2

    Answer B2

    Answer B1

    Answer B4

    Question C:

    Answer C2

    Answer C1

    Answer C1

    Absent

    Answer C4

    Question D:

    Answer D4

    Answer D1

    Answer D2

    Answer D1

    Answer D4

    Binary Expansion of Design

    A1

    0

    0

    0

    0

    0

    A2

    0

    0

    0

    1

    1

    A3

    0

    0

    0

    0

    0

    A4

    1

    0

    1

    0

    0

    B1

    0

    0

    0

    1

    0

    B2

    0

    1

    1

    0

    0

    B3

    0

    0

    0

    0

    0

    B4

    0

    0

    0

    0

    1

    C1

    0

    1

    1

    0

    0

    C2

    1

    0

    0

    0

    0

    C3

    0

    0

    0

    0

    0

    C4

    0

    0

    0

    0

    1

    D1

    0

    1

    0

    1

    0

    D2

    0

    0

    1

    0

    0

    D3

    0

    0

    0

    0

    0

    D4

    1

    0

    0

    0

    1

    Dependent variables

    Rating on 9-point scale

    4

    7

    6

    5

    3

    Response Time (Sec)

    5.3

    2.9

    4.6

    5.5

    4.8

    Binary transformed rating

    Top3

    0

    100

    0

    0

    0

    Bot3

    0

    0

    0

    0

    100

    Below the experimental design, described in words, is the same set of 16 elements, this time representing the elements as 16 variables, each variable taking on the value ‘0’ when the element is absent from the vignette, and taking on the value ‘1’ when the element is present in the vignette. The element is coded 0/1 because the analysis will tell us how much the element contributes to the response. This form of coding is known as ‘dummy variable’ because the element, i.e., the answer, does not carry any intrinsic numerical information that we want to use as a predictor. It is simply the element itself, without the ‘meaning of the element.’ Later, after the analysis, we will look for meaning.

    Beneath the binary variables are two sets of two dependent variables each. The first dependent variable is the rating of the vignette on the anchored 9-point scale. The second dependent variable is the response time to the vignette in seconds. The third dependent variable is the transformed rating ‘Top3,’ with ratings of 1–6 transformed to 0 and ratings of 7–9 transformed to 100. This is the so-called Top 3 Box, and shows the response transformed to study how the messages drive ‘important.’  The fourth dependent variable is ‘Bot 3’ with ratings 1–3 transformed to 100, and ratings of 4–9 transformed to 0. This is the so-called Bottom 3 Box, and shows the response transformed to study how the messages drive ‘irrelevant’ (or extremely unimportant.)

  3. Execute the study. We worked with a panel provider, Luci.id. The respondents were part of the Luc.id panel of several millions of respondents. Respondents were recruited to participateand compensated by the sample provider. Working with a sample provider specializing in these types of studies creates the possibility that the study can be executed and analyzed (at a superficial level) in a period of one-two days.

    The respondents who agree to participate were told to click on a link embedded in their email. The first screen required the respondents to profile themselves (age, gender, concern with diabetes.) The second screen introduced the study. The third screen (Figure 1) presented the first of the 24 systematically created vignettes. The entire process took approximately four minutes.  Figure 1 shows an example of the vignette:

  4. Run the regression model for the total panel: Relate the presence/absence of the 16 elements to the ratings (important = Top3; irrelevant = Bot3) using OLS (ordinary least-squares) regression. OLS provides an easy way to deconstruct the response to the vignettes into the contributions of the elements, and a predisposition (additive constant). Table 3A presents the parameters of the OLS regression run twice, first when the dependent variable was defined as Top3 (Ratings 1–6 → 0, Ratings 7–9 → 100) and Bot3 (Ratings 1–3 → 100, Ratings 4–9 → 0). The two transformations give a sense of what is really important and what is really irrelevant. Not important may or may be irrelevant.  Similarly, not irrelevant may or may not be important.

    Table 3A. Parameters of the regression models for Top3 (important) and Bot3 (irrelevant). Data from the total panel

    Top3 – Important

    Bot3 – Irrelevant

    Coeff

    T-Stat

    P-Val

    Coeff

    T-Stat

    P-Val


     Additive constant

    58.80

    7.70

    0.00

    5.74

    1.38

    0.17

    A3

    Diet and exercise are key to diabetes prevention

    8.16

    1.75

    0.08

    -4.57

    -1.80

    0.07

    A2

    Diabetes is dangerous without treatment

    6.86

    1.48

    0.14

    -3.28

    -1.29

    0.20

    D1

    Family support is important to manage diabetes

    5.25

    1.13

    0.26

    -2.88

    -1.13

    0.26

    B3

    Frequent doctor visits help adherence to diabetes treatment

    3.96

    0.85

    0.40

    0.37

    0.15

    0.88

    D2

    Learning how others cope with diabetes is beneficial

    2.55

    0.55

    0.58

    -2.99

    -1.19

    0.23

    D3

    Participation in workshops for patients helps manage diabetes

    2.43

    0.53

    0.60

    -4.77

    -1.89

    0.06

    D4

    Belonging to a community of patients helps support others with diabetes

    0.87

    0.19

    0.85

    -2.91

    -1.15

    0.25

    C4

    A patient should know all the possible treatments of diabetes

    0.17

    0.04

    0.97

    -0.66

    -0.26

    0.80

    B2

    People with diabetes use a lot of health services

    -2.62

    -0.56

    0.57

    2.37

    0.93

    0.35

    A4

    Diabetes is the most profound disease of this century

    -2.93

    -0.63

    0.53

    1.28

    0.51

    0.61

    C3

    A doctor should refer patients to educational materials about diabetes

    -2.94

    -0.63

    0.53

    3.30

    1.29

    0.20

    C1

    It’s a doctor’s role to educate patients about diabetes

    -4.13

    -0.88

    0.38

    0.90

    0.35

    0.73

    B4

    Diabetes requires a lot of medications

    -4.83

    -1.03

    0.30

    2.86

    1.12

    0.26

    A1

    By living longer there is a greater chance of suffering from Diabetes

    -9.33

    -2.00

    0.05

    1.11

    0.44

    0.66

    B1

    It’s OK to self-manage diabetes

    -17.27

    -3.65

    0.00

    9.01

    3.49

    0.00

    C2

    The internet is all you need to learn about diabetes

    -25.63

    -5.53

    0.00

    10.90

    4.31

    0.00

    1. Table 3A show three parameters from the OLS regression. The first is the coefficient, which is the probability that the vignette will receive a rating of 7–9 when the element is in the vignette (Top3) or that the vignette will receive a rating of 1–3 when the element is in the vignette (Bot 3).
    2. The second parameter is the T-statistic, a measure of signal to noise. The idea T value is as high as possible. The T statistic shows the magnitude of the coefficient divided by the expected variation of the coefficient. The higher the T statistic, the more likely it is that we are seeing a ‘real signal,’ and not just random fluctuation.
    3. The third parameter is the P-Value, the probability that the coefficient is really 0, and what we are seeing is some random deviation, but with a real value of 0.  The P value is inversely to the absolutely magnitude of the T statistic, which makes sense. The higher the signal/noise ratio, the more likely we have a real signal, and the lower is the P value.  P is simple the probability that are seeing the results of random fluctuation.

    The analysis is based on the fitted linear equation: Response = k0 + k1(A1) + k2(A2) … k16(D4)

    1. The additive constant indicates the probability that the rating will be assigned either a 7–9 in the absence of elements (Important; Top3) or a 1–3 in the absence of elements (Irrelevant: Bot3). Table 3A shows quite clearly that the respondents take the messaging seriously. The additive constant is 58.80, meaning that in the absence of elements (a purely hypothetical situation), we should expect 58.8, i.e., almost 60% of the responses to be ‘important.’ In contrast, the additive constant for Bot3 (irrelevant) is 5.74, meaning that only 6% of the responses are expected to be ‘irrelevant.’ The respondents treat the information as serious
    2. The most important elements are A3 (Diet and exercise are key to diabetes prevention) and A2 (Diabetes is dangerous without treatment.) These are the phrases to which people react most strongly.
    3. The most irrelevant elements are B1 (It’s OK to self-manage diabetes) and C2 (The internet is all you need to learn about diabetes).
  5. Run the regression model for key self-defined subgroups: For the total panel, it comes as a surprise that only two elements are deemed to be very important for the total panel (A3, A2), and only two elements are deemed to very irrelevant for the total panel (B1,C2). The remaining elements are generally modest in their importance. Such poor performance may stem either from the possible reality that today’s messages are simply not strongly relevant, or perhaps that there exist groups in the population responding to different messages. The results from the total panel do not show these groups. They must either identify themselves directly or be uncovered through statistical means.

The Mind Genomics experiment required the respondent to provide information about gender and age, respectively, as well as about degree of concern with diabetes.  The ages were divided into three ranges, following a hypothesis that there are certain general stages in a person’s life

Table 3B presents the coefficients for the Top3 model (importance) by total, gender, age, all self-defined groups, and by two groups of mind-sets, those extracted from two segments, and those extracted from three segments, respectively. The strong performing elements are shown as shaded cells with told numbers. The definition of a strong performing element is a coefficient of +7.51 or higher, rounded to a +8

Table 3B. Performance of all elements by self-defined subgroups and emergent mind-sets

Coefficients from equations relating the presence/absence of the elements to the rating of important (Top3)

Total

Male

Female

Age 13–34

Age 35–54

Age 55+

Mind-Set 2A – Focus on management with the help of others

Mind-Set 2B – Focus on the sufferer alone

Mind-Set 3C – Focus on the sufferer alone

Mind-Set 3D– The doctor is the source of knowledge

Mind-Set 3E – Focus on management with the help of others

Base size

50

25

25

25

12

12

28

22

18

13

19

Additive constant

59

73

44

61

62

48

66

53

62

43

67

A1

By living longer there is a greater chance of suffering from Diabetes

-9

-11

-6

-11

-2

-10

-9

-10

1

-5

-20

A2

Diabetes is dangerous without treatment

7

8

7

3

12

12

4

9

14

8

-1

A3

Diet and exercise are key to diabetes prevention

8

8

10

2

18

14

10

6

17

4

3

A4

Diabetes is the most profound disease of this century

-3

-5

1

-8

-1

6

-6

0

4

0

-10

B1

It’s OK to self- manage the Diabetes

-17

-15

-18

-14

-5

-33

-11

-26

-14

-27

-13

B2

People with diabetes use a lot of health services

-3

-5

0

-1

0

-9

-2

-8

-4

-13

2

B3

Frequent doctor visits help adherence to diabetes treatment

4

2

7

4

0

7

8

-4

4

-8

11

B4

Diabetes requires a lot of medications

-5

-5

-3

-6

0

-4

-2

-12

5

-22

-4

C1

It’s a doctor’s role to educate patients about diabetes

-4

-6

-2

-8

-6

3

-14

7

-13

16

-9

C2

The internet is all you need to learn about diabetes

-26

-30

-22

-27

-20

-32

-38

-13

-24

-4

-42

C3

A doctor should refer patients to educational materials about diabetes

-3

-11

5

-8

-2

4

-12

7

-13

20

-11

C4

A patient should know all the possible treatments of diabetes

0

-3

3

1

1

-1

-10

10

-3

12

-7

D1

Family support is important to manage diabetes

5

-1

11

2

7

14

11

-1

0

0

16

D2

Learning how others cope with diabetes is beneficial

3

1

3

-2

7

12

3

2

-5

4

8

D3

Participation in workshops for patients helps manage diabetes

2

-3

7

3

6

2

16

-12

-12

-2

19

D4

Belonging to a community of patients helps support others with diabetes

1

-2

3

-2

14

-1

7

-6

-10

-3

15

In a relatively large data set of the type we have, comprising 1200 responses from 50 respondents and 16 elements in the basic set of messages, with a variety of groups, it is natural for a variety of elements to score well, even by chance. The key to the data is whether we see interpretable patterns. With that caveat, we look now at the groups.

Gender

Males are more likely to rate the basic vignette as important, even without the message. The additive constant is 73 for males, and a much lower 44 for females.

Both genders believe in diet and exercise. Men feel that treatment is important (problem/solution), whereas women feel that social support from family is important.

Age

The younger respondents have a higher base level of belief that the vignette is important, even without the elements (additive constant =61 and 62), whereas the older respondents feel that its more likely the messages (additive constant = 48)

The youngest respondents (age 13–34) don’t feel that any message stands out

Both older groups recognize the important diet and exercise, and the need for treatment. In contrast, the youngest group does not agree. This is the group that needs the messaging.

Both older age groups recognize the importance of community support.

Beyond WHO to HOW THEY REACT TO SPECIFICS – Emergent Mind-Sets discovered with Mind Genomics

During the past sixty years or so marketers have recognized that people differ from each other in the way they look at the world, especially the everyday world. Of course, inter-individual variation is not new. The old proverb ‘of taste there is no dispute’ recognizes that people differ in what they like and what they do not like.  The issue facing science is to understand the nature of these inter-individual differences. The reductionist might wish to ascribe these differences to biological variations in composition, and indeed three quarters of a century ago, Dr William Sheldon discussed the personalities of people based on body type (ectomorph, mesomorph, endomorph). Author Moskowitz studied with one of Sheldon’s associates, S. S. Stevens at Harvard University in the 1960’s, had met Sheldon, and had many discussions with Stevens on the influence of body type as it affects behavior and thinking.

In some way, Mind Genomics emerged thirty years later from those initial discussions, not so much talking about the nature of the body type influencing behavior, but rather on the need to ‘reverse the discussion’ and discuss the how people differed in the specifics of their thinking, and perhaps from understanding these specifics, find a correlated physiological explanation. In other words, work in the opposite way, from the granular, the way of thinking about the specific topics, to the general.

The Mind Genomics exercise, as shown here, reveals that that response to different messages about diabetes does not reveal any massively strong messages. Dividing people by gender by age, and so forth, does not seem to produce the very large differences suggested either by pioneer market researcher [36] in his work on psychographic segmentation, nor the differences that might be expected from dividing people by body types.

Mind Genomics extends the nature of dividing people, working at the level of the very specific, looking at the patterns of coefficients for a set of respondents, for a single study, such as the study reported here on diabetes. The underlying principle is that, without theory, one can use the statistical powerhouse of clustering to divide a group of objects, here people, into complementary, i.e., non-overlapping groups. The division is based on strictly mathematical criteria and is agnostic to the meaning of the emergent groups. It is the task of the researcher to decide how many such groups (mind-sets, clusters) should be extracted [37] Parsimony is best, i.e., the fewer the number of such mind-sets, the better is the solution. Interpretability is a must; the mind-sets must ‘make intuitive sense’ and not seem to be forced combinations of divergent elements.

The specific method for creating these mind-sets comes from clustering. The objective is to divide the objects, here people, based upon the mathematical criteria underlying the specific clustering algorithm. In this study of diabetes, the clustering is based upon separating respondents into groups so that the ‘distances’ between the respondents within a group is low, and the distances between the centroids or averages of the groups on the 16 elements is high. The ‘distance between two people’ is operationally defined as the quantity (1-Pearson Correlation Coefficient.) The Pearson Correlation Coefficients shows the degree of linear relation between two variables, her the linear relation between two people, base upon their 16 coefficients. (The additive constant is not considered.)  The Pearson Correlation Coefficient, R,] ranges from a high of 1 for two people perfectly related to each other (distance = 1–1 = 0), to a low of -1 for two people perfectly inversely related to each other (distance = 1 – – 1 = 2).

How many mind-sets? The conflict between parsimony and explainability

The clustering procedure as described above is a mathematical exercise, which operates by strictly formal means, in turn agnostic to the meaning of the clusters extracted.  In actuality, the entire effort of clustering is to impose an interpretable order on what might otherwise be a cloud of different points. The clusters which emerge are simply way to understand this cloud of different points. Indeed, as SS Stevens, professor of Psychophysics at Harvard University would tell author HRM, ‘the hardest thing in science is to divide what is essentially a continuum into discrete points’ [38]

Mindful of the nature of clustering, to satisfy the mutually antagonistic objectives of parsimony (fewer are better) and interpretability (more let the story be simpler to emerge), we look at the results for two mind-sets (Mind-Set 2A vs Mind-Set 2B), and then the results for three mind-sets (Mind-Sets 3C, vs 3D vs 3E.)  Table 4 shows the strongest performing elements for each of the complementary mind-sets.  As Table 4 shows, increasing the number of segments to generate more mind-sets allows a finer set of gradations to emerge. For example, in the two-segment solution the ‘story’ is about the help of others versus the patient alone. When the two-segment solution is expanded to three segments, i.e., a new Mind-Set is permitted, the focus on the Doctor as the Expert emerges, a focus that could not emerge with the two-segment solution.

Table 4. Strongest messages emerging from the two versus three segment solution

Two-Segment Solution

Mind-Set 2A – Focus on management with the help of others

D3

Participation in workshops for patients helps manage diabetes

16

D1

Family support is important to manage diabetes

11

A3

Diet and exercise are key to diabetes prevention

10

B3

Frequent doctor visits help adherence to diabetes treatment

8

Mind-Set 2B– Focus on the sufferer alone

C4

A patient should know all the possible treatments of diabetes

10

A2

Diabetes is dangerous without treatment

9

Three Segment Solution

Mind-Set 3C – Focus on the sufferer alone

A3

Diet and exercise are key to diabetes prevention

17

A2

Diabetes is dangerous without treatment

14

Mind-Set 3E – The doctor is the source of knowledge

C3

A doctor should refer patients to educational materials about diabetes

20

C1

It’s a doctor’s role to educate patients about diabetes

16

C4

A patient should know all the possible treatments of diabetes

12

A2

Diabetes is dangerous without treatment

8

Mind-Set 3E – Focus on management with the help of others

D3

Participation in workshops for patients helps manage diabetes

19

D1

Family support is important to manage diabetes

16

D4

Belonging to a community of patients helps support others with diabetes

15

B3

Frequent doctor visits help adherence to diabetes treatment

11

D2

Learning how others cope with diabetes is beneficial

8

Beyond interest to ‘engagement’ – the value of response time as a measure

Experimental psychologists have sought physiological correlates of attention and psychological processes, doing so for more than a century. One of the earliest of these measures is the so-called ‘reaction time’ [39], presumed to reflect the amalgam of psychological forces interacting with each to drive a behavior. The response time itself is simply a measure but becomes of interest when it can be linked to antecedent stimuli.

In the Mind Genomics experiment, the computer system measured the response time between the appearance of the vignette on the screen and the rating assigned by the respondent.  The reaction times to the different vignettes vary, but like the ratings, it’s the deconstruction of the response times into the different contributions from the 16 elements which are of interest.  Again, the benefit of experimental design is that we know the exact contribution of each element.

The deconstruction uses the method of OLS regression, this time without the additive constant. The rationale for abandoning the additive constant is that in the absence of elements the response time to the vignette should be 0 seconds.

Table 5 shows the estimated response times to the different elements, by total panel, gender, and then the two mind-sets and the three mind-sets, respectively. To make the table easier to read, we have shaded all response times of 1.8 seconds or longer. This value of 1.8 is simply a convenient cut-point. Furthermore, the response time does not equal agreement

Table 5. Estimated response times in seconds to individual elements

Total

Male

Female

Age13–34

Age 35–54

Age 55+

Mind-Set2A

Mind-Set2B

Mind-Set3C

Mind-Set3D

Mind-Set3E

A4

Diabetes is the most profound disease of this century

1.9

1.7

2.0

1.8

1.4

2.4

1.6

2.2

2.0

1.7

1.9

A1

By living longer there is a greater chance of suffering from Diabetes

1.7

1.6

1.8

1.3

1.8

2.4

1.6

1.8

1.6

1.5

1.9

A2

Diabetes is dangerous without treatment

1.7

1.8

1.6

1.7

1.2

2.1

1.8

1.6

2.3

1.0

1.6

A3

Diet and exercise are key to diabetes prevention

1.7

1.7

1.7

1.6

1.3

2.2

1.6

1.7

2.0

1.2

1.7

C2

The internet is all you need to learn about diabetes

1.6

2.0

1.3

1.5

1.9

1.6

1.7

1.5

1.6

1.6

1.6

B2

People with diabetes use a lot of health services

1.6

1.6

1.6

1.3

1.7

2.0

1.4

1.8

2.0

1.5

1.2

C3

A doctor should refer patients to educational materials about diabetes

1.6

1.6

1.5

1.2

1.8

2.0

1.7

1.4

1.6

1.2

1.8

D4

Belonging to a community of patients helps support others with diabetes

1.6

1.7

1.4

1.0

2.3

1.9

1.4

1.8

1.7

1.6

1.4

B3

Frequent doctor visits help adherence to diabetes treatment

1.5

1.4

1.7

1.2

1.7

2.1

1.4

1.6

1.4

2.0

1.3

C1

It’s a doctor’s role to educate patients about diabetes

1.5

1.6

1.4

1.1

1.9

1.8

1.5

1.6

1.6

1.6

1.5

D2

Learning how others cope with diabetes is beneficial

1.5

1.5

1.5

1.4

1.8

1.4

1.7

1.4

1.6

1.3

1.6

B4

Diabetes requires a lot of medications

1.5

1.6

1.4

1.1

1.5

2.0

1.5

1.4

1.1

1.9

1.5

D1

Family support is important to manage diabetes

1.5

1.7

1.3

0.9

1.9

2.1

1.5

1.4

1.2

1.4

1.8

D3

Participation in workshops for patients helps manage diabetes

1.4

1.3

1.5

1.2

1.5

1.5

1.2

1.6

1.1

1.4

1.7

C4

A patient should know all the possible treatments of diabetes

1.4

1.6

1.1

1.1

1.6

1.6

1.3

1.4

1.4

1.3

1.3

B1

It’s OK to self-manage the Diabetes

1.3

1.5

1.0

0.8

1.4

1.8

1.0

1.5

1.3

1.8

0.8

Table 5 suggests that when we look at the elements which occupy a respondent’s attention, take longer to read, the elements are information, rather than exhortative. That is, the respondents pay attention to phrases which relevant information. Each of the three phrases below provides information that can be used to make decisions.

Diabetes is the most profound disease of this century

By living longer there is a greater chance of suffering from Diabetes   

Diabetes is dangerous without treatment

Finding Mind-Sets in the population through the PVI (personal viewpoint identifier)

Diabetes poses a general risk to people and to the economy world-wide.  Communications which fail to recognize the existence and nature of the different mind-sets involved in diabetes are likely to be less than optimal. Indeed, as Table 3B shows quite clearly, when we look at newly revealed Mind-Sets in the population, we see that some messages are simply irrelevant, whereas others seem irrelevant on average, but are quite polarizing, striking a strong chord among one mind-set and turning off the other mind-sets. Finding the compelling messages is critical for all cultures, and all economic groups [40,41,42,43]

The differences between and among mind-sets can either be ignored at the peril of choosing irrelevant or negatively messages on the one hand or choosing the most effective message for each person on the other.  The latter is clearly preferable, namely choose the correct message.  The question is ‘How?’ A facile answer is ‘Big Data’ and the well-worn but meaningless statement ‘the answer has to got to be in there, somehow.’  The reality is that the answer is probably not easy to find in Big Databut may be easy to find using a slightly different approach, the data emerging from the Mind Genomics experiment.

A sense of the frustration with using conventional data analytics can be obtained from Table 6, which shows the number of respondents in the set of 50, belonging to each of the three mind-sets, versus the self-defined classification of age (WHO) and stated concern with diabetes (PSYCHOGRAPHIC.)  There is no pattern, and indeed in most Mind Genomics studies evidencing clear mind-sets, the covariation of these mind-sets with traditional, easy-to-find groups in the population has been disappointing at best.  The reason is simple. ‘Birds of a feather DO NOT THINK ALIKE.’  Quite simply, just because two people resemble each other on criteria easy to measure does not mean that they share the same world-view, and more important, does not mean that they share the same mind-set for a specific issue, such as diabetes.

Table 6. Distribution of the 50 respondents by mind-set (column) versus age (row) and versus concern with diabetes (row)


MindSet1
Focus on the sufferer

MindSet2
The doctor is the source of knowledge

MindSet3  Focus on management with the help of others

Total

Total

18

13

19

50

Demographic –

Age

Younger

9

6

10

25

Middle

7

1

4

12

Older

2

5

5

12

No Answer

1

Psychographic – Concern with diabetes

I have diabetes

1

1

3

5

I worry about becoming diabetic

4

1

0

5

I am at risk for diabetes

3

0

2

5

Diabetes is never on my mind

3

1

1

5

Not applicable

7

10

13

30

We already know the coefficients for the same elements, but from different mind-sets.  The task is to identify those elements which best differentiate between two or among three mind-sets and create a scoring system. The new respondent, whose mind-set is to be determined, is presented with the set of elements, in the form of six no/yes questions, creating 64 combinations. The pattern of the combinations determines the most likely mind-set to which the respondent will be assigned.  The task is simple. The results are not perfect, of course, but give the opportunity for a quick assignment of a person to the most likely mind-set. In addition, the PVI is based solely on the data from the study which uncovered the mind-sets in the first place, and thus the PVI does not need to intervening variables or hypothetical constructs.

Figure 2 shows the six question PVI. Figure 3 shows the set of answers, feedback, either for the person being typed, or for the health professional who is counseling or treating the patient.  The power of the PVI is its ability to personalize the message, and thus generate potentially greater compliance or behavior change. The PVI addresses the sensibilities of the individual rather being a random shot of information, determined for the population at large, and which through the process of attenuation by having to appeal to different factions, ends up modestly appealing to many people, and thus for the most part, bland and ineffective.

Mind Genomics-022 EDMJ Journal_F2

Figure 2. The six-question PVI for diabetes

Mind Genomics-022 EDMJ Journal_F3

Figure 3. The three feedback pages, each attuned to the sensibilities of the person assigned to the mind-set by the diabetes-focused PVI

Discussion and conclusions

Mind Genomics provides a new vision for the world of the person’s experience with the worlds of medicine and public health.  Whereas much of what we know about medicine comes from clinical studies with patients as test subjects, and in turn, much of what we know about public health comes from statistical studies of populations, Mind Genomics plunges right into the mind of the person, to find out what is important.  Mind Genomics begins at the bottom, at the simplest level of communication, the communication of facts and suggestions. Soon, however, Mind Genomics moves on to understanding the attitudes of the person towards issues and situations in medicine and public health.  In doing so Mind Genomics may be said to provide a major advance to the worlds of medicine and public health because it deals with the person, the specifics, and recommends actions.

A proactive health program recognizes the need for better communications (23,44)Until now, however, the focus has been on recognizing the ‘need’ and ‘effectiveness’ of communication, viz., on the establishment of these topics as relevant. Enter Mind Genomics with the ‘HOW,’ the specific ‘WHAT TO SAY.’  We may hope for a more powerful, more specific, targeted, effective communication, which in the case of diabetes may lead to more healthful activities before diabetes strikes, and in turn more medically-relevant compliance and behavior just as diabetes strikes, or threatens to strike.

Acknowledgment

Attila Gere thanks the support of the Premium Postdoctoral Researcher Program of the Hungarian Academy of Sciences

References

  1. Chen R, Song Y, Hu Z, Brunner EJ (2012) Predictors of diabetes in older people in urban China. PloS one 7: 50957.
  2. World Health Organization: World Diabetes: https://www.who.int/news-room/fact-sheets/detail/the-top-10-causes-of-death. Retrieved on May 25, 2019.
  3. Feigin VL, Roth GA, Naghavi M, Parmar P, Krishnamurthi R, et al (2016) Global burden of stroke and risk factors in 188 countries, during 1990–2013: a systematic analysis for the Global Burden of Disease Study 2013. The Lancet Neurology 15: 913–924..
  4. Krug EG (2016) Trends in diabetes: sounding the alarm. The Lancet 387: 1485–1486.
  5. Guariguata L, Whiting DR, Hambleton I, Beagley J, Linnenkamp U, et al (2014) Global estimates of diabetes prevalence for 2013 and projections for 2035. Diabetes research and clinical practice 103: 137–149.
  6. Shaw JE, Sicree RA, Zimmet PZ,( 2010) Global estimates of the prevalence of diabetes for 2010 and 2030. Diabetes research and clinical practice 87: 4–14.
  7. Whiting DR, Guariguata L,Weil C, Shaw J (2011) IDF diabetes atlas: global estimates of the prevalence of diabetes for 2011 and 2030. Diabetes research and clinical practice 94: 311–321.
  8. International Diabetes Federation: IDF Diabetes Atlas (2011), Brussels, Belgium: International Diabetes Federation, 5; Risk factors. 2014. www.idf.org/about-diabetes/risk-factors.
  9. Wang, Yu, Zhang, Li et al,(2014)
  10. Bommer C, Heesemann E, Sagalova V, Manne-Goehler J, Atun R, et al (2017) The global economic burden of diabetes in adults aged 20–79 years: a cost-of-illness study. The lancet Diabetes & endocrinology 5: 423–430.
  11. Hackworth N, Moore SM, Hardie E (2007) A risk factor profile for pre-diabetes: biochemical, behavioural, psychosocial and cultural factors. eJApplPsychol 3: 14–26.
  12. Mumu SJ, Saleh F, Ara F, Haque MR, Ali L (2014) Awareness regarding risk factors of type 2 diabetes among individuals attending a tertiary-care hospital in Bangladesh: a cross-sectional study. BMC research notes 7: 599.
  13. Niederdeppe J, Bu QL, Borah P, Kindig DA, Robert SA (2008) Message design strategies to raise public awareness of social determinants of health and population health disparities. The Milbank Quarterly 86: 481–513.
  14. Moskowitz HR (2012) ‘Mind genomics’: The experimental inductive science of the ordinary, and its application to aspects of food and feeding. Physiology & Behavior 107: 606–613.
  15. Moskowitz HR (2014) 14 Mind genomics® and texture: the experimental science of everyday life. In: Food Texture Design and Optimization In: Dar YL, Light JM (eds.) John Wiley.
  16. Moskowitz H, Gofman A (2003) I-nnovation Inc, System and method for content optimization. U.S. Patent: 6,662,215.
  17. Gabay G, Zemel G, Gere A, Zemel R, Papajorgji P, et al (2018) On the threshold: What concerns healthy people about the prospect of Cancer? Cancer Studies and Therapeutics Journal, 3: 1–10.
  18. Gabay G, Moskowitz HR, Silcher M, Galanter E (2017) New NovumOrganum: Policy, perceptions and emotions in health Pardes-Ann Harbor Academic Press.
  19. Gabay G, Gere A, Stanley, Habsburg-Lothringen C, Moskowitz H (2019) Health Threats Awareness – Responses to Warning Messages about Cancer and Smartphone Usage. Cancer Stud Ther J  4: 1–10.
  20. Gabay G, Gere A, Moskowitz H (2019) Understanding Effective Web Messaging – The Case of Menopause. IntegrGynObstet J 2: 1–16.
  21. Gabay G, Gere A, Zemel G, Moskowitz D, Shifron R, et al (2019) Expectations and Attitudes Regarding Chronic Pain Control: An Exploration Using Mind Genomics. Internal Med Res Open J 4: 1–10.
  22. Gabay G, Gere A, Moskowitz H (2019) Uncovering Communication Messages for Health Promotion: The Case of Arthritis. Integr J OrthopTraumatol 2: 1–13.
  23. Aikens JE, Bingham R, Piette JD (2005) Patient-provider communication and self-care behavior among type 2 diabetes patients. The Diabetes Educator 31: 681–690.
  24. Freeman J, Loewe R (2000) Barriers to communication about diabetes mellitus. Journal of Family Practice 49:  507.
  25. Greene JA, Choudhry NK, Kilabuk E, Shrank WH (2011) Online social networking by patients with diabetes: a qualitative evaluation of communication with Facebook. Journal of General Internal Medicine 26: 287–292.
  26. Rhodes P, Nocon A (2003) A problem of communication? Diabetes care among Bangladeshi people in Bradford. Health & social care in the community 11: 45–54.
  27. Dar-Nimrod I, Rawn CD, Lehman DR, Schwartz B (2009) The maximization paradox: The costs of seeking alternatives. Personality and Individual Differences 46: 631–635.
  28. Box GE, Hunter WG, Hunter JS (1978) Statistics for experimenters, New York, John Wiley
  29. Moskowitz HR, Gofman A (2007) Selling blue elephants: How to make great products that people want before they even know they want them. Pearson Education.
  30. Moskowitz HR, Gofman A, Beckley J, Ashman H (2006) Founding a new science: Mind genomics. Journal of sensory studies 21: 266–307.
  31. Green PE, Rao VR (1971) Conjoint measurement for quantifying judgmental data. Journal of marketing research 8: 355–363.
  32. Green PE, Srinivasan V (1990) Conjoint analysis in marketing: new developments with implications for research and practice. The journal of marketing 54: 3–19.
  33. Moskowitz HR, Gofman A, Itty B, Katz R, Manchaiah M, et al (2001) Rapid, inexpensive, actionable concept generation and optimization: the use and promise of self-authoring conjoint analysis for the food service industry. Food Service Technology 1: 149–167.
  34. Kahneman D, Egan P (2011) Thinking, fast and slow. New York: Farrar, Straus and Giroux.
  35. Gofman A, Moskowitz H (2010) Isomorphic permuted experimental designs and their application in conjoint analysis. Journal of Sensory Studies 25: 127–145.
  36. Wells WD (2011) Chapter 13: LifeStyle and Psychographics: Definitions, Uses, and Problems. In: Wells WD (ed.), LifeStyle and Psychographics. Marketing Classics Press Decatur, GA, USA.
  37. Dubes R, Jain AK (1980) Clustering methodologies in exploratory data analysis. Advances in Computers19: 113–238.
  38. Stevens SS (1966) Personal communication to Howard Moskowitz, Harvard University, Department of Psychology, Laboratory of Psychophsysics.
  39. Rieber RW, Robinson (2001) Wilhelm Wundt in history: The making of a scientific psychology In: DK (eds.).  Springer Science & Business Media. Heidelberg, New York,USA.
  40. Heisler M, Bouknight RR, Hayward RA, Smith DM, Kerr EA (2002) The relative importance of physician communication, participatory decision making, and patient understanding in diabetes self-management. Journal of general internal medicine 17: 243–252.
  41. Heisler Michele, Ian Cole, David Weir, Eve A Kerr, Rodney A Hayward (2007) “Does physician communication influence older patients’ diabetes self-management and glycemic control? Results from the Health and Retirement Study (HRS).”  The Journals of Gerontology Series A: Biological Sciences and Medical Sciences 62: 1435–1442.
  42. Matthews SM, Peden AR, Rowles GD (2009) Patient–provider communication: Understanding diabetes management among adult females. Patient education and counseling 76: 31–37.
  43. Schillinger D, Bindman A, Wang F, Stewart A, Piette J (2004). Functional health literacy and the quality of physician–patient communicationamong diabetes patients. Patient education and counseling 52: 315–323.
  44. Naik AD, Kallen MA, Walder A, Street Jr RL (2008) Improving Hypertension Control in Diabetes Mellitus, the Effects of Collaborative and Proactive Health Communication. Circulation 117: 1361.

Twins with Juvenile Hyaline Fibromatosis

Abstract

Background: Juvenile hyaline fibromatosis (JAF) is a rare autosomal-recessive disease in which patients progressively develop cutaneous tumoral fibroblastic proliferations, and joint contractures with bone involvement. JAF is caused by aberrant synthesis of glycosaminoglycans by fibroblasts due to a mutation of the capillary morphogenesis factor-2 gene (CMG2). Limited treatment options are available.

Method: We report monozygotic twins who presented with multiple, recurrent, painless cutaneous nodules.

Result: The presence of twins with JAF is extremely rare. A lesion on the head of one boy had ruptured, and pathological analysis indicated benign spindle cells in a periodic acid-Schiff (PAS)-positive hyaline background. One of twins had much more severe clinical presentation than the other, including more frequent diarrhea, larger nodules, more severe joint involvement, and more easily ruptured masses.

Conclusion: Monozygotic twins who present with JAF may have different severity of symptoms despite the presence of identical mutations in CMG2.

Keywords

juvenile hyaline fibromatosis, twins, subcutaneous mass

Introduction

Juvenile hyaline fibromatosis (JHF) is a rare autosomal-recessive disease caused by mutations in capillary morphogenesis gene-2 (CMG2). There have been fewer than 70 cases reported so far in the literature [1–2], and there has only been one report of twins with JHF [3].The clinical onset usually occurs before 5 years of age, and this disorder is slightly more common in boys [4]. JHF is characterized by cutaneous tumoral fibroblastic proliferation, joint contractures, and bone involvement [2].

Materials and Methods

Clinical Features

Two one-and-a-half year-old male monozygotic twins presented with multiple, progressive, painless, variable-sized nodules all over their bodies. The parents had the same family name and lived in the same remote village in Henan province of China, but were not first-degree relatives. In the year prior to presentation, both infants had recurrent diarrhea of unknown etiology, and in the 6 months prior to presentation, both had multiple, painless, variable-sized cutaneous nodules all over their bodies. These nodules were first noticed around the joints, then on the trunk and head, and eventually all over their bodies. The size of nodules increased gradually over time. One year ago, a nodule on one child’s finger was given an incisional biopsy at a local hospital, and the pathological result was “benign”, but there was no definite diagnosis or further investigation. When they were hospitalized, one of masses on the head had decayed spontaneously and the joint contractures had deteriorated gradually, which crippled both of them. They both had very poor appetites. One of them (patient A) had more severe signs and symptoms than the other (patient B) [Table 1]. They both achieved normal mental development milestones.

Table 1. Clinical feature difference between the twins


patien A

patient B

clinical onset

earlier

later

maximium diameter of nodules

25

15

mass rupture

yes

no

gingival proliferation

svere

moderate

joint constracture

svere

moderate

perianal tissue proliferation

yes

no

nostril narrow

yes

no

diarrhea

conatantly

intermittent

On physical examination, there were multiple, painless, variable-sized nodules all over the bodies, which were soft upon palpation [Figure 1]. The largest nodule was on the head of patient A, whose diameter was 25 cm [Figure 2]. One mass on the head had ruptured and had a terrible odor [Figure 3]. Cutaneous tumoral fibroblastic proliferation around the lips and gingival hyperplasia [Figure 4] were also present. Patient A had a narrow nostril caused by subcutaneous proliferation, but no shortness of breath [Figure 5]. There were many nodules on their hands and fingers [Figure 6], elbows [Figure 7], and abdomens [Figure 8]. There were also flexion contracture deformities of the limbs [Figure 9], scales on the feet [Figure 10], and proliferation in the perianal area [Figure 11], but no significant lymphadenopathy or hepatosplenomegaly.

PSC 2019-101 - Deng Gaoyan China_f1

Figure 1. Appearance of the twins.

PSC 2019-101 - Deng Gaoyan China_f2

Figure 2. Mass on the head.

PSC 2019-101 - Deng Gaoyan China_f3

Figure 3. Decayed mass on the head.

PSC 2019-101 - Deng Gaoyan China_f4

Figure 4. Cutaneous proliferation around the lips and gingival hyperplasia.

PSC 2019-101 - Deng Gaoyan China_f5

Figure 5. Patient A had a narrow nostril.

PSC 2019-101 - Deng Gaoyan China_f6

Figure 6. Nodules on hands and fingers

PSC 2019-101 - Deng Gaoyan China_f7

Figure 7. Nodules on elbow.

PSC 2019-101 - Deng Gaoyan China_f8

Figure 8. Nodules on abdomen.

PSC 2019-101 - Deng Gaoyan China_f9

Figure 9. Flexion contracture deformities of the knee.

PSC 2019-101 - Deng Gaoyan China_f10

Figure 10. Scales on the foot.

PSC 2019-101 - Deng Gaoyan China_f11

Figure 11. Proliferation in the perianal area.

The complete blood counts and electrolyte levels were within normal limits. An X-ray indicated osteoporosis in vertebrae of patient A [Figure 12]. Computed tomography (CT) results showed no masses in the abdominal cavities, except for cutaneous nodules in the abdominal wall [Figure 13]. A head CT of patient A showed  a large subcutaneous mass but no intracranial abnormalities [Figure 14].

PSC 2019-101 - Deng Gaoyan China_f12

Figure 12. Osteoporosis in vertebrae.

PSC 2019-101 - Deng Gaoyan China_f13

Figure 13. Cutaneous nodules in the abdominal wall.

PSC 2019-101 - Deng Gaoyan China_f14

Figure 14. Subcutaneous mass without intracranial abnormalities.

After consent from the parents, a biopsy of the large mass on patient A’s head was performed. Hyaline subcutaneous tissue was present beneath the skin [Figure 15], which was sent for pathological investigation. The ruptured head mass was covered with dressing and required regular changes.

PSC 2019-101 - Deng Gaoyan China_f15

Figure 15. Hyaline subcutaneous tissue beneath the skin.

Pathological Findings

Gross examination indicated that the nodules had a gelatinous white and hyaline appearance [Figure 16]. Microscopically, there were poorly circumscribed lesions composed of many uniform spindle cells embedded in an abundant homogenous fibrous matrix. This matrix was eosinophilic and tested positive on periodic acid-Schiff (PAS) staining, findings characteristic of JHF [Figure 17]. The parents did not consent to surgical procedures on the other child.

PSC 2019-101 - Deng Gaoyan China_f16

Figure 16. Gross pathological examination.

PSC 2019-101 - Deng Gaoyan China_f17

Figure 17. Microscopical pathological examination.

RNA isolation and cDNA amplification of samples from each patients’ blood were performed. Cloning and sequencing of the CMG2 gene showed that both patients had the same 4 mutations: c.294C→A, c.1069G→C, 1074delT, and c.1153G→C.

Follow up

The twins were followed up for 4 years after the initial presentation. At the last follow-up, the decayed head lesion of patient A was still unhealed, there were more nodules all over their bodies, and the masses on the head of patient A were larger. The parents refused further therapy.

Discussion

JHF is a rare autosomal-recessive disease that was first described by McMurray [1] as molluscum fibrosum, but renamed by Kitano [2]. Patients with JHF present with multiple cutaneous nodules or masses, gingival hypertrophy, joint contractures, and osteolytic lesions [4]. Skin lesions are the most prominent symptoms [8]. Normal motor development is impaired if joint contractures occur during infancy. Eating and delayed dentition can be caused by severe gingival hyperplasia [1].

Histological examination can confirm a diagnosis of JHF [10]. In particular, lesions from the dermis, subcutis, gingivae, bone, and joints contain abundant homogeneous eosinophilic matrix, which is embedded with cords of spindle-shaped cells. The matrix stains positively with PAS and alcian blue, but not with toluideine blue or Congo red [10]. Nodules are calcified occasionally, but have no elastic tissue. The etiology is unknown. The differential diagnosis includes neurofibromatosis, fibromatosis, amyloidosis, infantile systemic hyalinosis, lipoid proteinosis, and Winchester syndrome [2].

The JHF gene is located on gene 4q21 [5], and previous studies have described the effects of mutations in CMG2 [6]. Previous researchers have described JHF as a connective tissue disease that is characterized by aberrant synthesis of glycosaminoglycans. Dermatan sulfate is the predominant glycosaminoglycan in the skin of patients with JHF, which also has chondroitin sulfate and hyaluronan, but hyaluronan is the most abundant glycosaminoglycan in normal skin [7].

There are no specific treatments for JHF, but cosmetic surgery and those that limit orthopedic disability may be employed. This disease has a progressive course, and most patients only survive up to the 4th decade [1–2]. Relapses are common after tumor removal. A previous report indicated good cosmetic results after removal of more than 100 tumors over a period of 19 years [9]. Physiotherapy may be performed to prevent flexion contractures.

The occurrence of twins with JHF is extremely rare, and there has only been one previous case report [3], and the researchers did not report differences between these twins. It is generally accepted that twins will have the same presentations, because JHF is a genetic disease. However, our twins had very different presentations. Patient A had more severe symptoms [Table 1], and a head mass that ruptured and bled, and was refractory to treatment. Patient A also had more frequent diarrhea, larger nodules, and more severe joint involvements.

We do not know the reasons for the different presentations of these twins. They had identical mutations in CMG2, and might be expected to eventually develop the same signs and symptoms. It may be hypothesized that the differences between the normal and genetically mutated somatic cells led to the differences in these twins. It is possible that patient B will eventually develop the same severe symptoms as patient A. A close follow-up of these children is warranted.

Statement

There are no prior publications or submissions with any overlapping information, including studies and patients. The manuscript has not been and will not be submitted to any other journal. There have no financial support or relationships that may pose conflict of interest. Gaoyan, Deng wrote the first draft of the manuscript. No honorarium, grant, or other form of payment was given to anyone to produce the manuscript. Each author listed on the manuscript has seen and approved the submission of this version of the manuscript and takes full responsibility for the manuscript.

References

  1. Nischal KC, Sachdev D, Kharkar V, Mahajan S. (2004) Juvenile hyaline fibromatosis. J Postgrad Med 50: 125–6.
  2. Haleem A, Al-Hindi HN, Juboury MA, Husseini HA, Ajlan AA. (2002) Juvenile hyaline fibromatosis: Morphologic, immuno histochemical and ultrastructural study of three siblings. Am J Dermatopathol 24: 218–24.
  3. Habibeddine S, Khadir K, Azzouzi S, Skalli S, Lakhdar H. (2003) Juvenile hyaline fibromatosis: 2 twin brothers affected. Ann Dermatol Venereol 130: 43–6.
  4. Weiss SW, Goldblum JR. (2001) Fibrous tumors of infancy and childhood. In: Strauss M, editor. Enzinger and Weiss’s Soft Tissue Tumors. 4th ed. St. Louis: Missouri Mosby; 363–7.
  5. Nazneen Rahman, Melanie Dunstan M. Dawn Teare. (2002) The gene for juvenile hyaline fibromatosis maps to chromosome 4q21. Am J Hum Genet 71; 975–980.
  6. Sandra Hanks, Sarah Adams, Jenny Douglas. (2003) Mutations in the gene encoding capillary morphogenesis protein 2 cause juvenile hyaline fibromatosis and infantile systemic hyalinosis. Am J Hum Genet 73; 791–800.
  7. Katagiri K, Takasaki S, Fujiwara S, Kayashima K, Ono T, et al. (1996) Purification and structural analysis of extracellular matrix of a skin tumor from a patient with juvenile hyaline fibromatosis. J Dermatol Sci 13: 37–48.
  8. Sanzalin H, Kiyozuka Y, Uemura Y, Shikata N, Ueda S, et al. (1998) Juvenile hyaline fibromatosis: A report of two unrelated adult sibling cases and a literature review. Pathol Int 48: 230–6.
  9. Woyke S, Domagala W, Markiewicz D. (1984) A 19-year follow-up of multiple juvenile fibromatosis. J Pediatr Surg 19: 302.
  10. Arnold H, Odom RB, James WD. (1990) Andrews’ diseases of the skin, Clinical dermatology. 8th ed. Philadelphia: Saunders, 712.