Author Archives: admin

Changes in Cerebral Blood Flow and Prolonged Disturbances in Cerebral Autoregulation in Critically ill Children with Diabetic Ketoacidosis

Abstract

Objective: Intracerebral complications are the most common cause of morbidity and mortality in children with diabetic ketoacidosis (DKA). Emerging evidence suggests that ischemic injury may be a factor in the development of cerebral edema. This study was designed to evaluate cerebral hemodynamics and autoregulation during DKA in critically ill children using transcranial Doppler ultrasound (TCD).

Design: Prospective observational study

Setting: Tertiary care pediatric intensive care unit (PICU)

Patients: Patients ≤18 years admitted to the PICU with moderate to severe DKA (serum glucose > 200 mg/dl, pH < 7.15, bicarbonate < 15 mmol/L, and urine ketones).

Measurements and Main Results: Within 4 hours of admission the flow velocities in the middle cerebral arteries (MCA) and basilar artery (BA) were measured using TCD. Cerebral autoregulation was evaluated using the transient hyperemic response ratio (THRR), with values ≥ 1.1 defined as normal. TCD was repeated after resolution of DKA. 26 patients were studied [median age 10 yrs (0.75-18), median initial glucose 558 (289-1018) g/dL, median initial pH 6.98 (6.78-7.13)]. Mean MCA flow velocities were unchanged when compared to previously published normal values. Mean BA flow velocities were significantly lower than these normal values during and after resolution of DKA, p = 0.001. Cerebral autoregulation during DKA was impaired in 92% of patients [median THRR on right 0.97 (0.65-1.14), left 0.98 (0.39-1.26)] and remained abnormal in 64% after resolution of DKA. Patients with clinical and imaging evidence of cerebral edema had lower BA mean flow velocities than patients without cerebral edema (p = 0.06).

Conclusions: Our data shows decreased basilar artery flow velocities and prolonged impairment of cerebral autoregulation in children with DKA. Understanding these disruptions in cerebral blood flow may lead to future therapeutic targets and should be further studied in hopes of improving neurologic outcomes in diabetic children experiencing DKA.

Keywords

diabetic ketoacidosis, blood flow velocity, cerebral blood flow, transcranial Doppler ultrasonography, cerebral edema, diabetes complications

Introduction

Cerebral edema and intracerebral complications are the most common cause of morbidity and mortality in children with diabetic ketoacidosis (DKA) [1-4]. While symptomatic cerebral edema has been reported in approximately 1% of children with DKA, recent literature suggests that subclinical cerebral edema during DKA may be a more common occurrence than previously appreciated and may occur in up to 50% of children [1-8]. In one magnetic resonance imaging (MRI) study of children with DKA, 54% of children had decreased ventricular size, which suggested the presence of subtle cerebral edema despite a lack of neurologic symptoms [7]. Additionally, long term memory deficits in children with type I diabetes mellitus (DM) are strongly associated with a past history of DKA, regardless of their overall glycemic control; this finding suggest that subtle neurological injury occurs during this critical time [9, 10].

The underlying mechanism for cerebral edema in children with DKA is unknown. Emerging evidence suggests that ischemic injury resulting from dehydration and hyperventilation due to acidosis may be an inciting factor [11-15]. Hypoperfusion and reperfusion injury with associated cerebral edema may develop as dehydration is correction and carbon dioxide levels normalize with treatment [6, 16-18]. Additionally, hyperglycemia and ketosis increase the risk of hyperemia during correction of carbon dioxide in animal studies [19]. Impaired cerebral autoregulation in other neurologic conditions such as stroke and traumatic brain injury is known to be associated with an increased risk of secondary injury and reperfusion injury [20, 21]. A transient impairment of cerebral autoregulation in DKA has been reported but overall data about changes in cerebral hemodynamics and autoregulation are limited in children with DKA [16, 22].

Understanding changes in cerebral hemodynamics during DKA and its impact upon neurologic injury may be useful to inform treatment strategies to optimize cerebral blood flow to minimize cerebral edema. Transcranial Doppler ultrasound (TCD) is a noninvasive test that can be used at the bedside to evaluate real time changes in cerebral hemodynamics and autoregulation. TCD is an established clinical tool in neurocritical care with applications that include monitoring for vasospasm after aneurysm subarachnoid hemorrhage, emboli detection during carotid endarterectomy, and screening for evidence of sickle cell vasculolopathy [23]. As a research tool, TCD has provided insight into cerebral blood flow patterns in a variety of neurological conditions such as acute ischemic stroke and traumatic brain injury.

We designed a study using TCD to evaluate blood flow patterns and changes in critically ill children with moderate to severe DKA. We hypothesized that decreased cerebral blood flow velocity and impaired autoregulation occurs early in DKA.

Materials and Methods

We performed a prospective observational study at a pediatric tertiary care center between 2011-2014. This study was approved by our institutional review board. Patients ≤ 18 years old with moderate to severe DKA admitted to our pediatric intensive care unit (ICU) were screened. Patients were eligible for the study if they had a serum glucose > 200 mg/dl, venous or capillary pH < 7.15, bicarbonate level < 15 mmol/L, and ketones in their urine. We excluded patients with previously diagnosed diseases known to alter cerebral hemodynamics (e.g. Sickle cell disease). Informed consent was obtained from the patient’s parent or guardian and assent was obtained from the patient when applicable.

Within 4 hours of admission to the intensive care unit, TCD was performed at the bedside using a 2-MHz pulsed probe and commercially available TCD ultrasonography unit (Sonara Digital TCD, Carefusion, Middleton, WI) to measure the systolic, diastolic and mean flow velocities of the middle cerebral arteries (MCA) and basilar artery (BA). Arteries were insonated at 1millimeter (mm) intervals using previously described methods [24, 25]. Cerebral autoregulation was evaluated using the transient hyperemic response ratio (THRR) bilaterally, as previously described [26-28]. A THRR < 1.1 was considered abnormal. Measurements were repeated after resolution of DKA which was defined as pH > 7.3, blood gas carbon dioxide > 35 mmHg, bicarbonate > 15 mmol/L or normalized anion gap and transition off of the insulin infusion to intermittent insulin with a regular diet.

Baseline characteristics of the patients including age, Glasgow Coma Scale (GCS), blood pH, blood glucose, bicarbonate, carbon dioxide, and neuroimaging results were recorded at the time of each study.

Treatment strategy, including choice and rate of fluids and imaging, was left to the discretion of the clinical team. The general practice within our institution utilizes an initial 10 milliliter per kilogram bolus of 0.9 normal saline followed by a two bag system with 0.9 normal saline based intravenous fluids at 1.5 to 2 times maintenance flow rate and an insulin drip of 0.1 units per kilogram per hour. The fluids are titrated to decrease blood glucose by approximately 100 mg/ dl per hour.

Statistical analysis was performed using GraphPad Prism© (La Jolla, California). Descriptive statistics were calculated for baseline characteristics. Wilcoxon matched pairs test was used for comparisons. Each patient served as their own control and blood flow velocities obtained during DKA were compared with their values after resolution of DKA and also to previously published age and gender matched normal values. Baseline demographics and blood flow velocities for patients with cerebral edema versus those without cerebral edema were compared using non-parametric t-tests.

Results

Baseline Characteristics

26 total patients were enrolled. 15 patients were female (57%). 17 patients (65%) had newly diagnosed diabetes. Baseline characteristics are displayed in Table 1. The median time from presentation to the emergency room to initial TCD study was 4.5 hours (2-6.5). Only the first study was obtained for 2 patients as they were discharged before the second TCD study was performed. Information for the first study for both of these patients was included in the data analysis.

Table 1. Baseline Patient Characteristics

Median Range
Age (Years) 10 0.75-18
Initial glucose (milligram/deciliter) 558 289-1018
Initial pH 6.98 6.78-7.13
Initial carbon dioxide  (milliequivalent/liter) 17 7-28
Initial bicarbonate

(milliequivalent/liter)

< 5 < 5 – 8
Initial serum osmolality (calculated) 313 278-368
Sodium at time of 1st study 144 134-157
Sodium at time of 2nd study 142 136-166
Initial Glasgow Coma Scale (GCS) 14 9-15

Middle cerebral artery flow velocities

No difference was found for systolic, diastolic or mean blood flow velocities for either middle cerebral artery during DKA compared to previously published age matched normal values (Figure 1). Additionally, there was no significant difference between the patients’ systolic, diastolic or mean blood flow velocities for the right or left middle cerebral artery when comparing flow during the acute phase of DKA to flow after resolution of DKA in the same patients.

EDMJ 2017-201 Fig1

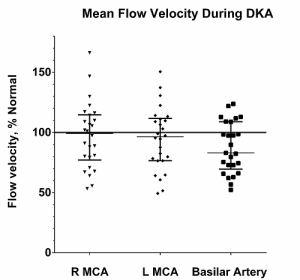
Figure 1. Mean flow velocities for intracranial blood vessels during diabetic ketoacidosis: Mean flow velocities are shown here as percentage of the expected value for the patient’s age and gender. Median and interquartile ranges are displayed on the figure. No difference was found in the mean flow velocities of the right and left middle cerebral arteries during diabetic ketoacidosis compared to previously published age and gender matched normal values. Basilar artery mean flow velocity was significantly lower during DKA than expected (p = 0.001).

Basilar artery flow velocities

Basilar artery mean flow velocity was significantly lower during DKA than expected (median 47% of normal, range 33-129%, p = 0.001) and remained significantly lower than normal after resolution of DKA (p = 0.001) (Figure 2).

EDMJ 2017-201 Fig2

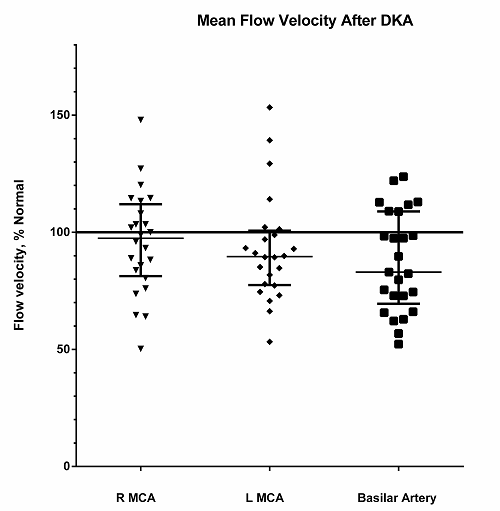
Figure 2. Mean flow velocities for intracranial blood vessels after resolution of diabetic ketoacidosis: Mean flow velocities are shown here as percentage of the expected value for the patient’s age and gender. Median and interquartile ranges are displayed on the figure. No difference was found in the mean flow velocities of the right and left middle cerebral arteries during diabetic ketoacidosis compared to previously published age matched normal values. Basilar artery mean flow velocity was significantly lower after resolution of DKA than expected (p = 0.001).

Cerebral autoregulation/THRR

THRR data was obtained in 24 of the 26 patients; 2 patients did not tolerate testing due to agitation. THRR was abnormal, consistent with impaired cerebral autoregulation, in 92% of patients during DKA (Figure 3a and b) and remained abnormal in 64% of patients on the second evaluation after DKA had resolved.

EDMJ 2017-201 Fig3A

EDMJ 2017-201 Fig3B

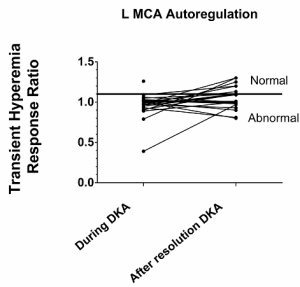
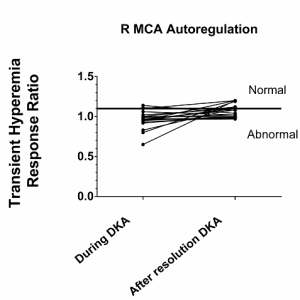
Figure 3A & 3B. Cerebral autoregulation for the middle cerebral arteries: Cerebral autoregulation was impaired during diabetic ketoacidosis in 92% patients as measured by the transient hyperemic response. A response of ≥ 1.1 is defined as normal. a) The median transient hyperemic response on the right was 0.97 (0.65-1.14) and b) on the left was 0.98 (0.39-1.26). Follow-up testing was done in all but 2 patients after resolution of DKA and cerebral autoregulation remained abnormal in 64% of the patients.

Patients with abnormal imaging

10 patients had head imaging on presentation. 6 patients had evidence of cerebral edema (CE) and 1 of these patients also had a left basal ganglia infarction. The mean basilar artery flow velocities were lower in patients with clinical and radiographic evidence of CE than patients without CE (p = 0.06). No difference was seen in the middle cerebral artery flow velocities in patients with and without CT abnormalities. Initial GCS was significantly lower in patients with CE (median 10) than patients without edema [14], p = 0.01. There was no difference in age, initial pH, glucose, bicarbonate or CO2 between patients with and without CE.

Discussion

DKA resulting in cerebral edema is a leading cause of immediate morbidity and mortality in children with diabetes mellitus. Episodes of DKA may contribute to long-term morbidity and cognitive impairment in these children with diabetes mellitus as well [2-4, 9, 10]. Changes that occur in the brain that lead to cerebral edema and long-term neurological injury after DKA are poorly understood. In order to develop strategies to minimize and prevent the neurologic sequelae of DKA, we must first understand the alterations in cerebral blood flow that occur during DKA and which changes are maladaptive. This study provides further insight into the changes in cerebral blood flow and autoregulation in critically ill children with DKA that may contribute to intracranial complications.

No difference from expected age and gender matched normal values was found in the cerebral blood flow velocities of the left and right middle cerebral artery (MCA) during DKA. This is an interesting finding as these flow velocities were within the normal range for age and gender despite acidosis and hypocapnea, which should presumably result in decreased cerebral blood flow. This may represent an adaptive response of the child to try to maintain an adequate cerebral perfusion pressure. Prior studies including TCD studies by Roberts et al reported hyperemia as early as 2 hours into treatment for DKA [16, 29, 30]. The difference in our study results versus the Roberts et al. study may be related to what was considered a normal cerebral blood flow velocity for the patient. We compared the cerebral blood flow velocities to previously published age and gender matched normal values [24, 25]. The authors of the Roberts et al. study compared the measured blood flow velocities to values that were corrected for the patient’s carbon dioxide level and reported a relative hyperemia for a given carbon dioxide level; patients in this study were assumed to have intact CO2 reactivity, which may not have been true. We also compared each patient’s cerebral flow velocities during DKA to their flow velocities after resolution DKA and found no difference between values during and after DKA. This use of each patient as their own control also suggests that patients were not significantly hyperemic during DKA. The patients with cerebral edema on neuroimaging were not any more likely to have hyperemia on their TCDs than patients without clinical or imaging evidence of cerebral edema.

Unlike the MCAs, the mean flow velocities for the basilar artery were significantly lower than expected both during and after resolution of DKA; this study is the first to report changes in the BA flow velocity in children with DKA. These lower blood flow velocities may represent a relative failure of the posterior circulation to increase cerebral blood flow to maintain a constant cerebral perfusion pressure in a hypocarbic state. These diminished flows may result in ischemia during DKA. Glaser et al. reported that in magnetic resonance imaging of children during DKA, the occipital lobes had lower apparent diffusion coefficient values during DKA than other areas of the brain and those values continued to be lower during treatment [31]. Low apparent diffusion coefficient values suggest cytotoxic edema. Furthermore, children with cerebral edema also had significantly lower basilar flow velocities than patients with DKA but without cerebral edema in this study, which suggests that these abnormalities in cerebral flow may be a key feature in the development of intracranial injury during DKA. Notably, the hippocampus, which is important in cognition and formation of memories, is supplied by the posterior circulation; thus it is possible that hypoperfusion to the hippocampus contributes to the long term cognitive and memory deficits in patients with a history of DKA.

Our findings in combination of those of Glaser et al. suggest that the posterior circulation and occipital lobe may have a unique vulnerability to initial and prolonged cerebral ischemia during DKA in children. It is unclear why only the posterior circulation showed a difference in our study but this result may be due to limited power from the small sample size. Alternatively, glucose dysregulation may preferentially affect the posterior circulation involvement since hypoglycemia is known to predominantly cause parietal-occipital lobe ischemia [32, 33]. A recent study of children with type I diabetes also found that > 50% of them had focal slowing in the bilateral posterior region on electrocephalogram at the time of diagnosis; this finding also suggests sensitivity of the posterior brain to injury with abnormalities in glucose homeostasis [34].

Cerebral autoregulation was impaired in almost all patients in this study and remained abnormal in the majority of patients after correction of lab abnormalities. In other studies, autoregulation has been found to be abnormal in patients with type II diabetes and possibly longstanding type I diabetes presumably due to chronic endothelial injury and inflammation [16]. However, this is not the most likely explanation for impaired autoregulation in this study as the majority of the patients were newly diagnosed with diabetes. Abnormal autoregulation as seen in this study is more likely an acute change related to DKA. The reasons for this are not completely clear but one explanation may be that this prolonged loss of cerebral autoregulation is due to the fact that the cerebrospinal buffering system normalizes slowly in comparison to the faster normalization of the serum bicarbonate and pH. Two prior studies have looked at cerebral autoregulation during DKA in children. The first study reported that autoregulation, based upon the autoregulatory index, was abnormal in 5 of 6 patients during DKA but that cerebral autoregulation normalized by 30 hours from presentation [16]. A follow-up study by this group reported impairment in 40% of the patients with DKA and normalization of cerebral autoregulation in the majority of patients by 36-72 hours of therapy [22]. In contrast, our study found that a prolonged abnormality in cerebral autoregulation in the majority of our patients persisted even after labs had normalized. The difference in our results from those previously published by Ma et. al. may be related to how autoregulation was evaluated. In the Ma et al study, the method used to evaluate autoregulation utilized changes in the position of the head of the bed; however, with this approach, measurements can be confounded by the fact that intracranial pressure also may be influenced by bed position. The technique utilized in our study with transient compression of the internal carotid artery does not directly influence ICP.

Under normal conditions, cerebral autoregulation allows the brain to maintain a steady cerebral blood flow despite changes in blood pressure. With loss of normal autoregulation, patients are at risk for cerebral ischemia or hyperemia with small changes in blood pressure. A recent study by Deeter at al. reported of children with DKA found that 19 of 33 patients had hypertension before treatment and 82% had hypertension within the first 6 hours of admission [35]. About a quarter of the patients had continued hypertension after discharge. This observation of increased blood pressure may represent a physiologic response of the body during DKA to try to maintain cerebral blood flow in opposition to cerebral vasoconstriction due to hypocapnea. However, if patients have vasomotor paralysis as seen in our study, then this adaptive hypertension may cause harm by resulting in hyperemia and cerebral edema. These results suggest that patients may benefit from prolonged neuroprotective strategies such as tight blood pressure control because of persistent impairment in cerebral autoregulation even after lab values normalize.

These prolonged abnormalities in cerebral blood flow in the posterior circulation and cerebral autoregulation may contribute to the subtle cerebral injury and thus the longstanding cognitive and behavioral deficits that have been reported in children with DKA [36-38]. A single episode of DKA has been shown to been associated with cognitive dysfunction in rats [39]. There also is evidence of permanent cerebral injury after DKA in children. Patients with a single episode DKA have evidence of decreased gray matter and decreased N-acetylaspartate/creatine ratios on imaging [38, 40]. Thus, these acute derangements in cerebral hemodynamics even with a single episode of DKA may have long-term implications for the children’s neurologic outcome.

This pilot study is limited primarily by the small sample size and confirmation of our findings in larger studies of children with DKA need to be performed. Future studies should evaluate whether there is a correlation in neuropsychological measures with decreased basilar flow in patients. Also, future studies should evaluate children days and weeks out from presentation of DKA to determine how long alterations in cerebral autoregulation persist after resolution of DKA.

Conclusion

Basilar artery blood flow was decreased during DKA in our study and remained low after resolution of DKA. This may contribute to ischemic injury in these patients. Our data also suggests prolonged impairment of cerebral autoregulation occurs in children during DKA and persists after correction of lab abnormalities. Future larger studies are needed to further characterize the timing and changes to cerebral hemodynamics during DKA and any association with acute and long term neurological consequences for children with type 1 DM. Understanding these disruptions in cerebral blood flow may lead to future therapeutic targets with the goal to improve morbidity and cognitive outcomes of these children.

Financial support for study: none

References

  • Bello FA, Sotos JF (1990) Cerebral oedema in diabetic ketoacidosis in children. Lancet 336: 64. [crossref]
  • Edge JA, Jakes RW, Roy Y, et al. (2006) The UK case-control study of cerebral oedema complicating diabetic ketoacidosis in children. Diabetologia 49:2002-2009
  • Lawrence SE, Cummings EA, Gaboury I, Daneman D (2005) Population-based study of incidence and risk factors for cerebral edema in pediatric diabetic ketoacidosis. J Pediatr 146: 688-692. [crossref]
  • Hanas R, Lindgren F, Lindblad B (2007) Diabetic ketoacidosis and cerebral oedema in Sweden–a 2-year paediatric population study. Diabet Med 24: 1080-1085. [crossref]
  • Edge JA, Hawkins MM, Winter DL, Dunger DB (2001) The risk and outcome of cerebral oedema developing during diabetic ketoacidosis. Arch Dis Child 85: 16-22. [crossref]
  • Figueroa RE, Hoffman WH, Momin Z, et al. (2005) Study of subclinical cerebral edema in diabetic ketoacidosis by magnetic resonance imaging T2 relaxometry and apparent diffusion coefficient maps. Endocr Res 31:345-355
  • Glaser NS, Wootton-Gorges SL, Buonocore MH, Marcin JP, Rewers A, et al. (2006) Frequency of sub-clinical cerebral edema in children with diabetic ketoacidosis. Pediatr Diabetes 7: 75-80. [crossref]
  • Muir AB, Quisling RG, Yang MC, et al. (2004) Cerebral edema in childhood diabetic ketoacidosis: natural history, radiographic findings, and early identification. Diabetes Care 27:1541-1546
  • Krane EJ, Rockoff MA, Wallman JK, Wolfsdorf JI (1985) Subclinical brain swelling in children during treatment of diabetic ketoacidosis. N Engl J Med 312: 1147-1151. [crossref]
  • Ghetti S, Lee JK, Sims CE, Demaster DM, Glaser NS (2010) Diabetic ketoacidosis and memory dysfunction in children with type 1 diabetes. J Pediatr 156: 109-114. [crossref]
  • Yuen N, Anderson SE, Glaser N, Tancredi DJ, O’Donnell ME (2008) Cerebral blood flow and cerebral edema in rats with diabetic ketoacidosis. Diabetes 57: 2588-2594. [crossref]
  • Wootton-Gorges SL, Buonocore MH, Kuppermann N, et al. (2007) Cerebral proton magnetic resonance spectroscopy in children with diabetic ketoacidosis. AJNR Am J Neuroradiol 28:895-899
  • Salem MA, Matta LF, Tantawy AA, et al. (2002) Single photon emission tomography (SPECT) study of regional cerebral blood flow in normoalbuminuric children and adolescents with type 1 diabetes. Pediatr Diabetes 3:155-162
  • Foster JR, Morrison G, Fraser DD (2011) Diabetic ketoacidosis-associated stroke in children and youth. Stroke Res Treat 2011: 219706. [crossref]
  • Duckrow RB (1995) Decreased cerebral blood flow during acute hyperglycemia. Brain Res 703: 145-150. [crossref]
  • Vavilala MS, Souter MJ, Lam AM (2005) Hyperemia and impaired cerebral autoregulation in a surgical patient with diabetic ketoacidosis. Can J Anaesth 52: 323-326. [crossref]
  • Vavilala MS, Richards TL, Roberts JS, et al. (2010) Change in blood-brain barrier permeability during pediatric diabetic ketoacidosis treatment. Pediatr Crit Care Med 11:332-338
  • Vavilala MS, Marro KI, Richards TL, et al. (2011) Change in mean transit time, apparent diffusion coefficient, and cerebral blood volume during pediatric diabetic ketoacidosis treatment. Pediatr Crit Care Med 12: e344-349
  • Glaser N, Bundros A, Anderson S, Tancredi D, Lo W, et al. (2014) Brain cell swelling during hypocapnia increases with hyperglycemia or ketosis. Pediatr Diabetes 15: 484-493. [crossref]
  • Jaeger M, Schuhmann MU, Soehle M, et al. (2006) Continuous assessment of cerebrovascular autoregulation after traumatic brain injury using brain tissue oxygen pressure reactivity. Crit Care Med 34:1783-1788
  • Lang EW, Czosnyka M, Mehdorn HM (2003) Tissue oxygen reactivity and cerebral autoregulation after severe traumatic brain injury. Crit Care Med 31: 267-271. [crossref]
  • Ma L, Roberts JS, Pihoker C, et al. (2014) Transcranial Doppler-based assessment of cerebral autoregulation in critically ill children during diabetic ketoacidosis treatment. Pediatr Crit Care Med 15:742-749
  • Sloan MA, Alexandrov AV, Tegeler CH, et al. (2004) Assessment: transcranial Doppler ultrasonography: report of the Therapeutics and Technology Assessment Subcommittee of the American Academy of Neurology. Neurology 62:1468-1481
  • Bode H, Eden A (1989) Transcranial Doppler sonography in children. J Child Neurol 4 Suppl: S68-76. [crossref]
  • Bode H, Wais U (1988) Age dependence of flow velocities in basal cerebral arteries. Arch Dis Child 63: 606-611. [crossref]
  • Aaslid R, Newell DW, Stooss R, et al. (1991) Assessment of cerebral autoregulation dynamics from simultaneous arterial and venous transcranial Doppler recordings in humans. Stroke 22:1148-1154
  • Smielewski P, Czosnyka M, Kirkpatrick P, McEroy H, Rutkowska H, et al. (1996) Assessment of cerebral autoregulation using carotid artery compression. Stroke 27: 2197-2203. [crossref]
  • Giller CA (1991) A bedside test for cerebral autoregulation using transcranial Doppler ultrasound. Acta Neurochir 108:7-14
  • Glaser NS, Tancredi DJ, Marcin JP, et al. (2013) Cerebral hyperemia measured with near infrared spectroscopy during treatment of diabetic ketoacidosis in children. J Pediatr 163:1111-1116
  • Roberts JS, Vavilala MS, Schenkman KA, et al. (2006) Cerebral hyperemia and impaired cerebral autoregulation associated with diabetic ketoacidosis in critically ill children. Crit Care Med 34:2217-2223
  • Glaser NS, Wootton-Gorges SL, Marcin JP, Buonocore MH, Dicarlo J, et al. (2004) Mechanism of cerebral edema in children with diabetic ketoacidosis. J Pediatr 145: 164-171. [crossref]
  • Tam EW, Widjaja E, Blaser SI, et al. (2008) Occipital lobe injury and cortical visual outcomes after neonatal hypoglycemia. Pediatrics 122:507-512
  • Vijay K, Agarwal A (2010) Neonatal hypoglycemia resulting in occipital cerebral injury. Pediatr Radiol 40 Suppl 1: S178. [crossref]
  • Mackay MT, Molesworth C, Northam EA, et al. (2015) Diabetic ketoacidosis and electroencephalographic changes in newly diagnosed pediatric patients. Pediatr Diabetes 17:244-248
  • Deeter KH, Roberts JS, Bradford H, et al. (2011) Hypertension despite dehydration during severe pediatric diabetic ketoacidosis. Pediatr Diabetes 12:295-301
  • Nadebaum C, Scratch SE, Northam EA, et al. (2012) Clinical utility of mental state screening as a predictor of intellectual outcomes 6 months after diagnosis of type 1 diabetes. Pediatr Diabetes 13:632-637
  • Northam EA, Anderson PJ, Jacobs R, Hughes M, Warne GL, et al. (2001) Neuropsychological profiles of children with type 1 diabetes 6 years after disease onset. Diabetes Care 24: 1541-1546. [crossref]
  • Cameron FJ, Scratch SE, Nadebaum C, et al. (2014) Neurological consequences of diabetic ketoacidosis at initial presentation of type 1 diabetes in a prospective cohort study of children. Diabetes Care 37:1554-1562
  • Glaser N, Anderson S, Leong W, Tancredi D, O’Donnell M (2012) Cognitive dysfunction associated with diabetic ketoacidosis in rats. Neurosci Lett 510: 110-114. [crossref]
  • Wootton-Gorges SL, Buonocore MH, Caltagirone RA, et al. (2010) Progressive decrease in N-acetylaspartate/Creatine ratio in a teenager with type 1 diabetes and repeated episodes of ketoacidosis without clinically apparent cerebral edema: Evidence for permanent brain injury. AJNR 31:780-781

Reaching Beyond Patient-Centered Medical Home Walls: A Mixed-Methods Evaluation of A Community Health Team Intervention

Abstract

Purpose: To evaluate the structure, processes, and outcomes of a Community Health Team (CHT) intervention for high-risk/high-cost patients of patient-centered medical homes (PCMHs).

Methods: A mixed-methods evaluation wherein survey, interview, and focus group questions were developed from validated measures, Affordable Care Act (ACA) concepts, a literature review, and intervention goals were used. CHT service documentation data was also reviewed.

Results: 334 PCMH patients were identified as high-risk/high-cost and deemed eligible for CHT services. CHTs were successful in connecting patients with diverse services, enhancing patient health self-management and improving quality of life. The CHT intervention was highly valued by patients and PCMH practice providers. The need for explicit policies and protocols, data use agreements, and centralized data warehouse and case management systems was highlighted as potential facilitators of successful CHT implementation.

Conclusion: Areas of excellence, and areas of improvement, were identified and target the CHTs’ ability to address the complex needs of high-risk/ high-cost patients through collaboration with PCMH practices and the broader medical neighborhood. As states develop CHTs to help manage care for chronically ill patients within primary care practices, PCMHs, and medical neighborhoods, we provide recommendations to guide future implementation efforts.

Introduction

In 2001, the Institute of Medicine (IOM) called for a commitment to improve the organization and delivery of healthcare in the United States (US). [1] The IOM report notes that, due to advances in medical science and technology, Americans are living longer and an increase in the incidence and prevalence of chronic conditions has emerged. Despite these changes in the public’s healthcare needs, much of the healthcare system today focuses on acute needs and rewards quantity of services delivered at the expense of higher quality care. [2] As a result, the US has fallen behind other countries in amenable mortality (being the worst of sixteen industrialized nations), [3] ranks poorly on access and safety, [4] and outspends any other nation on healthcare. [5]

A small group of healthcare utilizers consumes a majority of healthcare resources in the US. In 2013, about 1% of the US population accounted for 21% of all US health expenses, and 5% accounted for almost half of all US health expenses. [6] Often patients in that 1% or 5% bracket have complicated health regimens and multiple healthcare providers. For instance, in 2012, of the top 1% of Medicaid health care utilizers, 83% had at least three chronic conditions, and more than 60% had five or more conditions. [7]

Since its passage in March of 2010, the Patient Protection and Affordable Care Act (ACA) [9] has guided healthcare reform. The Patient-Centered Medical Home (PCMH) model for delivery of primary care and collaboration of medical office staff with a Community Health Team (CHT) are important components of healthcare transformation in the US. The CHT, particularly when in concert with the PCMH, has been discussed as holding great promise in addressing the complex needs of these high utilizing patients. [8] The CHT model was designed to provide seamless coordination of preventive health and primary health care with community services to improve patient health outcomes while reducing healthcare costs. CHTs are typically comprised of an integrated group of multidisciplinary staff to address the spectrum of medical and non-medical psychosocial needs of patients with chronic disease conditions using community-clinical linkages. [8] Despite the increasing adoption of CHTs, there is limited information describing CHTs operations or implementation challenges.

Care Transformation Collaborative-Rhode Island (CTC-RI), the oversight organization for the state’s all-payer PCMH initiative, determined that creating a CHT pilot intervention could add needed resources to PCMHs to help meet the complex, multi-faceted needs of high-risk, high-cost patients. CTC-RI received funding from health plans and Rhode Island Foundation, chose a community-based model, and contracted with two RI health care organizations to each host and manage a regional CHT to serve multiple PCMH practices. The goal of CHT services was to improve patient health and quality of life, enhance appropriate use of health care services, decrease use of inappropriate medical services such as ambulatory sensitive emergency department visits, and, ultimately, decrease costs.

This contractual arrangement and corresponding CHT pilot intervention were implemented in Fall 2014. Under this contractual arrangement, each host organization directly hired or contracted for staff, and was responsible for oversight of all CHT staff and functions. Supervisors from each CHT were responsible for their CHT program development and management. Each regional CHT coordinated with PCMH primary care practices to provide services outside of the medical offices for patients who have been identified by health plans to be high-risk and/or high-cost. CTC-RI monitored CHT performance through bi-monthly meetings that were attended by the CHT program managers, health plan representatives, and other key stakeholders. CHT operational issues were presented to this group for problem solving. CTC-RI received monthly invoices from each entity enumerating their activities.

A mixed-methods evaluation of this CHT pilot intervention commenced in Spring of 2015, covering the first year of implementation. This evaluation consisted of a literature review of CHTs and similar programs in the United States and an analysis of quantitative and qualitative data collected from CHT staff, patients served by the CHTs, and participating PCMH practice providers. A primary purpose of this evaluation was to assess the structure, processes, and outcomes of the CHT intervention to inform the consideration of future CHT expansion and implementation efforts. This paper fills a research to practice gap through the presentation of results from the analysis of quantitative and qualitative data collected for evaluation of this CHT pilot intervention.

Methods

The evaluation design consisted of both quantitative and qualitative methods in order to benefit from data using multiple means of inquiry. The Memorial Hospital of RI Institutional Review Board reviewed and approved this study.

Quantitative methods

Service documentation

Prior to commencement of evaluation efforts, CHT administrators and staff documented team outreach and service provision efforts. These data were provided to the authors to better understand the structure, processes, and outcomes of the CHT intervention.

Survey instruments

Drawing from existing surveys, the literature, and our knowledge of the CHT program goals, we created surveys for CHT patients, CHT administrators and staff, and practice staff. Survey items were adapted from validated [10] [11] [12]. Additional items not previously validated were included to address factors unique to the CHT service, and to reflect ACA recommendations for CHT interventions. Subscale scores were created by averaging responses to survey items in a manner consistent with the validated measures [10].

Data management and analysis

Participant consent and survey data were collected and managed using REDCap (Research Electronic Data Capture) electronic data capture tools hosted in the Department of Biostatistics Center for Statistical Sciences of Brown University. Descriptive statistics were analyzed for patient demographics, CHT outreach and service provision efforts, and survey responses. A repeated-measures Analysis of Variance (ANOVA) was conducted to assess differences in survey subscale scores between patients, CHT staff, and practices, while addressing within-participant variability.

Qualitative methods

Instrument development

Qualitative, open-ended question guides were developed for interviews with patients, CHT staff, and NCMs at the participating practices. Interview guides were informed by a literature review targeting the processes identified in other CHT-like programs, and discussions about goals of this CHT intervention with CTC-RI directors, CHT staff, and CHT planning committee meetings.

Data collection

All participants in qualitative interviews and group discussions provided written informed consent. Interviews and group discussions were digitally audio recorded and transcribed verbatim. The evaluation team (MS, MC, RG) attended and facilitated group discussions with each CHT, and two authors (MC, RG) conducted the interviews. A contact referral form was offered to patients currently being seen by the CHT staff. Patients who were interested in participating in an interview provided their name, telephone number and address which were given to the interviewers who then called the patients to schedule an interview. Patients were offered their location of choice for the interview and most of the interviews occurred in patients’ homes.

Analysis of qualitative data

Qualitative data were analyzed using traditional qualitative analysis processes that have, in recent years, been labeled “immersion/ crystallization.” [13] This process entailed individually listening to the audio recordings, reading the transcripts, and taking analytic notes throughout the process followed by group discussion among the authors to explore divergent interpretations and to arrive at final presentation of the findings.

Comparing best practices

We used emerging best practices described by the 2013 Commonwealth Fund Brief, Care Management for Medicaid Enrollees through Community Health Teams [14] to provide a framework for our qualitative findings and recommendations (Table 4).

Results

Quantitative findings

Of 886 patients initially identified by health plans as high-risk/ high-cost, 334 patients were deemed eligible for, and received, CHT services. Across both CHTs, the majority of patients were female, and between the ages of 45 and 64 years. Across both CHTs, the majority of activities the CHT staff engaged in per patient were case management. At the time of evaluation, 152 patients were actively participating in the CHT intervention. Patient recruitment and characteristics by CHT is presented in Table 1. CHT activity by activity category and team is presented in Table 2.

Table 1. Patient recruitment and characteristics, by team.

North South Total
Patient Recruitment Total Patients 481 405 886
Active 67 85 152
Declined 150 75 225
Discharged 93 89 182
In outreach 13 29 42
Ineligible 43 37 80
Not appropriate 44 25 69
Pre-outreach 5 20 25
Unable to contact 61 45 106
Gender Female 111 101 212
Male 49 73 122
Age < 30 18 16 34
30-44 41 18 59
45-64 81 65 146
65-85 16 33 49
86+ 4 12 16

Table 2. CHT activity by activity category and team.

Activity (Counts) North South Total
Care Coordination:

Communication with external entity regarding patient care.

Total 1047 1195 2242
Mean 6.84 10.89
Std. Dev 12.14 8.26
Minimum 1 3
Maximum 103 70
Case Management:

Work directly with/for the patient.

Total 2067 3600 5667
Mean 6.58 25.17
Std. Dev 13.18 26.07
Minimum 1 2
Maximum 163 153
Case Review:

Review, usually with PCMH Nurse Care Managers or Primary Care Provider, covering multiple patients.

Total 59 566 625
Mean 1.23 3.8
Std. Dev 0.47 2.64
Minimum 1 1
Maximum 3 18
Data reflect total counts across all patients, and descriptive statistics per patient.

A sample of patients served by CHTs (n = 22), and all staff from the two CHTs (n = 8) completed surveys to assess their perceptions of the structure, processes, and outcomes of the CHT intervention. Survey response options ranged from 0-4, with greater scores indicating stronger agreement. Response options were identical between participants. Four subscales were created by averaging responses to survey items to reflect Access, Service, Respect, and Outcomes. These subscales are consistent with the Vermont 2013 Mental Health Consumer Satisfaction Survey [10].

A repeated-measures ANOVA was conducted to assess differences in survey subscale scores between patients and CHT staff, while addressing within-participant variability. Subscale means are presented in the results that follow and are displayed in Figure 1. Results suggest average ratings of agreement were significantly greater on the Access (x = 3.53, F(1, 27) = 48.75, p < .001), Service (x = 3.51, F(1, 27) = 49.63, p < .001), and Respect (x = 3.46, F(1, 27) = 39.50, p < .001) subscales when compared to the Outcomes (x = 2.80) subscale. Ratings did not differ between patients and CHT staff (F(3, 81) = 1.150, p = .334).

Figure 1. Subscale scores for patients and CHT staff

Figure 1. Subscale scores for patients and CHT staff

Twenty-one clinicians from 9 PCMH practices completed the survey to assess their perception of the structure, processes, and outcomes of the CHT intervention. Survey response options ranged from 0-4, with greater scores indicating stronger agreement. Response options were identical to those used on the patient and CHT staff survey. The same Outcomes subscale that was used for patients and CHT staff surveys was included in the practice survey.

Results from a repeated-measures ANOVA indicate significant differences in survey item scores (F(49,539) = 3.487, p < .001). Generally speaking, practice survey participants “agreed” with survey items (x =2.94 on 0-4 scale). However, there were 14 survey items for which the practice survey participants rated significantly greater, and/or significantly less than average. Similar to what was found with patients and CHT staff survey results, the Outcomes subscale score was less than other items, though not a statistically significant difference.

Qualitative findings: Patient interviews

We conducted 27 in-person patient interviews—12 served by one CHT in the north of the state and living in urban areas, and 15 served by the CHT in the south of the state living in suburban or rural areas. The majority (56%) of patients interviewed were male, between 46-55 years old (41%), non-Hispanic white (70%), with less than 12th grade education (37%).

Referral for CHT services. The referral process was not clearly evident to patients. Most did not know how they were referred for CHT services, though some knew the referral came from a provider at the PCMH. As one patient noted, “[The NCM] was trying to get me help that I needed.” However, another asserted, “I don’t know. It certainly wasn’t my doctor. My doctor is too overwhelmed to. . .”

Differentiating among sources of services. Patients who received psychosocial services from the CHT as well as from other entities (e.g. health plan case worker; visiting nurse) were confused about the etiology of the services, and whether these services interconnected. While no patient complained about being contacted by too many social service workers, they noted redundancy in service offerings, and appreciated communication between the service providers.

“So I have to make sure the information they have is right. Especially if they’re going to give me more meds they need to know the current meds I have. So a lot of problems I’ve have, with [the CRS] being in touch with some of the other people who work at the hospital as well as my visiting nurses . . . it really helps if they talk all the time and then advise me the next step.”

Services patients received directly from the CHT or with help from the CHT. Patients described commonly delivered services falling into two categories – services provided directly by the CHT, and services that the CHT helped the patients obtain. See Table 3 for details regarding these services.

Table 3. Services provided directly by the CHTs.

Services provided directly by the CHTs Services that CHTs helped patients to acquire.
Explanations of many types of benefits Whatever was needed, as evidenced by the following:
Completion of paperwork for applications and benefits, including the following: “Pointing me in the right direction for just everything. I mean, supplies and just food and financial and just whatever I would need was amazing to me. Like if they didn’t know somebody, they knew somebody that knew somebody.”

“I pleaded with the electric company. ‘My mom will die without her oxygen. What am I supposed to do?’ And they’re like, ‘Not our problem.’ So I called [CHT staff]. I was basically panicking. And she was like, ‘Nope, just let me handle it.’ And she just called them, and twenty minutes later the guy was right back—turned it right back on.”

Housing

Health insurance

Financial

Social security

‘Welfare’

‘Food stamps’

Long-term disability

Medication assistance

Coaching to deal with medical system and speak to providers, as evidenced by the following:
“Without [CHT], I wouldn’t have been as extroverted in being able to just speak out and say, ‘Hey listen, I’m having a problem with not knowing this information.” Psychological and substance use counseling, as evidenced by the following:
“[CHT staff] just called all kinds of therapists until she could find one that had an opening that would take me because they’re all, ‘Oh we’re not taking new clients.’”
Home contact following emergency department visit or hospitalization
Emergency department avoidance strategies Food
Information from clinicians Clothing
Food Furniture
Clothing Appropriate medical and mobility equipment
Blankets Nutrition information
Individual and marital counseling Adult day care
Encouragement to ask for help, as evidenced by the following: Parenting classes
“You sort of get old, and you don’t realize you’re there already and all these things are available to you. I’ve never in my life asked for help from anybody.”

“An my right knee still buckled up from under me a lot. So she said, ‘I don’t like that; you need a CNA in here. Do you have one?’ I says, ‘No, I don’t. I’m trying to do everything myself.’”

At home CNA services
Legal representation
Affordable medication
Safer and/or cleaner housing
Transportation
Medical information
Medical appointments
Moral support and anxiety reduction through the following: Benefits
Home visits

Phone calls

Preparing patients for medical visits

Accompanying patients at medical and legal appointments.

Resources for family members
Utilities payment assistance

Patients’ attitudes towards interacting with the CHT staff. All patients were pleased with their interactions with the CHT staff. They found staff to be “pleasant”, “friendly”, “helpful”, “motivated”, “energetic”, and to go to great lengths to locate and secure the resources that the patients needed. Many described the CHT staff to be informative, providing guidance without being too “directive” or “pushy”. Along with logistical help with critical problems that patients received from the CHT staff, patients placed high value on the moral support they experienced from interacting with CHT staff. All patients felt they could call upon the staff whenever they felt it to be necessary. In addition to the concrete provision and referral for services, CHT staff filled a gap in many patients’ lives in terms of having someone who will listen to them and who cares about them. This was evident even for patients who described having good relationships with nearby family members who also helped them. Patients stated, “She [CHT staff person] cares about me;” “It helps me feel a little secure and stuff like that because I know [CHT staff person] is right there to help me if I need help.” “They give me some new point of view too. That’s important. I didn’t think of that – my problems are not unique which we all think they are.” “She’ll come out. She’ll sit here. She’ll talk to me. We laugh together and everything.”

“The best thing is to still know that somebody would listen to you, and that you’re not alone, that even though . . . no one cares about what you’re going through, but then all of a sudden [CHT staff] walk in the door asking you how you are, asking you ‘What can we do to help you because you’re not happy?’ And to have them appear at your doorstep is just something to show that there’s somebody out there that still cares, that’s willing to help you. And if they can’t help you they’re going to find somebody that will.”

Qualitative findings: CHT staff and PCMH practice nurse care managers (NCMs)

Each CHT participated in focus groups at the beginning and end of the evaluation. From the two CHTs combined, data were collected from 8 non-manager staff, 1 data analyst, 1 CHT manager, and 1 CHT consultant manager. We also conducted individual qualitative interviews with 4 NCMs working at PCMH practices participating in the CHT pilot intervention. These qualitative findings are outlined using practices described in the 2013 Commonwealth Fund Brief, Care Management for Medicaid Enrollees through Community Health Teams [14] as a structure. Table 4 provides a summary of these findings.

Table 4. CHT pilot intervention features as outlined according to the 2013 Commonwealth Fund Brief, Care Management for Medicaid Enrollees through Community Health Teams.

Feature Description CHTs
Multidisciplinary teams ·         Coordinate services

·         Promote self-management

·         Help manage medications

·         Teams have community resource specialists and behavioral health staff. Many CHTs nationally include a broader range of staff, e.g., health educators, dieticians, pharmacists.

·         CRS promote self-management as indicated by care plan goals.

·         Teams coordinate services to the extent they are able. CHT staff may not know if other care managers or other agencies are working with patients. There are no or ad hoc processes to determine who takes the lead or for sharing responsibilities.

·         CHTs do medication reconciliation, e.g., review medications on hand with medication lists. They help patients obtain prescriptions.

Sustained continuous relationships with patients ·         Team staff establish and cultivate relationships through regular face-to-face contact ·         Both CHTs focus on face-to-face contact. However, if the primary service is getting patients linked to services, contact is more likely to be telephonic.

·         Patients can be unclear as to the frequency of CHT contact (in person or telephonic).

Communication mechanisms ·         Mechanisms are in place to routinely send and receive information about patients ·         Mechanisms are in place (inconsistent access to the patient record, phone, email, in person), but they do not represent best practices. In part, this is due to lack of data sharing agreements, and largely due to lack of a centralized data infrastructure. The CHTs do the best they can with the resources they have.
Whole-person care ·         When patients are identified as high-risk, high-need, or high-cost ·         CHTs focus on high-risk, high-cost patients, but practices may want to refer just high need. Payer algorithms are not consistent.

·         The CHT assessment process identifies patient needs in order to provide whole-person care. Providing whole-person care is a CHT strength and best practice.

Transitions in care ·         Focus on transitions in care, especially between hospital and home ·         CHTs currently do not have an alert system for notification when a patient in the hospital or ED. This limits their ability to focus on transitions.
Connection to community resources ·         Team members routinely connect patients with relevant community-based resources ·         This is an area of strength and high performance
Enhanced reimbursement ·         Enhanced reimbursement for primary care teams that collaborate with teams ·         Not addressed
Team functions and composition ·         Care coordination and management services ·         The CHTs provide care management services. They are less likely to provide care coordination services between health care providers.

·         CHTs help patients make appointments, and attend appointments with patients as needed. However, this is a supportive role rather than a coordination role.

Multidisciplinary teams coordinate services, promote patient self-management and help patients manage medications. CHT staffing totaled 7.5 FTEs and included team managers/coordinators, community resource specialists (CRS), behavioral health staff that included a behavioral health nurse and a licensed clinical social worker, and a data analyst. CHTs stated the primary care physician and nurse care manager (NCM) oversee and coordinate the patient’s healthcare. NCMs reported believing it was their responsibility to provide health education to encourage patient self-management, and indicate such in the patient’s care plan. The CHTs described efforts to support this patient health self-management. CHTs stated they reconciled medication by ensuring medications in the home match the patient’s health record medication list. As needed, CHTs also helped patients to obtain prescriptions. Respondents also noted the CHT behavioral health staff was crucial in helping patients locate and receive appropriate behavioral health services. In turn, the receipt of behavioral health services helped patients become more capable of addressing their health issues.

“Well one thing that might be helpful is now that we’ve done it for a while…the specific roles…to outline those specifically because when we first started it was kind of a generalized concept. But to have the specific role such as the social worker can do this, this and this; the community outreach worker can do this, this and this. These are their resources. These are services that they can offer your patients at no cost to theyou know, those kinds of things. It was generalized for us, but it wasn’t in detail.”

CHTs and NCMs expressed confusion about roles and responsibilities. Some NCMs stated it would be helpful to have roles and responsibilities clearly defined through written materials.

Sustained continuous relationships with patients. CHTs noted the assessment and care planning process formed the basis for developing long-term relationships with patients. CHT CRS and/or the Behavioral Health staff stated having initial face-to-face contact with patients who agreed to participate in the CHT service. Although CHTs developed a care plan and goals with the patient at initial meeting, they described completing follow-up assessments for only a minority of patients. Once care plan goals were met, CHTs reported calling patients periodically for follow-up. CHTs reported most ongoing contact with the patient occurred through encouraging patients to call.

Communication mechanisms are in place to routinely send and receive information about patients. CHTs noted regular communication with NCMs by phone, email, monthly meetings, and notes in the patient record (where permitted) to understand the patient’s needs, to provide updates, and to address crises that arise. Additionally, CHTs regularly held clinical team meetings with the NCMs and other practice staff to discuss patient progress and readiness for discharge. CHTs claimed NCM buy-in was crucial for effectively working with the practice. One NCM described a successful collaborative effort to help a patient avoid an emergency department visit:

“That CHT person was checking in. And [the patient] had multiple clinical issues that she thinks she should go to the ER for. And [the CHT] communicated with us again. They said, ‘Well, this is what’s happening now.’ And so we were able to bring her in [to the clinic]. So kind of like a back and forth we’re working here to advocate for [patients] with the clinic, but they’re out there in the field, and they can see what’s going on in the home. And that communication piece is pretty crucial with keeping [patients] out of the hospital.”

CHTs asserted a barrier to communication was the lack of appropriate authorization allowing the sharing of patient protected health information (PHI). As a result, the CHTs could not receive or discuss patient PHI directly with the health plans. Additionally, CHT staff could not access patients’ electronic health records. CHTs described this as problematic for getting patient contact information, understanding the scope of the patient’s health problems, and in communicating with practices. Business associate agreements were later established in 2016 to authorize the sharing of patient PHI.

CHTs provide whole-person care when patients are identified as high-risk, high-need, or high-cost. All respondents described this is an area of strength for the CHT pilot intervention. One NCM stated, “somebody in healthcare taking the time to listen, to hear and to help that patient set their own agenda as opposed to agenda that the physician or even myself might have.” However, there were varying definitions for what constituted high-risk, high-need, or high-cost. Since practices work with multiple payers, and payers used different patient identification algorithms, there was some confusion about what constituted a high-risk, high-cost patient. NCMs at times referred patients with immediate needs, such as referral for food stamps, rather than patients who met the CHT program guidelines. Some respondents hoped practices could make referrals, rather than using health plan generated high-risk lists. These respondents reported believing doing so could prevent patients from becoming high-risk/high-cost.

There is a focus on transitions in care, especially between hospital and home. CHTs reported relying on NCMs, or the patient, for notification regarding a patient’s pending, current, or recent past hospitalization or emergency department use. Upon receiving notification, CHT staff worked with the patient to ensure s/he understood the discharge care plan, and helped arrange for needed services. CTC-RI implemented a formal alert system in 2016.

Team members routinely connect patients with relevant community-based services. All respondents stated this is an area of strength and high performance. NCMs reported CHTs were skilled at ferreting out resources, though both CHTs described difficulty with referrals due to a lack of affordable housing, reliable transportation systems, and limited detox beds and/or sober housing placements. The CHT behavioral health staff was described as crucial in helping patients locate and receive appropriate mental health or substance use disorder services. Respondents noted as patients’ behavioral health needs stabilized, patients became more capable of addressing their health issues.

“I would say that certainly some of our users [patients] have behavioral health issues. And the direct interaction with the CHT has been the impact. Some of those patients have gotten the behavioral health interventions that they needed—counseling, hospitalization, medications. So without the CHT we were, I personally was, failing at addressing the needs of these patients. I could not do it.”

However, CHTs reported needing more in-home behavioral health resources, particularly for remote portions of the state or for homebound patients.

CHTs provide care coordination and care management services. CHT staff noted it was sometimes difficult to facilitate coordination since state and local agencies often did not know about the CHT service. CHTs reported this difficulty often resulted in service redundancy and confusion for the patient.

Discussion

Survey results suggest that patients and CHTs feel that patients have access to CHT services, the CHT intervention is helpful, and patients are treated with respect. While ratings on the Outcomes subscale were generally strong, patients and CHTs did not feel as strongly that the CHT pilot intervention resulted in improvements in physical/mental health, symptom distress, or functioning. PCMH practice providers similarly rated the Outcomes subscale items less than other items, though this was not a statistically significant difference.

Results from patient interviews indicated patients are universally satisfied with their interactions with the CHTs, and with the services CHTs provide for them. The scope of services that CHTs help patients with is broad, addressing a variety of psychosocial needs. Satisfaction was also often linked to CHT’s presence for listening to patient problems, providing support, and discussing a myriad of issues that directly impact patients’ health, emotional stability and quality of life.

Focus groups and interviews with CHT staff and PCMH practice NCMs highlighted the CHT pilot intervention’s positive impact on patients by helping to stabilize their physical/mental health, psychosocial needs, and access their relevant entitlements such as disability benefits or food stamps. Some also noted a reduction in inappropriate healthcare use. We found many areas of excellence, including the quality of CHT and NCM relationships, CHT’s ability to address patients’ multiple challenges, and the case review process. Structural and procedural targets for improvement include the need for clear policies and protocols, data use agreements, a data warehouse or repository, and a centralized case management system. There also appears to be opportunities to consider leveraging the motivation, skills and enthusiasm of the CHT staff and expand CRS’ responsibilities.

A primary purpose of this evaluation was to assess the structure, processes, and outcomes of the CHT intervention to inform the consideration of future CHT expansion and implementation efforts. As states to develop CHTs to help manage care for chronically ill patients within primary care practices, it is worthwhile to consider lessons learned from this CHT pilot intervention to guide future local and national implementation efforts. See Appendix 1 for lessons learned and recommendations for CHT program design based upon this evaluation of the pilot CHT intervention with regard to CHT structure, patient identification and selection for CHT services, CHT functioning, and collaboration between the CHT, PCMH primary care practices, and health plans.

Conclusion

The CHT pilot intervention has achieved numerous successes and overcome a variety of obstacles since its inception. Considering lessons learned from this pilot will allow the design of an expanded CHT intervention that effectively leverages CHT staff members’ skills, experience, and commitment to achieve improved patient health and experience at reduced cost.

Appendix

Recommendations for Community Health Team
Program Design and Implementation

Below we discuss lessons learned and recommendations for CHT program design based upon this evaluation of the pilot CHT intervention with regard to CHT structure, patient identification and selection for CHT services, CHT functioning, and collaboration between the CHT, PCMH primary care practices, and health plans.

CHT structure

Findings from this evaluation identified confusion experienced by CHTs, PCMH practice providers, and patients regarding the roles and responsibilities of the CHT program. Participants stated it would be helpful to have roles and responsibilities clearly defined through written materials. As a result, we recommend clearly detailed roles and responsibilities be established and disseminated prior to implementation. Specifically, we recommend universal, detailed, transparent policies and procedures for all aspects of the oversight entity’s and CHTs’ workflow and functioning, and that these policies and procedures be communicated to all relevant stakeholders prior to implementation of CHT services. Additionally, we recommend the creation of CHT services and outreach documentation procedures and categories for use across multiple CHTs. This process has been started in this pilot; we suggest building upon previous work to create a systematic approach to be used consistently across CHTs.

Best practices from successful care management programs call for establishment of a central program office to coordinate activities, monitor progress, and help stakeholders reach their goals. While this pilot rolled out with a focus on regional development to meet regional needs, it is recommended that centralized coordination be reinforced, and a staff person dedicated to this role would be identified.

To facilitate consistency across CHTs, centralized coordination, as well as enhanced communication between appropriate stakeholders, we also suggest the establishment of a centralized data warehouse or data repository, a single electronic care management system to be utilized across CHTs, as well as the establishment of business associate agreements to authorize the sharing of patient PHI. The absence of these features was discussed by many evaluation participants as a significant barrier to effectively providing coordinated care for CHT patients. Inconsistent access to the patient record served as a barrier to routinely sending and receiving information about patients, and a barrier to facilitating transitions in case especially between the hospital and home.

With regard to the development of CHTs, this pilot intervention evaluation highlighted the appreciation for behavioral health staff in addressing the many mental health needs of their patients. Many CHTs nationally include a broader range of staff that include health educators, dieticians, pharmacists, etc. The inclusion of staff members on CHTs from a variety of disciplines can enhance the CHTs reach to better address the needs of their patients.

Patient identification and selection for CHT services

For this CHT pilot intervention, CHTs and PCMH practices worked with multiple payers. Each payer used a different algorithm for identifying high-risk, high-cost, patients. At times, PCMH practice providers referred patients to the CHT program with immediate needs, rather than adhering to the payers’ high-risk, high-cost, lists of patients. Evaluation participants hoped PCMH practices could make referrals to the CHT program in prevent patients from becoming high-risk/high-cost. As a result, we recommend a standardized identification of eligible, appropriate, and impactable patients for CHT services, with mechanisms for practice NCMs and other providers to be integral to the referral process.

CHT functioning

To limit confusion patients’ confusion regarding the CHT program’s roles and responsibilities, several recommendations emerged from evaluation participants. These recommendations include enhanced efforts to increase patients’ understanding of the role of the CHT and care planning through repeated conversations about available and appropriate CHT services, and to communicate to patients how contact will be maintained with the CHT at each stage of service. Additionally, enhanced coordination between CHTs and other sources of case management provided to patients by different stakeholder organizations is recommended to reduce redundancy in services, and better define responsibilities of each source of service to the patient.

In this CHT pilot intervention, CHTs reported having developed care plans and goals with patients at an initial meeting, but only completing follow-up assessments for a minority of patients. Typically, once care plan goals were met, minimal communication continued between CHT staff and patients. As a result, we recommend the institution of a protocol for follow-up with patients after initial critical issues are addressed. This can better ensure ongoing recognition of patients’ conditions over time.

Participants in this CHT pilot intervention evaluation also expressed a desire to enhance communication and collaboration between CHT teams. They reported beliefs that CHTs have much to learn from each other, and having a format such as all-staff CHT meetings could facilitate the sharing of best practices, as well as the identification and resolving of issues common to all teams. Additionally, having a forum in place for all CHT staff members across teams to attend can also facilitate the creation, maintenance, and sharing of geographic and language-specific community resource lists.

Collaboration between the CHT, PCMH primary care practices, and health plans

Results from this evaluation highlighted the importance of ongoing collaboration between PCMH practice NCMs and CHTs. Strong relationships were reported to contribute successful coordination and delivery of care. As such, we recommend the establishment of explicit mechanisms to ensure optimal ongoing communication between CHTs and NCMs and other providers in participating practices. Similarly, we recommend the establishment of a forum for CHTs to regularly communicate patient successes back to the practices.

Results from this evaluation also highlighted the importance of ongoing communication between CHTs and the health plans. Insurers need to know which beneficiaries are receiving CHT services, and CHTs need access to patient PHI. Appropriate authorizations allowing the sharing of patient PHI between the CHTs and the health plans were not in place during this evaluation, but established later in 2016. Quarterly reports to health plans on CHT performance have also been planned to enhance communication. We recommend ensuring that these authorizations are established prior to implementation.

References

  • Committee on Quality of Health Care in America, Institute of Medicine (2001) Crossing the quality chasm: A new health system for the 21st century, Washington, DC: National Academy Press.
  • Bitton A, Martin C, Landon B (2010) A nationwide survey of patient centered medical home demonstration projects. Journal of General Internal Medicine 25:584-592.
  • Nolte E, McKee M (2011) Variations in amenable mortality–trends in 16 high-income nations. Health Policy 103: 47-52. [crossref]
  • Barr MS (2008) The need to test the patient-centered medical home. Journal of the American Medical Association 300: 834-835.
  • Findley S, Matos S, Hicks A, et al. (2014) Community health worker integration into the health care team accomplishes the triple aim in a patient-centered medical home: A Bronx tale, Journal of Ambulatory Care Management 37: 82-91.
  • Cohen S (2013) Differentials in the concentration of health expenditures across population subgroups in the U.S., 2013. Statistical Brief #480. September 2015, Agency for Healthcare Quality and Research: Rockville,
  • Cohen S (2014) Differentials in the concentration of health expenditures across population subgroups in the U.S., 2012. Statistical Brief #448, in Rockville, MD. September 2014: Agency for Healthcare Quality and Research.
  • Losby JL, House MJ, Osuji T, et al. (2015). Initiatives to enhance primary care delivery: two examples from the field. Health Services Research and Managerial Epidemiology, 2, Patient Protection and Affordable Care Act, 42 U.S.C. § 18001 et seq.
  • Harrigan E, Leno SM (2014) Consumer evaluation of community rehabilitation and treatment programs in Vermont: FY2013, Technical Report. Vermont Agency of Human Services Department of Mental Health Research and Statistics
  • Lesselroth BL, Holahan PJ, Adams K, et al. (2011) Primary care provider perceptions and use of a novel medication reconciliation technology. Informatics in Primary Care 19: 105-118.
  • Torrence ND, Mueller AE, Ilem AA, et al. (2014) Medical provider attitudes about behavioral health consultants in integrated primary care: A preliminary study. Families, Systems, and Health 32: 426-432.
  • Borkan J (1999) Immersion/Crystallization. In Crabtree B, Miller W (eds). Doing Qualitative Research, 2nd Edition 179-194. Thousand Oaks, CA: SAGE Publications.
  • class=”h3 Orange”>Takach, M and Buxbaum J (2013) Care management for Medicaid enrollees through community health teams. 2013, The Commonwealth Fund: Washington, DC.

Activation of STAT3 and its impacts on Proteasome Inhibitor-Induced Apoptosis in Laryngeal Sqaumous Carcinoma

Abstract

Laryngeal squamous carcinoma (LSC) represents one of the refractory malignant tumors of head and neck squamous cell carcinoma (HNSCC), leading to high patient mortality and unsatisfactory overall 5-year survival. New therapeutic targets and modalities for effective chemoprevention and treatment are required to improve the survival of patients with LSC. Evidence from previous studies has suggested that proteasome inhibitors (PIs) possess effective antitumor activity and have been approved by the United States Food and Drug Administration (FDA) to treat myeloma. However, resistance of myeloma to PIs has been reported, which prevents PIs from their clinical uses in cancer treatment. So far, the underlying mechanisms of tumor cells anti-PIs effects remain unclear. In the present study, we found that constitutive activation of signal transducer and activator of transcription 3 (STAT3) was associated with clinicopathlologic factors in LSC patients, and persistent activation of STAT3 was found in Hep-2 laryngeal carcinoma cells. Moreover, we demonstrated that proteasome inhibitor MG-132 induces apoptosis and cell cycle arrest in Hep-2 cells, accompanied by increased activation of STAT3; knockdown of STAT3 expression by shRNA or application of STAT3 inhibitor AG490 potentiates the antitumor effects of MG-132 in vitro, which is attributed to the down-regulation of cyclin D1 and Bcl-2. Taken together, we identified that STAT3 activation plays a great role in therapeutic resistance to PIs in LSC; blocking STAT3 activation could potentiate the tumor killing effects of PIs in LSC or other malignancies involving STAT3 activation. Combined application of PIs and STAT3 inhibitor may implicate a promising strategy for managing LSC or even other HNSCC.

Keywords

Signal transducer and activator of transcription 3, STAT3; proteasome inhibitor; STAT3 inhibitor; laryngeal carcinoma; apoptosis

Introduction

Laryngeal squamous carcinoma (LSC) is a kind of head and neck squamous cell carcinoma (HNSCC), the latter of which ranks the sixth most common malignant cancer, and accounts for 35,00000 newly diagnosed cases annually worldwide [1]. Despite of successive advancement in diagnosis and treatment, the overall survival of HNSCC has just been slightly improved in recent years. In addition to distant metastasis and relapse, resistance to traditional therapeutic modalities has been the dominant cause of treatment failure, especially in advanced cases. For combating the therapeutic resistance of cancers, some novel concepts and strategies for targeted therapies have been introduced, most of which mainly focused on some key modulators of cell proliferation and apoptosis pathways. Although some preliminary results have been achieved, they are not as effective as expected.

Signal transducer and activator of transcription 3 (STAT3), a member of STAT family, is a focus of many oncogenic receptor tyrosine kinase pathways, such as EGFR, IL-6/JAK and Src [2]. It has been demonstrated that STAT3 can induce up-regulation of prosurvival proteins including Bcl-2, Bcl-xL, survivin and Mcl-1, and promote expression of angiogenesis factors, such as VEGF [3]. In fact, STAT3 is constitutively activated in many tumors [4-7] and plays a great role in proliferation, cell cycle progression and apoptosis of tumor cells [8]. In addition, activation of STAT3 is also associated with chemoresistance in many malignancies [9, 10]. Results from our previous study demonstrate that knockdown of STAT3 with specific shRNA can enhance radiosensitivity in LSC Hep-2 cells both in vitro and in vivo [11, 12]. Therefore, targeting STAT3 is a potential therapeutic strategy for LSC.

As is known, due to rapid proliferation and insufficient blood supplies, the microenvironments of most solid cancers are accompanied by hypoxia, glucose starvation and low PH, leading to endoplasmic reticulum (ER) stress due to causal accumulations of incorrect proteins [13]. Sequently, cancer cells must adapt to these unfavorable conditions for their survival via inhibiting synthesis of proteins and degrading unfolded proteins accumulated in ER by proteasome [14]. Therefore, targeting proteasome becomes a promising strategy for cancer therapy.

Early studies demonstrated that tumor-inhibiting effects of proteasome inhibitors (PIs) are attributed to repression of nuclear factor-κB (NF-κB) signaling and regulation of proteins associated with both cell cycle and apoptosis, such as p27Kip1 [15], p21cip/WAF1 [16], p53 [17], Bcl-2 [18, 19], Bax [17], Bim and Bik [20]. It is now believed that PIs induce ER stress-related cell death through unfolded protein response (UPR) [21] and confer preferential cytotoxicity towards hypoxic tumor cells [22]. However, cases of resistance to PIs are emerging, whereas the related mechanisms are not systematically elucidated [23]. Interestingly, a recent study has demonstrated that a proteasome inhibitor Bortezomib promotes STAT3 activation in HNSCC, suggestive of potential roles of STAT3 in the resistance of HNSCC to the proteasome inhibitor [24]. Therefore, it would be of great interest to elucidate whether the STAT3 plays a role in resistance LSC to PIs.

In the present study, we first assessed the associations between constitutive activation of STAT3 and clinicopathlological factors in LSC. We next investigated the role of STAT3 activation by protesome inhibitor and its impacts on proteasome-induced cell apoptosis in LSC.

Materials and Methods

Patients’ data

50 LSC patients (36 males and 14 females) who received surgical resection at Bethune International Peace Hospital were recruited, and their complete detailed clinicopathologic data were collected. Of the 50 cases, there were 17 cases of supraglottic and 34 cases of glottic cancers. The age of the present series ranged from 36 to 86 years, with a mean age of 58 years. All patients had undergone neither chemotherapy nor radiotherapy prior to surgery. According to UICC cancer staging system (2002), there were 7 cases of stage I, 6 cases of stage II, 17 cases of stage III and 20 cases of stage IV tumors. With regard to the histological grading, 6 cases were well differentiated, 13 cases were moderately differentiated and 31 cases were poorly differentiated squamous cell carcinomas (SCC). Twenty-two cases had neck node metastasis as proven by postoperative pathologic examinations.

Tumor tissue collection

With the informed consent of all patients, tissue specimens were collected immediately after surgical removal. Paired tumor-free paracancerous tissues (PCT) were taken at least 0.5 cm beyond the tumor margins. Each sample was cut in halves. One half was promptly frozen at -70 ℃ for subsequent Western blot, while the other was fixed immediately with 10% neutrally buffered formalin for histopathologic evaluation and immunohistochemistry. The acquisition of paraffin tissues and frozen specimens were approved by the Institutional Review Boards at Bethune International Peace Hospital. Neck dissection specimens were evaluated by two pathologists to confirm the status of neck node metastasis in these patients.

Immunohistochemistry and immunocytochemistry

Immunohistochemical and immunohistocytochemical studies were performed as described previously [25] using SP-9002 kit (including 0.3% hydrogen peroxide, 10% goat serum, biotinated secondary antibodies and horseradish peroxidase marked strepto- antibiotin, Zhong Shan Jin Qiao, Beijing) with some modifications. Briefly, for immunohistochemistry, consecutive sections were deparaffinized and hydrated, and subjected to 0.3% hydrogen peroxide for elimination of endogenous peroxidase at room temperature for 10 min. Slides were then heated for the retrieval of antigens in an autoclave sterilizer for 2 min. Goat serum (10%) was added to block nonspecific protein staining for 10 min. The sections were incubated with anti-STAT3 and anti-p-STAT3 (Santa Cruz Biotechnology Inc.) at 4 ℃overnight. Afterwards, they were rinsed by PBS and incubated at room temperature with biotinated secondary antibodies for 15 min under a humid condition followed by 15-min incubation with horseradish peroxidase-marked strepto- antibiotin at room temperature. Finally, they were detected with DAB kit (Zhong Shan Jin Qiao, Beijing). The immunoreactivity of STAT3 or p-STAT3 was evaluated as described previously [31]. Brown coloration was identified as positive staining. The distribution of positive staining cells was classified in 4 categories: weakly positive (+), positive (++), strongly positive (+++), and negative. For immunocytochemical study, Hep-2 cells were seeded in 6-well plates with a small cover slide in each well. When confluence reached 70% to 80%, cells grown on the cover slide were fixed with cold acetone at room temperature for 15 min. Cover slides were then subjected to 0.3% hydrogen peroxide for elimination of endogenous peroxidase at room temperature for 30 min, washed with PBS and permeabilized with 0.1% TritonX-100 on ice for 2min. The immunostaining of Hep-2 cells was performed as in immunohistocehmistry.

Cell line and culture

Hep-2 human LSC cell line (National Cancer Institute, USA) were cultured in RPMI1640 medium supplemented with 10% fetal bovine serum (FBS) under the condition of 37℃, 20% O2, 5%CO2, 95% humidity in a CO2 incubator. Cells were allowed for attachment overnight and those grown in logarithmic phase were used for subsequent experiments. All experimental groups came from the same parental cells. Cells were passaged every 2 to 3 days to maintain exponential growth.

Transfection of plasmids

The construction of STAT3-targeting shRNA expression vector and the transfection of plasmids were performed as our previous publications [12]. Briefly, the double strands of shRNA targeting gene of STAT3 (sense: 5′-CACCGCAGCAGCTGAACAACATGTTCAAGAGACATGTTGTTCAGCTGCTGCTTTTTTG-3′, the corresponding mRNA coding region is underlined) and the double strands of negative control gene (sense: 5′-CACCGTTCTCCGAACGTGTCACGTCAAGAGATTACGTGACACGTTCGGAGAATTTTTTG-3′, underline shows the target sequence) were inserted into pGPU6/GFP/Neo vector (Gene Pharma Co., Ltd), and named pGPU6/GFP/Neo-shSTAT3 and pGPU6/GFP/Neo-shNC, respectively. The procedure of transient transfection was performed according to LipofectamineTM2000 (Invitrogen, Corporation) manufacturer’s instructions in 96-well plates or/and 6-well plates. The thansfection efficiency was monitored by observation under a fluorescent microscope and by flow cytometry. Sequent assays were performed 24 hours after transfection.

MTT assay

The inhibition of hep-2 cells by chemicals was determined by MTT assay as described previously [26]. Transfected and untransfected hep-2 cells were subjected to MTT assay. After treatments with PIs (MG-132) (MERCK Corporation, Germany) and STAT3 inhibitor (AG940) (Sigma, USA) in different combinations and cisplatin (DDP, Shan Dong Qi Lu Pharmaceutics, China), 20μl 3-(4, 5-dimethylthiazol-2-yl)-2, 5-diphenyltetrazolium bromide (MTT, 5mg/ml, Sigma, USA) were added into each well of 96-well plates. After incubation at 37 ℃ for 4h, culture medium was replaced by DMSO to dissolve formazan for coloration. Absorbance was measured at 490 nm using Enzyme-linked Immunosorbent Detector (Model 550, Bio-Rad, USA).

Flow cytometry

The transfection efficiency, apoptosis rate and cell cycle distributions were determined by a FACScan analyzer (Becton Dickinson FAC Sort, USA). Hep-2 cells, with or without treatments, were collected after trypsinization. Fresh cells were used for detection of the efficacy of transfection by flow cytometry. To determine apoptosis rate and cell cycle distribution, cells were washed by PBS for 3 times, and then were fixed with 75% ethanol overnight at 4 ℃. Prior to analysis, ethanol was discarded and 80μl RNase (final concentration: 50mg/L) and 150μl propidium iodide (final concentration: 50mg/L, Sigmar, USA) were used for staining of DNA for 30 min at 4℃. Apoptotic cells appeared as a magnitude of the sub-G1 peak due to nuclear fragmentation and loss of DNA.

Western blot

Western blot was carried out as described previously [25] with minor modifications. For tissue specimens, lysates were obtained from 100mg sample of each frozen tissue by a homogenizer. Subjected Hep-2 cells were harvested following trypsinization and centrifugalization. The cell pellets were resuspended in cell lysis buffer containing 500mM HEPES 25ml (0.1mol/L),100mM NaCl 5ml (1mol/L),2mM EDTA 0.2 ml (0.5mol/ L),sodium deoxycholate 0.25g (0.5%),NP-400 5ml (1%),10%SDS 0.5ml (0.1%),2×10-3 mol/L PMSF and 2×10⁻⁶ g/L Lupeptin to collect lysates. Subsequently, lysates originating from tissues or hep-2 cells were acquired in the same way. After determination of protein concentrations in the lysates, equivalent protein (100mg from tissues or 30mg from cells) were separated by electrophoresis on 4% to 10% SDS-PAGE gels. The subjected gels were then transferred onto nitrocellulose filters, and blocked in confining liquid containing 1% nonfat dry milk, 0.02% Tween-20 (Sigmar, USA), 10mmol/LTris-Cl,0.15mmol/L NaCl at 4℃ overnight. The blocked filters were incubated with primary antibodies (Santa Cruz Biotechnology int and Cell Signaling Technology, USA) at 4℃ overnight followed by rinse in TBST. The filters were incubated with secondary antibodies marked by HRE (Zhong Shan Jin Qiao, BeiJing) at room temperature for 1 hour followed by rinse in TBST two times. Finally, the blots were visualized by ECL kit (Pierce, USA).

Statistical analysis

Results were analyzed for statistical significance with the use of SPSS 13.0. Data were presented as mean values ± SD. The method of statistical analysis included student’s t-test for comparision of two groups, one-way ANOVA for comparison of more than two groups combined with or without least significant difference (LSD) followed for comparison of each two groups, and Pearson correlation analysis for correlation evaluation of different factors. P < 0.05 was considered significant.

Results

Constitutive activation of STAT3 is associated with clinicopathlological factors in LSC, including clinical stage, pathological grading and cervical lymph node metastasis. It has been reported that STAT3 is aberrantly activated in many tumors in comparison with its transient activation in normal tissues [27-30]. To determine activation status and expression distribution pattern of p-STAT3 in LSC, we compared levels of p-STAT3 protein of primary LSC tissues with corresponding tumor-free PCT by immunohistochemistry. As can be seen in Fig 1A-D, p-STAT3 was constitutively expressed in LSC compared with PCT. In positive samples, weakly positive staining dominates PCTs, whereas strong positive coloration occupies most of cancer tissues; it was also noted that the staining of p-STAT3 in poorly differentiated LSC is stronger than that in well differentiated LSC.

CST 2017-204_fig_1

Figure 1. The expression of phosphorylated STAT3 (p-STAT3) in human laryngeal squamous cell carcinoma (SP×400). Tissue specimens were collected and p-STAT3 protein expression levels were assessed by immunohistochemistry and western blot. A. Expression of STAT3 in well-differentiated laryngeal squamous carcinoma. B. The expression of p-STAT3 protein in moderately-defferentiated laryngeal squamous cell carcinoma (SP×400). C. The expression of p-STAT3 protein in poorly differentiated laryngeal squamous cell carcinoma (SP×400). D. The expression of p-STAT3 protein in tumor-free paracancerous laryngeal epithelial tissues (SP×200). Yellow arrow indicates representative staining cells. E. Expression of Stat3, p-STAT3, and cyclin Dl in human laryngeal carcinoma by western blot. Elevated levels of p-STAT3 and cyclin Dl in tumor tissues (T) compared to adjacent normal laryngeal mucosa (N) were further confirmed.

These findings suggest that STAT3 is activated constitutively and persistently in LSC rather than in PCT, and its activated form, p-STAT3, is likely to function in nucleus as in other malignancies. Moreover, expression of p-STAT3 is closely related to the expression of cyclin D1. Results from western blot analysis showed the same expression pattern for each protein (Fig 1E) in that there is a correlation between p-STAT3 and the expression of cyclin D1, suggesting that cyclin D1 is regulated by p-STAT3 in LSC tissues.

It has been reported in many studies that activation of STAT3 is related to poor prognosis of various cancers [31-33]. To test whether STAT3 activation is pertinent to clinicopathologic factors of LSC, we analyzed the relationship between p-STAT3 and critical prognostic factors. Results in Table 1 indicates that there is a significant correlation between p-STAT3 expression and clinical stage, pathologic grade and neck node metastasis rather than age, sex, T stage and even the site of primary tumors.

Table 1. The relationship between the expression of Stat3 and phosphorylated Stat3 protein and clinicophalogical features in laryngeal squamous cell carcinoma

n Stat3 p-Stat3
M number (rate%) P value M number (rate%) P value
Age ≥60 28 23(82.14) 0.0715 17(60.71) 0.6609
<60 22 13(59.09) 12(54.54)
Sex M 36 27(75.00) 0.6841 23(63.89) 0.1761
F 14 9 (64.29) 6 (42.86)
Tumor position Supra-glottis 17 10(58.82) 0.2473 10(58.82) 0.9325
glottis 33 26(78.78) 19(57.58)
 

Patho- grade

Well to moderately differentiated 19 10(52.63) 0.0169 5 (26.32) 0.0004
Poorly differentiated 31 26(83.87) 24(77.42)
T stage T1-T2 17 12(70.58) 0.0685 7 (41.18) 0.0836
T3-T4 33 27(81.81) 22(66.67)
Clinical stage Ⅰ-Ⅱ 13 5 (38.46) 0.0056 4 (30.77) 0.0208
Ⅲ-Ⅳ 37 31(83.78) 25(67.57)
Lymph node metastasis Yes 22 20(90.90) 0.0083 17(77.27) 0.0144
No 28 16(57.14) 12(42.86)

Activation of STAT3 is in constant existence in Hep-2 laryngeal carcinoma cells (Hep-2 cells). To test whether STATA3 is also constitutively activated in Hep-2 cells, we examined the expression of STAT3 and its related proteins by immunocytochemistry and western blot. By immunocytochemistry, STAT3 was distributed in cytoplasm of cancer cells, while p-STAT3 was observed mostly within nucleus of Hep-2 cells, which resembles the expression pattern of STAT3 and p-STAT3 in LSC tissues (Fig 2A, B, C). To examine if these proteins were constantly and pervasively expressed, we detected expression of the two proteins using western blot at different time points after the setting of cell culture. The sequent 24 h, 48 h, and 72 h were chosen as time spots of analysis. The results of western blot showed that STAT3 and p-STAT3 (Fig 2D) can be detected at different time points, suggesting that constitutive activation of STAT3 is also present in Hep-2 cells as in primary LSC.

CST 2017-204_fig_2

Figure 2. TExpression of STAT3 and p-STAT3 in human laryngeal carcinoma Hep-2 cells. Immunocytochemistry was used to demonstrate the intracellular distribution of STAT3 and p-STAT. PBS was used as a negative control. Besides, western blot was used to show the expression patterns of STAT3 and p-STAT3 overtimes (0h, 24h, 48h, 72h). β-actin represents the internal protein control. Constitutive expression and activation of STAT3 in human laryngeal carcinoma Hep-2 cells was noted. A. Cytoplasmic staining of STAT3 in Hep-2 cells (SP × 400). B. Nuclear staining of p-STAT3 in Hep-2 cells (SP × 400). C. Negative control (SP × 400). D. Expression of Stat3 and p-STAT3 in Hep-2 cells as demonstrated by western blot.

Proteasome inhibitor MG-132 induces apoptosis in Hep-2 cells, which is accompanied by additional activation of STAT3 and changes in the expression of several proteins related to cell cycle and apoptosis regulation. PIs have been approved by the United States Food and Drug Administration (FDA) for the treatments of multiple myeloma. In addition, PIs have been investigated for the treatments of many cancers. Herein, we aimed to test the therapeutic effects of PIs on Hep-2 cells. First, we tested the inhibition of proliferation in Hep-2 cells by a PI, MG-132, using MTT assay. Medium containing different concentrations of MG-132 was add into each well of treatment groups and maintained for different times. As seen in Fig 3A, the inhibition of Hep-2 cells by MG-132 displayed a concentration-dependent manner (24h:r=0.925,p<0.01;48h:r=0.944,p<0.01). Second, we attempted to confirm if MG-132 inhibits proliferation of Hep-2 cells in a time-dependent manner. For doing this, we selected the 2.5μM (IC50) of MG-132 to stimulate Hep-2 cells for 48 h. The results of Fig 3B show that the effects of MG-132 in proliferation inhibition is enhanced with prolongation of treatment time (r=0.945,p<0.01). Third, using flow cytometry, we determined apoptosis rate and cycle distribution of Hep-2 cells after treatment with MG-132. Similar with the inhibition of proliferation, MG-132 induces apoptosis in time- (r=0.888,p<0.01) and dose-dependent (r=0.842,p<0.01) manners (Fig 3C, 3D ).

CST 2017-204_fig_3

Figure 3. Effects of a proteasome inhibitor, MG-132, on Hep-2 cells. Hep-2 cells were treated with different concentrations of MG-132 for 24 hours. A concentration of 2.5μM was chosen for stimulation of Hep-2 cells for different times. Alterations in cell apoptosis, cell cycle and protein expression of STAT3 and p-STAT3 were assessed simultaneously. A. The dosage and effect curve of MG-132 (n = 3). B. The time and effect curve of MG-132 (n = 3). C. Apoptosis rate of Hep-2 cells treated with MG-132 for different time (n = 3). D. Apoptosis rate of Hep-2 cells treated with MG-132 at different concentrations (*P < 0.05, versus untreated groups (0μM) (n = 3). E. The correlated expression of cell cycle regulation proteins in Hep-2 cells treated with MG-132 for different time. F. Variation of cell cycle of Hep-2 cells treated with MG-132 for different time (n = 3). G. MG-132-induced STAT3 activation and Bcl-2 expression in Hep-2 cells.

To confirm the mechanisms underlying the cell cycle changes induced by MG-132, we used western blot to check the expression levels of some cell cycle regulators. As seen in Fig 3E, the expression of P21 is elevated significantly compared with the decreased levels of the expression of cyclinD1, suggesting that the changes of cell cycle induced by MG-132 were associated with upregulation of P21 and downregulation of cyclinD1. Simultaneously, cell cycle arrest was noted at G0/G1 phase and/or G2/M phase overtimes after treatment with MG-132 (Fig 3F), the former of which is more prominent than the latter.

From the results of western blot in Fig 3G, we can confirm that STAT3 and its activated form, p-STAT3, are expressed at all times in cultured Hep-2 cells, even in the absence of MG-132 treatment, and the level of its expression was relatively constant and stable. In the presence of MG-132, the expression of p-STAT3 was elevated within short period of time and remained at a stable level; however, the increased expression of p-STAT3 was not related to the duration of MG-132 treatment. Bcl-2 was identified as a downstream of STAT3, and facilitates anti-apoptosis activity in cancer cells [34]. Expression of Bcl-2 protein increased overtime after MG-132 treatment, which may contributed to the MG-132-induced STAT3 activation and resistance of Hep-2 cells to MG-132-induced apoptosis.

Knockdown of STAT3 by shRNA, abrogates the expression and thus activation of STAT3, and potentiates the apoptosis-inducing effects of MG-132. To further confirm the role of the STAT3 activation in inducing resistance of Hep-2 cells to MG-132, we used RNAi to knockout the expression of STAT3, and thus the “constitutive” (inherent) and “PI-induced” (acquired) activation of STAT3. The transfection efficiency was 85.76% by flow cytometry (data not shown). The results of Fig 4A showed that combined group has a similar expression level of p-STAT3 with pshSTAT3 group, with a higher inhibition rate than any other groups (all p<0.01). Results from apoptosis detection Fig 4B showed a more striking apoptosis rate 55.80±3.12% in combined group than in any other group (all p<0.01). In pshSTAT3 group, moderate apoptosis and proliferation inhibition rates were induced. Therefore, blockade of STAT3 by shRNA, abrogates the expression and thus both “inherent” and “acquired” activation of STAT3, and potentiates the MG-132-induced apoptosis in Hep-2 cells.

CST 2017-204_fig_4

Figure 4. Effects of MG-132 combined with STAT3 RNAi on proliferation inhibition and apoptosis in Hep-2 cells, as assessed by MTT assay and flow cytometry. Hep-2 cells were seeded into 96-well plates for MTT assay, or 6-well plates for flow cytometry. Subjected Hep-2 cells were categorized as five groups: normal control group (untreated Hep-2 cells), negative control group (Hep-2 cells transfected with negative plasmid, pshNeg group), MG-132 group (Hep-2 cells treated with 2.5μM MG-132 only), combined group (Hep-2 cells transfected with positive plasmid combined with 2.5μM MG-132 treatment), pshSTAT3 group (Hep-2 cells transfected with positive plasmid without any other treatment). A. The proliferation inhibition rate of Hep-2 cells in different groups (n=3) (versus pshNeg group, all *P<0.01; pshSTAT3 group versus MG-132 group, #P<0.01). B. The apoptosis rate of Hep-2 cells in different groups (n=3) (control group versus pshNeg group, *P<0.01; pshSTAT3 group versus MG-132 group, #P<0.01). C. Expression of p-STAT3, cyclin D1 and Bcl-2 in Hep-2 cells in different groups was analyzed by Western blotting.. Lane 1: control group; lane 2: pshNeg group; lane 3: MG-132 group; lane 4: combined group; lane 5: pshSTAT3 group.

With regard to the activation of STAT3 at different situations, as seen in Fig 4C, p-STAT3 was expressed at the highest level in MG-132 group. By contrast, p-STAT3, cyclin D1, and Bcl-2 were expressed at lower levels in combined group, compared with each of the normal control group, negative control group and MG-132 group. The similar expression and activation patterns of STAT3 noticed in combined group and pshSTAT3 group indicated that p-STAT3 may participate in the formation of resistance of Hep-2 cells to MG-132 at a transcriptional level. Taken together, activation of STAT3 is responsible for the resistance of Hep-2 cells to MG-132 at least in part by regulating the anti-apoptosis factor Bcl-2 expression.

Combined treatment with STAT3 inhibitor AG490 and proteasome inhibitor MG-132 induces apoptosis more effectively in Hep-2 cells. In view of the fact that activation of STAT3 played a role in the therapeutic resistance to MG-132 in Hep-2 cells, which can be sensitized by knockdown of STAT3, we studied the effects of combined using STAT3 inhibitor AG490 and proteasome inhibitor MG-132 on proliferation and apoptosis. As seen in Fig 5 A, B, combination treatment by AG490 and MG-132 can induce significant increase in cell proliferation inhibition and apoptosis, indicative of effective synergism.

CST 2017-204_fig_5

Figure 5. Effects of AG-490 combined with MG-132 on Hep-2 cells. Hep-2 cells were seeded into 96-well or 6-well plates followed by treatment with 1μM of MG-132 for 48h with or without presence of different concentrations (10, 20, 40, 80μM) of AG490. A concentration of 10μmol/L was for analysis of AG490-induced apoptosis. A. The proliferation inhibition rate of Hep-2 cells treated with the different concentrations AG490 alone and in combination with MG-132 for 48h (n=3). B. The apoptosis rate of Hep-2 cells treated with AG490 alone and in combination with MG-132(1μM) for 48h (n=3) (compared with control group,*P<0.01; compared with AG490 group and MG-132 group, all #P<0.01).

Discussion

Like other malignancies in HNSCC, LSC often exhibits resistance to various therapeutic strategies including chemoradiation and targeted therapies, especially in advanced cases. This difficult situation is often attributed to aberrant expression and activation of some specific genes, such as STAT3, which are utilized by cancer cells to maintain their biological behaviors. In this regard, cancer cells may become vulnerable to the assigned treatment modalities secondary to abrogating the functions of major responsible oncogenes, the so-called “Achilles heel”, which constitutes the fundamental rationale for targeted therapy [35].

Previous studies have demonstrated that activation of STAT3 is associated with chemo- and/or radioresistance in Hep-2 cells, and knockdown of STAT3 by siRNA or blockade of STAT3 activation by its inhibitors sensitizes chemo- and/or radiotherapy both in vitro or in vivo [11, 12, 36, 37]. Importantly, we also demonstrated in the present investigation that constitutive activation of STAT3 was associated with clinicopathlologic factors in LSC, which include clinical stage, pathological grading and cervical lymph node metastasis. This is consistent with the findings in the study of Rosen et al, in which they demonstrated that p-STAT3 was associated with poor prognosis of ovarian cancer [38]. Moreover, results of Kusaba’s study [33] also demonstrated that p-STAT3 is correlated with invasion of vein, nodal metastasis and Dukes grades instead of pathological grading in ovarian cancer. In the present study, we found expression of cyclin D1, one of the important factors downstream of STAT3, was also elevated. Taken together, correlations between activation of STAT3 and clinicopathlological factors of different cancers may depend on cell types from which they originate.

In addition to intrinsic elements, cancer cells in solid tumors also depends on extrinsic factors that form surrounding microenvironment (also called “niche”) for their proliferation and survival. The feature of the niche is characterized by low PH, hypoxia and glucose-deprived starvation as a result of rapid proliferation by tumor cells and insufficient delivery by intra-tumor capillary [39]. Under the stressful conditions, a mass of misfolded or unfolded proteins accumulate in endocytoplasmic reticulum (ER). Tumor cells must activate UPR to inhibit synthesis of protein and mRNA and degrade excessive protein by proteasome to accommodate ER-stress, which is rarely experienced by normal tissue cells [40]. It has been demonstrated that severe ER-stress caused by accumulated misfolded proteins can activate programmed death in tumor cells [39]. Therefore, proteasome can serve as a potential target for cancer therapy.

Recently, PIs was introduced into clinical treatment of cancers, either as a single agent or a combined therapy to sensitize traditional chemo- and/or radiotherapy. However, the resistance to PIs remains a problem to solve, of which underlying mechanisms have not been explained pertinently [23]. The prerequisite for us to select PIs as an anti-LSC agent resides on the fact that PIs is effective against cyclin D1 highly-expressed cancers [41]. However, it remains to be elucidated whether other HNSCC cells were dependent or independent on cyclin D1 expression for their proliferation, survival and progression.

Given the fact that activation of STAT3 is associated with clinicopathologic behaviors and chemoradiation resistance in LSC, STAT3 is definitely a potential target for therapeutic purposes. The pro-survival and –proliferation effects of p-STAT3 let us to postulate that the constitutive (inherent) along with PI-induced (acquired) activation of STAT3 may constitute a major cause of resistance to PIs in LSC. Abrogation of both existed and acquired STAT3 activation may sensitize the LSC cells to PI treatment. In present investigation, we found for the first time that activation of STAT3 contributed to resistance of LSC to MG-132 at least in part by upregulating expression of antiapoptotic protein Bcl-2, which is partly consistent with results of a recent study [24]. Our results showed that PIs plus AG490 displayed a more powerful killing effect to LSC cells in a synergetic manner. However, such a combination may not be applied to all cancers, because overexpression of Bcl-2 is associated with a good prognosis in some other malignancies [42].

In the present study, we also demonstrated that MG-132 can induce G0/G1 cell cycle arrest, via downregulation of cyclin D1 in LSC, which is also observed in some other cancers [43-45]. It can be inferred that an ideal local control is to be achieved by PIs through inducing quiescence in LSC cells. However, a fact that cannot be ignored is that G0/G1 cycle arrest also constitutes a cause of therapeutic resistance in some tumors.

Although inhibiting STAT3 is capable of inducing quiescence and potentiating PI-induced apoptosis in LSC cells, there has been no effective STAT3 inhibitor that can be safely used for humans in clinic for treatment of HNSCC. We recently defined dihydroartemisinin as putative STAT3 inhibitor, which might be safely used in clinic for cancer treatment [46]. Much work has to be done for developing new STAT3-inhibiting agents and exploring new treatment strategies and modalities based on the synergized apoptosis-inducing effects of PIs with STAT3 inhibitors.

Acknowledgements: The research work in the present investigation is supported by Key Basic Research Project Fund of Hebei Province, China (Fund No. 14967721D) and in part by Scientific Research Fund of Bethune International Peace Hospital, China.

Conflict of Interest: None

References

  • Parkin DM, Bray F, Ferlay J, Pisani P (2005) Global cancer statistics, 2002. CA Cancer J Clin 55: 74-108. [crossref]
  • Leeman RJ, Lui VW, Grandis JR (2006) STAT3 as a therapeutic target in head and neck cancer. Expert Opin Biol Ther 6: 231-241. [crossref]
  • Chen SH, Murphy DA, Lassoued W, Thurston G, Feldman MD, et al. (2008) Activated STAT3 is a mediator and biomarker of VEGF endothelial activation. Cancer Biol Ther 7: 1994-2003. [crossref]
  • Grandis JR, Drenning SD, Chakraborty A, Zhou MY, Zeng Q, et al. (1998) Requirement of Stat3 but not Stat1 activation for epidermal growth factor receptor- mediated cell growth In vitro. J Clin Invest 102: 1385-1392. [crossref]
  • Guo C, Yang G, Khun K, Kong X, Levy D, et al. (2009) Activation of Stat3 in renal tumors. Am J Transl Res 1: 283-290. [crossref]
  • Kim SM, Kwon OJ, Hong YK, Kim JH, Solca F, et al. (2012) Activation of IL-6R/JAK1/STAT3 signaling induces de novo resistance to irreversible EGFR inhibitors in non-small cell lung cancer with T790M resistance mutation. Mol Cancer Ther 11: 2254-2264. [crossref]
  • Sánchez A, Nagy P, Thorgeirsson SS (2003) STAT-3 activity in chemically-induced hepatocellular carcinoma. Eur J Cancer 39: 2093-2098. [crossref]
  • Turkson J, Jove R (2000) STAT proteins: novel molecular targets for cancer drug discovery. Oncogene 19: 6613-6626. [crossref]
  • Bonner JA, Trummell HQ, Willey CD, Plants BA, Raisch KP (2009) Inhibition of STAT-3 results in radiosensitization of human squamous cell carcinoma. Radiother Oncol 92: 339-344. [crossref]
  • Ara T, Nakata R, Sheard MA, Shimada H, Buettner R, et al. (2013) Critical role of STAT3 in IL-6-mediated drug resistance in human neuroblastoma. Cancer Res 73: 3852-3864. [crossref]
  • Li X, Wang H, Lu X and Di B (2010) Silencing STAT3 with short hairpin RNA enhances radiosensitivity of human laryngeal squamous cell carcinoma xenografts in vivo. Exp Ther Med 1: 947-953.
  • Li X, Wang H, Lu X and Di B (2010) STAT3 blockade with shRNA enhances radiosensitivity in Hep-2 human laryngeal squamous carcinoma cells. Oncol Rep 23: 345-353.
  • Määttänen P, Gehring K, Bergeron JJ, Thomas DY (2010) Protein quality control in the ER: the recognition of misfolded proteins. Semin Cell Dev Biol 21: 500-511. [crossref]
  • Orlowski RZ (2005) The ubiquitin proteasome pathway from bench to bedside. Hematology / the Education Program of the American Society of Hematology. American Society of Hematology. Education Program: 220-225
  • Uddin S, Ahmed M, Bavi P, et al. (2008) Bortezomib (Velcade) induces p27Kip1 expression through S-phase kinase protein 2 degradation in colorectal cancer. Cancer Res 68: 3379-3388.
  • Mitsiades CS, McMillin D, Kotoula V, et al (2006) Antitumor effects of the proteasome inhibitor bortezomib in medullary and anaplastic thyroid carcinoma cells in vitro. The Journal of clinical endocrinology and metabolism 91: 4013-402.
  • Jones RJ, Chen Q, Voorhees PM, Young KH, Bruey-Sedano N, et al. (2008) Inhibition of the p53 E3 ligase HDM-2 induces apoptosis and DNA damage–independent p53 phosphorylation in mantle cell lymphoma. Clin Cancer Res 14: 5416-5425. [crossref]
  • Li B and Dou QP (2000) Bax degradation by the ubiquitin/proteasome-dependent pathway: involvement in tumor survival and progression. Proc Natl Acad Sci U S A 97: 3850-3855.
  • Lara PN, Bold RJ, Mack PC, Davies AM, Gumerlock PH and Gandara DR (2005) Proteasome inhibition in small-cell lung cancer: preclinical rationale and clinical applications. Clinical lung cancer 7 Suppl 2: S67-7
  • Li C, Li R, Grandis JR and Johnson DE (2008) Bortezomib induces apoptosis via Bim and Bik up-regulation and synergizes with cisplatin in the killing of head and neck squamous cell carcinoma cells. Mol Cancer Ther 7: 1647-1655
  • McConkey DJ, Zhu K (2008) Mechanisms of proteasome inhibitor action and resistance in cancer. Drug Resist Updat 11: 164-179. [crossref]
  • Fels DR, Ye J, Segan AT, et al. (2008) Preferential cytotoxicity of bortezomib toward hypoxic tumor cells via overactivation of endoplasmic reticulum stress pathways. Cancer Res 68: 9323-9330.
  • Orlowski RZ, Kuhn DJ (2008) Proteasome inhibitors in cancer therapy: lessons from the first decade. Clin Cancer Res 14: 1649-1657. [crossref]
  • Li C, Zang Y, Sen M, Leeman-Neill RJ, Man DS, et al. (2009) Bortezomib up-regulates activated signal transducer and activator of transcription-3 and synergizes with inhibitors of signal transducer and activator of transcription-3 to promote head and neck squamous cell carcinoma cell death. Mol Cancer Ther 8: 2211-2220. [crossref]
  • Wang Q, He Z, Zhang J, et al. (2005) Overexpression of endoplasmic reticulum molecular chaperone GRP94 and GRP78 in human lung cancer tissues and its significance. Cancer detection and prevention 29: 544-55.
  • Song X, Liu X, Chi W, Liu Y, Wei L, et al. (2006) Hypoxia-induced resistance to cisplatin and doxorubicin in non-small cell lung cancer is inhibited by silencing of HIF-1alpha gene. Cancer Chemother Pharmacol 58: 776-784. [crossref]
  • Zhou Y, Li M, Wei Y, Feng D, Peng C, et al. (2009) Down-regulation of GRIM-19 expression is associated with hyperactivation of STAT3-induced gene expression and tumor growth in human cervical cancers. J Interferon Cytokine Res 29: 695-703. [crossref]
  • Corvinus FM, Orth C, Moriggl R, Tsareva SA, Wagner S, et al. (2005) Persistent STAT3 activation in colon cancer is associated with enhanced cell proliferation and tumor growth. Neoplasia 7: 545-555. [crossref]
  • Yu CL, Jove R and Burakoff SJ (1997): Constitutive activation of the Janus kinase-STAT pathway in T lymphoma overexpressing the Lck protein tyrosine kinase. J Immunol 159: 5206-5210.
  • Rahaman SO, Harbor PC, Chernova O, Barnett GH, Vogelbaum MA, et al. (2002) Inhibition of constitutively active Stat3 s.uppresses proliferation and induces apoptosis in glioblastoma multiforme cells. Oncogene 21: 8404-8413
  • Masuda M, Suzui M, Yasumatu R, et al.(2002) Constitutive activation of signal transducers and activators of transcription 3 correlates with cyclin D1 overexpression and may provide a novel prognostic marker in head and neck squamous cell carcinoma. Cancer Res 62: 3351-3355.
  • Horinaga M, Okita H, Nakashima J, Kanao K, Sakamoto M, et al. (2005) Clinical and pathologic significance of activation of signal transducer and activator of transcription 3 in prostate cancer. Urology 66: 671-675.
  • Kusaba T, Nakayama T, Yamazumi K, et al. (2005) Expression of p-STAT3 in human colorectal adenocarcinoma and adenoma; correlation with clinicopathological factors. J Clin Pathol 58: 833-838
  • Groner B, Lucks P, Borghouts C (2008) The function of Stat3 in tumor cells and their microenvironment. Semin Cell Dev Biol 19: 341-350. [crossref]
  • Christoffersen T, Guren TK, Spindler KL, Dahl O, Lonning PE, et al. (2009) Cancer therapy targeted at cellular signal transduction mechanisms: strategies, clinical results, and unresolved issues. Eur J Pharmacol 625: 6-22.
  • Hsu HW, Gridley DS, Kim PD, Hu S, de Necochea-Campion R, et al. (2013) Linifanib (ABT-869) enhances radiosensitivity of head and neck squamous cell carcinoma cells. Oral Oncol 49: 591-597. [crossref]
  • Sen M, Joyce S, Panahandeh M, Li C, Thomas SM, et al. (2012) Targeting Stat3 abrogates EGFR inhibitor resistance in cancer. Clin Cancer Res 18: 4986-4996. [crossref]
  • Rosen DG, Mercado-Uribe I, Yang G, Bast RC Jr, Amin HM, et al. (2006) The role of constitutively active signal transducer and activator of transcription 3 in ovarian tumorigenesis and prognosis. Cancer 107: 2730-2740. [crossref]
  • Wang G, Yang ZQ and Zhang K (2010) Endoplasmic reticulum stress response in cancer: molecular mechanism and therapeutic potential. Am J Transl Res 2: 65-74.
  • Healy SJ, Gorman AM, Mousavi-Shafaei P, Gupta S and Samali A (2009) Targeting the endoplasmic reticulum-stress response as an anticancer strategy. Eur J Pharmacol 625: 234-246.
  • Ishii Y, Pirkmaier A, Alvarez JV, Frank DA, Keselman I, et al. (2006) Cyclin D1 overexpression and response to bortezomib treatment in a breast cancer model. J Natl Cancer Inst 98: 1238-1247. [crossref]
  • Zhuang L, Lee CS, Scolyer RA, et al. (2007) Mcl-, Bcl-XL and Stat3 expression are associated with progression of melanoma whereas Bcl-2, AP-2 and MITF levels decrease during progression of melanoma. Mod Pathol 20: 416-426.
  • Wang Y, Rishi AK, Puliyappadamba VT, et al. (2010) Targeted proteasome inhibition by Velcade induces apoptosis in human mesothelioma and breast cancer cell lines. Cancer Chemother Pharmacol 66: 455-466.
  • Bazzaro M, Lee MK, Zoso A, et al. (2006) Ubiquitin-proteasome system stress sensitizes ovarian cancer to proteasome inhibitor-induced apoptosis. Cancer Res 66: 3754-3763
  • Liu T, Peng H, Zhang M, Deng Y and Wu Z (2010) Cucurbitacin B, a small molecule inhibitor of the Stat3 signaling pathway, enhances the chemosensitivity of laryngeal squamous cell carcinoma cells to cisplatin. Eur J Pharmacol 641: 15-22.
  • Jia L, Song Q, Zhou C, et al. (2016) Dihydroartemisinin as a Putative STAT3 Inhibitor, Suppresses the Growth of Head and Neck Squamous Cell Carcinoma by Targeting Jak2/STAT3 Signaling. PLoS One 11: e0147157. [crossref]

Overexpression of IFN-γR Increases the Radiotherapy Resistance of Nasopharyngeal Carcinoma

Abstract

Purpose: To assess the relationship between IFN-γR expression and clinical radiotherapy outcome in nasopharyngeal carcinoma.

Methods: IFN-γR expression was examined by immunohistochemistry from 70 nasopharyngeal carcinoma patients. Then, statistical analysis was conducted to explore the correlation between IFN-γR expression and tumor clinicopathological charateristics. Finally, CNE-1 cells were employed to detect the effects of IFN-γR expression on radiotherapy outcomes by in vitro assays.

Results: IFN-γR was upregulated dramatically in nasopharyngeal carcinoma tissues. Elevated expression of IFN-γR correlated significantly with tumor stage, positive lymph node metastasis and poor prognosis in patients with nasopharyngeal carcinoma. In vitro assays demonstrated that overexpression of IFN-γR promoted the radio-resistance ability in CNE-1 cells. Knockdown of IFN-γR facilitated CNE-1 cells more sensitive to radiation, and a wobble mutant of IFN-γR could restore this effect.

Conclusions: Overexpression of IFN-γR may correlate positively with radiotherapy resistance of nasopharyngeal carcinoma.

Keywords

IFN-γR; overexpression; prognosis; radiation resistance; NPC

Introduction

Nasopharyngeal carcinoma is one of the most common malignancies and occupies the seventh leading cause of cancer-related deaths in China [1]. Particularly in South China, nasopharyngeal carcinoma is the most prevalent. Locally, advanced nasopharyngeal carcinoma patients are generally treated with radiotherapy, and the prognosis is related with radiotherapy [2]. Both local-regional failure and early systemic dissemination of the disease always contribute to treatment failure, which makes radio-sensitization promising in improving the outcome of therapeutic irradiation [3].

IFN-γ plays a pleiotropic role in modulating immunity and antiviral activity. It stimulates macrophages and NK cells to produce MHC class I and II molecules, while IFN-γR is not required for the development of the immune system [4]. Researches showed that IFN-γR was overexpressed in breast cancer and its amplification was closely related with lymph node metastasis and poor prognosis [5-7]. Until now, there are still no reports about whether IFN-γR has an effect on the radiotherapy for NPC. In the present study, we found for the first time that IFN-γR expression correlated with the prognosis of NPC patients who received radiotherapy. High IFN-γR levels improved the radiation resistance ability of NPC cells.

Patients and methods

Tissue samples

Seventy tissues of nasopharyngeal carcinoma were freshly collected by nasopharyngoscope and procured by the Department of Pathology, Cancer Center of Wuhan Union Hospital, China. The collection of tumor samples was approved by the institutional ethics committee. Informed consent forms had been signed for sample collection before. Tumor regions were technically separated by experienced pathologists and promptly stored at liquid nitrogen until needed. All patients included underwent concurrent chemotherapy (Cisplatin, 40mg/m2, weekly) with radiation therapy for the first time. They received irradiation with daily fraction doses of 2.12Gy for a total dose 70 Gy, which was administered with linear accelerators. The clinicopathologic features of patients were showed in Table 1.

CST 2017-203 Tab1

Immunohistochemical staining

Immunohistochemical staining was conducted as previously described. After rehydration, the paraffin-embedded nasopharyngeal carcinoma tissues were immersed in 3% hydrogen peroxide solution for 10 min, and then heated in EDTA buffer (pH 8.0) for 25 min. The slides were blocked with 10% normal rabbit serum at 37°C for 30 min, and then incubated with rabbit polyclonal antibody against primary antibody (IFN-γR, 1:200, ABCAM) overnight at 37°C. The slides were washed with PBS, and then incubated with biotinylated second antibody (diluted 1:200) for another 30 min at 37°C. Finally, streptavidin-peroxidase reactivity was detected with DAB solution. Cell nucleus was counterstained with hematoxylin. The immunohistochemical slides were graded according to the ratio of tumor cells with nuclear labeling. The level of IFN-γR- positive staining was scored into three grades: 0 for < 10%, positive for 10–30%, strong positive for > 30%.

Plasmid constructs and small interfering RNA synthesis

Double-stranded oligonucleotide with the following sequence was synthesized into the pSilencer 3.1- H1 neo small interfering RNA (siRNA) expression vector, and the scrambled siRNA was applied as control. Mutant DNA-IFN-γR (BOSTER, Wuhan, China) was used to resist the effect of IFN-γR-RNAi.

Cell culture and transfection

The CNE-1 cells (one of the esophageal squamous carcinoma cell lines) were cultured in RPMI 1640 (Invitrogen) with 10% fetal bovine serum. Cell transfection was carried out using Lipofectamine 2000 (Invitrogen) following the manufacturer’s instruction. Cells were harvested after transient transfection for 48 h. For stable transfection, cells were selected with 200 μg/ml G418, and passaged by serial dilution. During the next two weeks, colonies were screened by selective medium. The positive colonies with IFN-γR overexpression and IFN-γR knockdown were chosen for experiments.

Western blot analysis

Total proteins were isolated from patient tissues and cultured cells with lysis buffer [10 mM Tris-HCl (pH 7.5), 150 mM NaCl, 1% NP40] containing protease inhibitors. After centrifugation (15,000 RCF, 30 min, 4°C), supernatants were recovered for immunoblot analysis. The proteins were subjected to SDS-PAGE and then transferred onto polyvinylidenedifluoride (PVDF) membranes (Millipore). Next, the membranes were blocked and then incubated with primary antibody against IFN-γR (1:500, ABCAM) at 4°C overnight, then incubated with horseradish peroxidase-conjugated accordingly secondary antibody for 1 h at room temperature and developed using ECL detection reagent (BOSTER).

Ionizing radiation

CNE-1 cell line was exposed to IR in a JL Shepherd Model 143 137Cesium gamma and irradiated at a rate of 2.4 Gy/min.

Colony formation assay

A total of 400 cells were aliquoted into 6- well plate and exposed to γ rays in a dose of 5 Gy in triplicate. After incubation for 10 days, visible colonies were fixed in methanol and stained with Giemsa. Colonies were counted in each well. Each experiment was performed three times independently.

Results

Overexpression of IFN-γR in esophageal squamous cell carcinoma

IFN-γR expression was examined in 70 NPC samples and adjacent normal tissue by immunohistochemistry. Results showed that IFN-γR was hardly expressed or revealed weak expression in normal epithelial cells. While, in 36 cases of 70 NPC samples, IFN-γR expression exhibited significantly enhanced trend compared to the normal epithelium [Table 1]. Statistical analysis indicated that elevated expression of IFN-γR was significantly related to tumor stage, clinical stage and lymph node metastasis (p < 0.05) [Table 2].

CST 2017-203 Tab2

Next, the effect of IFN-γR expression on patient’s survival was analyzed. IFN-γR expression is positive in some patients and negative positive in others [Figure 1A]. After the included patients underwent chemotherapy combined with radiation therapy (55 out of 70), compared to NPC patients with low IFN-γR expression in cancerous tissue was significantly higher, patients with cancerous tissue of high IFN-γR expression showed significantly lower survival rate (p = 0.001) [Figure 1B].

Figure 1. Representative IFN-γR immunostaining in NPC and effects of IFN-γR expression on patient’s survival. A: IFN-γR expression is positive in some patients and negative positive in others. B: In the patients that received concurrent chemotherapy with radiation therapy (55 out of 70), the survival rate of patients with low IFN-γR expression was significantly higher than that of patients with high IFN-γR expression (p = 0.001).

Figure 1. Representative IFN-γR immunostaining in NPC and effects of IFN-γR expression on patient’s survival. A: IFN-γR expression is positive in some patients and negative positive in others. B: In the patients that received concurrent chemotherapy with radiation therapy (55 out of 70), the survival rate of patients with low IFN-γR expression was significantly higher than that of patients with high IFN-γR expression (p = 0.001).

Effects of IFN-γR on the radio-sensitivity of CNE-1 cells

To confirm the clinical data, CNE-1 cells were radiated with a dose of 5 Gy for 0, 2, 4, 8 and 12 h to know IFN-γR expression change. IFN-γR expression was increased after radiation in a time-dependent manner, which implied that IFN-γR may be associated with the radiation response of CNE-1 cells [Figure 2].

Figure 2. Expression of IFN-γR induced by radiation in CNE-1 cells. Elevated IFN-γR was observed after γ ray radiation with a dose of 5 Gy, and its level was highest at 10 hours.

Figure 2. Expression of IFN-γR induced by radiation in CNE-1 cells. Elevated IFN-γR was observed after γ ray radiation with a dose of 5 Gy, and its level was highest at 10 hours.

Colony formation assay was conducted to detect the effects of IFN-γR on the radio-sensitivity of CNE-1 cells [8]. IFN-γR knock-down cells showed a significantly lower survival fraction than control groups [Figures 3A and B]. Conversely, the survival fraction of cells with forced IFN-γR expression was higher [Figures 3C and D]. Therefore, results indicated a positive relationship between IFN-γR expression and radio-sensitivity of CNE-1 cells.

Figure 3. Effects of IFN-γR expression on the radio-sensitivity of CNE-1 cells. A: Expression of IFN-γR decreased in IFN-γR RNAi cells. B: Knock-down of IFN-γR promoted the radio-sensitivity of CNE-1 cells. C: Expression of IFN-γR increased after positive transfection. D: Forced IFN-γR expression inhibited the radio-sensitivity of CNE-1 cells.

Figure 3. Effects of IFN-γR expression on the radio-sensitivity of CNE-1 cells. A: Expression of IFN-γR decreased in IFN-γR RNAi cells. B: Knock-down of IFN-γR promoted the radio-sensitivity of CNE-1 cells. C: Expression of IFN-γR increased after positive transfection. D: Forced IFN-γR expression inhibited the radio-sensitivity of CNE-1 cells.

Discussion

Overexpression of IFN-γR has been observed in various types of human tumors, and elevated expression of IFN-γR indicated poor prognoses for patients, such as gastric carcinoma, prostate cancer, oral squamous cell carcinoma and non-small cell lung cancer. Particularly, IFN-γR hyperexpression was found to be associated with poor prognosis and reduced p27 expression in gastric carcinoma. Some studies have revealed that IFN-γR was amplified and upregulated in breast cancer. Moreover, its overexpression indicated worse tumor stage and lymphatic metastasis. However, there have been no reports on IFN-γR expression in NPC until now. Our results showed for the first time that IFN-γR expression increased in NPC, which significantly related with tumor stage and positive lymphatic metastasis. Coincidently, other studies have demonstrated that elevated IFN-γR level was correlated with poor prognosis in colorectal carcinoma [9,10]. However, no significance was shown between IFN-γR level and overall survival of NPC patients in the present study. We could not help putting forward the speculation whether IFN-γR expression affects radiotherapy outcome. Survival analysis unveiled that the overall survival rate of patients received radiation therapy was indeed affected by IFN-γR expression. Histological detection also showed a strong association betweeen IFN-γR hyperexpression and T-stage and lymphatic metastasis. Besides, in vitro assay further confirmed this point. This was the first report about the correlation between IFN-γR expression and radiation resistant of carcinoma.

Some studies reported that downregulation of IFN-γR suppressed prostate cancer cells proliferation, anchorage-independent growth and migration 11,12], while knockdown of Cks2 induced apoptosis [13,14]. Decreased IFN-γR promoted G2/M phase arrest and programmed cell death in human lung cancer cells [15]. Some study also found that overexpressin of IFN-γR in breast cancer cells repressed cell apoptosis through the MEK-Erk pathway [16]. However, no reports have described the apoptotic effects of IFN-γR expression in radiation-treated cells. In our next study, we may find out that overexpression of IFN-γR could induce apoptosis in CNE-1 cells after radiation.

To conclude, this study identified that overexpression of IFN-γR correlated with the poor prognosis of NPC patients receiving radiotherapy and elevated IFN-γR expression promoted the radiation resistance ability of NPC cells.

Conflict of interest: None declared.

Source of funding: None.

Consent: Written informed consent was obtained from the patients.

Acknowledgments: The Authors thank all the people involved in the project.

References

  • Chua ML, Wee JT, Hui EP, Chan AT (2016) Nasopharyngeal carcinoma. Lancet 387: 1012-1024. [Crossref]
  • Qu S, Liang ZG, Zhu XD (2015) Advances and challenges in intensity-modulated radiotherapy for nasopharyngeal carcinoma. Asian Pacific journal of cancer prevention: APJCP16:1687-1692.
  • Tang LL, Chen L, Mao YP, Li WF, et al. (2015) Comparison of the treatment outcomes of intensity-modulated radiotherapy and two-dimensional conventional radiotherapy in nasopharyngeal carcinoma patients with parapharyngeal space extension. Radiotherapy and oncology: journal of the European Society for Therapeutic Radiology and Oncology116:167-173.
  • Swisher JF, Feldman GM (2015) The many faces of Fcgamma RI: implications for therapeutic antibody function. Immunological reviews 268:160-174.
  • Nagai Y, Tsuchiya H, Runkle EA, Young PD et al. (2015) Disabling of the erbB Pathway Followed by IFN-gamma Modifies Phenotype and Enhances Genotoxic Eradication of Breast Tumors. Cell reports12:2049-2059.
  • Saad S, Dunn LB, Koetters T, Dhruva A, et al. (2014) Cytokine gene variations associated with subsyndromal depressive symptoms in patients with breast cancer. European journal of oncology nursing: The official journal of European Oncology Nursing Society18:397-404.
  • Chen C, Guo L, Shi M, Hu M et al. (2012) Modulation of IFN-gamma receptor 1 expression by AP-2alpha influences IFN-gamma sensitivity of cancer cells. The American journal of pathology180:661-671.
  • Zhao X, Feng X, Peng D, Liu W et al. (2016) Anticancer activities of alkaloids extracted from the Ba lotus seed in human nasopharyngeal carcinoma CNE-1 cells. Experimental and therapeutic medicine12:3113-3120.
  • Wang L, Wang Y, Song Z, Chu J et al. (2015) Deficiency of interferon-gamma or its receptor promotes colorectal cancer development. Journal of interferon & cytokine research: the official journal of the International Society for Interferon and Cytokine Research35:273-280.
  • Ni C, Wu P, Zhu X, Ye J et al. (2013) IFN-gamma selectively exerts pro-apoptotic effects on tumor-initiating label-retaining colon cancer cells. Cancer letters 336:174-184.
  • Wang X, Breeze A, Kulka M. (2015) N-3 polyunsaturated fatty acids inhibit IFN-gamma-induced IL-18 binding protein production by prostate cancer cells. Cancer Immunol Immunother 64:249-258.
  • Wee ZN, Li Z, Lee PL, Lee ST et al. (2014) EZH2-mediated inactivation of IFN-gamma-JAK-STAT1 signaling is an effective therapeutic target in MYC-driven prostate cancer. Cell reports 8:204-216.
  • Lan Y, Zhang Y, Wang J, Lin C et al. (2008) Aberrant expression of Cks1 and Cks2 contributes to prostate tumorigenesis by promoting proliferation and inhibiting programmed cell death. International journal of cancer 123:543-551.
  • You H, Lin H, Zhang Z (2015) CKS2 in human cancers: Clinical roles and current perspectives (Review). Molecular and clinical oncology 3:459-463.
  • Yang D, Stewart TJ, Smith KK, Georgi D et al. (2008) Downregulation of IFN-gammaR in association with loss of Fas function is linked to tumor progression. International journal of cancer122:350-362.
  • Chatterji U, Riby JE, Taniguchi T, Bjeldanes EL et al. (2004) Indole-3-carbinol stimulates transcription of the interferon gamma receptor 1 gene and augments interferon responsiveness in human breast cancer cells. Carcinogenesis 25:1119-1128.

Long Term Results of High Dose Rate Brachytherapy and External Beam Radiotherapy for Local and Locally Advanced Prostate Cancer

Abstract

Purpose: Several studies provided evidence for the efficacy of dose-escalation on biochemical control (BC) of prostate cancer and High-dose-rate brachytherapy (HDR) is one method for it.

Materials and Methods: Patients with histological diagnosis Gleason scored (GS), clinical stage T1 to T3a, no evidence of metastatic disease, prostate volume

Results: From 1997 to 2005 there were 273 patients treated with this treatment combination at AC Camargo Cancer Center, Sao Paulo, Brazil. The median age and FU time were 64.7 and 10.3 years, respectively. Two hundred thirteen (78.0%) patients had FU longer than 5 years. Actuarial 10-year overall survival (OS), Clinical Specific Survival (CSS) and BC were 89.8%, 63.6% and 71.8%, respectively. On univariate analysis GS<7, clinical stage<T2b, low risk group (LR), absence adjuvant androgen deprivation (ADT), age>65, PSAi<10, localized EBRT and 3D-HDR plan were associated with improved CSS and BC, excluding PSAi, age for the last one. Multivariate Cox regression analysis confirmed LR, GS<7, PSAi<10, absence of ADT, age

Conclusion: The present data represents a unique uni-institutional study at long FU for the given technique. A comparison with the current literature confirms the excellent results achieved with this treatment modality. HDR has also the advantage of treatment time reduction and increasing in the capability of work load of the linear accelerators, especially in developing countries, where waiting lists and lack of radiation oncology facilities are a reality.

Keywords

prostate cancer, radiotherapy, high-dose rate brachythrerapy, biochemical control, PSA

Abbreviations and Acronyms

ADT: Adjuvant Androgen Deprivation
AJCC: American Joint Committee on Cancer
BC: Biochemical Control
CSS: Clinical Specific Survival
EBRT: External Beam Radiotherapy
FU: Fallow Up
GS: Gleason Score
HDR: High-Dose-Rate Brachytherapy
LR: Low Risk Group
NAAD: Neoadjuvant Hormonal Therapy
OS: Overall Survival
PSAi: Initial Prostate-Specific Antigen
TRUS: Trans Rectal Ultrasound

Introduction

More than 62% of Prostate Cancers (PCa) are diagnosed in men over 65 years. It has become a public health and socioeconomic problem with increasing incidence, in special due to a rapidly aging population worldwide [1]. In Brazil it was expected the diagnosis of 61,200 new cases of PCa in 2016, and the crude mortality for 2013 was around 14,000 deaths [2].

Management options for localized and locally advanced PCa are controversial and include active surveillance, radical prostatectomy, external beam radiotherapy (EBRT) and brachytherapy with low or high dose rate sources. [3]

Several studies provided evidence for the efficacy of dose-escalation on biochemical control (BC) of PCa. Mature results from randomized trials show a direct relation between increasing the radiation dose given to the prostate and/or seminal vesicles and BC [4-7].

High-dose-rate after loading brachytherapy (HDR) is one method that can deliver a high localized radiation dose to the tumor with excellent BC when combined to EBRT [8]. One prospective randomized trial with up to 10 years follow up has proved that HDR plus EBRT is more efficient than EBRT alone in terms of BC with less acute rectal toxicity and improved quality of life [9].

The aim of this retrospective study is to evaluate the mature results of patients with local and locally advanced PCa treated with combination of HDR and EBRT.

Materials and Methods

Patients with confirmed histological diagnosis Gleason scored (GS) of PCa, AJCC clinical stage T1 to T3a, with no evidence of metastatic disease and initial PSA <60mg/ml, prostate volume

This single-centre institutional protocol of treatment was performed in compliance with the Declaration of Helsinki and approved by the local research Ethics Committee. Written informed consent was mandatory.

External Beam Radiotherapy

The EBRT target volume was defined using diagnostics CT images on conventional two dimensional or 3D planning. The targets were the prostate gland and the proximal seminal vesicles with a 1 to 1.5 cm margin except to the posterior region, which margins were reduced to 0.5 to 1.0cm. The EBRT dose ranged from 45 to 54 Gy prescribed to the intersection point. Further details of the radiotherapy schedules have been published previously [10].

High Dose Rate Brachytherapy

HDR was done under spinal anesthesia. Using TRUS with a perineal template affixed to perineum the exact needles positions were determined intraoperatively. In a first moment treatments were planned based on semi-orthogonal X-rays – two dimensional planning (2D) – and after that we moved to three dimensional (3D) planning, based on CT images. The prostate gland, the rectum, and the urethral trajectory and length were countered and identified in both situations. Implant dosimetry geometric optimization was initially utilized, followed later by use of inverse planning. Treatment parameters and dose constraints changed minimally throughout the years. The patients considered low risk had 16 Gy given in 4 fractions BID, one single implant. Intermediate and high risk patients had 20 Gy given in the same treatment schedule. The dose-volume histogram constraints were as follows: the TRUS or CT-based prostate´s volume receiving 100% of the dose (V100) should be >95%, the uniformity index should be more than 50%, and the V150 less than 30%. The urethra maximum punctual and the maximal dose to 1cc of anterior rectal wall should not exceed 135% and 75% of prescribed doses, respectively.

Definition of end points and statistical analysis

BC was measured using PSA tests and assessed according to the Phoenix definitions [11]. Clinical Specific Survival (CSS) was calculated from the start of treatment to the lost of BC, diagnose of metastatic disease or death from PCa. The BC was evaluated from the date of start the treatment until date of first biochemical failure. The follow up (FU) program also included clinical investigation, digital rectal examination and image studies.

The statistical program SPSS (statistical package for the social sciences) Inc., released 2008, Statistics for Windows, version 20.0 (SPSS Inc., Chicago, IL) was used for all statistical analysis. The analysis of OS, CSS and BC was made using the Kaplan–Meier method. The log-rank test was used to test the significance when comparing different subgroups. Univariate and multivariate Cox regression analysis were also performed. The alpha level considered for statistically significant differences was 0.05.

Results

Between March, 1997 and March, 2005 there were 305 patients treated with combination of HDR and EBRT at the Department of Radiation Oncology, AC Camargo Cancer Center, Sao Paulo, Brazil. Thirty two patients were lost of FU and the data of 273 patients was available for analysis. Sixty four (27.1%) patients had pelvic EBRT and the remaining 209 (76.5%) localized EBRT. Clinical and treatments characteristics are depicted in Tables 1 and 2.

Table 1. Patients Characteristics

Median Range Variable n %
Age (years) 64.7 42-82
Prostate Vol (cc) 36.3 19-72 <35 121 44.3
>35 152 55.7
PSAi (ng/ml) 10.3 1-52 <10 173 16.8
10-20 54 19.8
>20 46 63.4
Gleason Score <7 190 69.6
=7 58 21.2
>7 25 21.2
Yes 47 17.2
No 226 82.8
Clinical Stage <T2b 192 70.3
T2b-c 47 17.2
>T2c 34 12.5
Risk Group Low 133 48.7
Interm 76 27.8
High 64 23.4
ADT NAAD Yes 93 34.1
No 180 65.9
ADJ 91 33.3
Salvage 37 13.6
WO 145 53.2
EBRT Pelvic 64 23.4
Localized 209 76.6
Comorbidities No 146 53.5
SAH 42 15.4
Diabetes 19 7.0
Other 39 14.3
TOTAL 273 100.0

Legend: ADJ (adjuvant hormonal therapy), ADT (Androgen deprivation therapy), BF (Bichemical failure, EBRT (External beam radiotherapy), NAAD (neoadjuvant hormonal therapy), SAH (Systemic arterial hypertension), Salvage (Salvage hormonal therapy)

Table 2. Treatment  Characteristics

Median Range Variable n %
Dose EBRT 50 40-54 < 50 149 54.6
>50 124 45.4
HDR 16 133 48.7
18.3 16-20 20 140 51.3
HDR plan 2D 167 61.2
3D 106 38.8
Interval 18.5 9-61 <18 173 63.4
>18 100 36.6

Legend: EBRT (External beam radiotherapy), HDR (High-dose-rate brachytherapy), HDR plan 2D/3D (two or three dimensional planning)

The median age and FU time were 64.7 (range, 42-82) and 10.3 (range, 1-15) years, respectively. Two hundred thirteen (78.0%) patients had FU longer than 5 years, and of these 153 (56.1%) longer than 10 years.

Androgen deprivation therapy

Androgen deprivation therapy (ADT) in a short course neo-adjuvant ADT, was prescribed for less than 6 months. Neoadjuvant hormonal therapy (NAAD) was administered to 34.1% of the patients. Adjuvant hormonal therapy (ADJ) was observed, mostly, for intermediate and high risk patients (33.4%), generally for no more than 6 months for intermediate risk and up to 3-years in high risk patients. Salvage ADT was observed in 37 (90.2%) of 41 patients dead due PCa. The profile of hormonal therapy is shown in Tables 3 and 4.

Table 3. Neoadjuvant Hormonal therapy according to Risk Group – Risk NAAD Cross tabulation

NAAD
 Risk Group WO % YES  % Total %
Low 74 27.1 8 2.9 82 30.0
Interm 65 23.8 35 12.8 100 36.6
High 41 15.0 50 18.3 91 33.3
             Total 180 65.9 93 34.1 273 100

Legend: ADJ (adjuvant hormonal therapy), Interm (intermediate), NAAD (neoadjuvant hormonal therapy), WO (without hormonal therapy)

Table 4. Adjuvant and Salvage Hormonal therapy according to Risk Group

WO   % ADJ   % Salv    % Total    %
Low 72 26.4 7 2.6 3 1.1 82 30.0
Interm 57 20.9 34 12.5 9 3.3 100 36.6
High 16 5.9 50 18.3 25 9.2 91 33.3
Total 145 53.2 91 33.4 37 13.6 273 100

Legend: ADJ (adjuvant hormonal therapy), Interm (intermediate), NAAD (neoadjuvant hormonal therapy), Salv (Salvage hormonal therapy), WO (without hormonal therapy)

The crude 10-year overall survival (OS) rate at was 52.7%. Actuarial 5- and 10-year OS, CSS and BC were 80.1%, 89.8%, 83.7%, 63.6%, 85.5% and 71.8%, respectively. (Figures 1-3)

Figure 1- Overall Survival

    Figure 1. Overall Survival

Figure 2 - Clinical Specific Survival

Figure 2. Clinical Specific Survival

Figure 3 - Clinical Specific Survival by Risk Group

Figure 3. Clinical Specific Survival by Risk Group

Univariate and multivariate analysis

On univariate analysis GS <7, clinical stage <T2b, low risk group, absence adjuvant ADT, older age (>65-years), PSAi Univariate analysis failed to identify neoadjuvant androgen deprivation therapy (NAAD) as a predictor for BC in all group risks (p=ns). When we pooled the intermediate and high risk group into a unique denominated unfavorable risk group, NAAD also failed to predict improved CSS and BC.

Multivariate Cox regression analysis confirmed low risk group (HR 0.03, 95% CI 0.006-0.116, p<0.001) and intermediate risk (HR 0.09, 95% CI 0.042-0.216, p<0.001) compared to high risk, presence of ADT (HR 0.39, 95% CI 0.179-0.868, p=0.021) as favorable predictors for CSS. GS >7 (HR 3.24, 95% CI 1.279-8.220, p<0.001), PSA >10 (HR 6.19, 95% CI 2.015-19.041, p=0.001), age >65 years (HR 2.87, 95% CI 1.264-6.504, p=0.012) and EBRT dose >50 Gy (HR 14.50, 95% CI 1.874-112.164, p=0.010) were confirmed as adverse predictors for CSS. Tables 6-8, Figures 4-9.

Low risk group compared to intermediate, (HR 0.70, 95% CI 0.023-0.213, p<0.001) and high risk (HR 0.99, 95% CI 0.052-0.190, p<0.001) groups, was a favorable predictive factor for BC. GS >7 (HR 3.09, 95% CI 1.473-6.473, p=0.003) and PSAi >10 (HR 6.18, 95% CI 2.331-16.393, p<0.001) were negative predictive factor for BC.

Low risk group was confirmed as the only predictive factor for OS when compared to intermediate (HR 0.28, 95% CI 0.133-0.608, p=0.001) and high (HR 0.38, 95% CI 0.223-0.665, p=0.001) risk groups.

Figure 4. Clinical Specific Survival by Clinical Stage

Figure 4. Clinical Specific Survival by Clinical Stage

Figure 5. Clinical Specific Survival by Gleason Score

Figure 5. Clinical Specific Survival by Gleason Score

Figure 6. Clinical Specific Survival by Initial PSA

Figure 6. Clinical Specific Survival by Initial PSA

Figure 7. Hazard Plots - Clinical Specific Survival by Risk Group

Figure 7. Hazard Plots – Clinical Specific Survival by Risk Group

Figure 8. Biochemical Control

Figure 8. Biochemical Control

Figure 9. Hazard Plots - Biochemical Control by Risk Group

Figure 9. Hazard Plots – Biochemical Control by Risk Group

Table 6. Cox regression for CSS

B SE Wald df Sig. Exp(B) 95.0% CI for Exp(B)
Lower Upper
LR 44.294 2 .000
IR -3.641 .761 22.910 1 .000 .026 .006 .116
HR -2.351 .418 31.579 1 .000 .095 .042 .216
EBRT

Pelvic x Local

-.110 .312 .124 1 .724 .896 .486 1.651
2D x 3D -1.861 1.134 2.693 1 .101 .156 .017 1.436
ADT -.931 .403 5.336 1 .021 .394 .179 .868
PSAi <10 10.858 2 .004
PSAi (>10<20) 1.925 .661 8.481 1 .004 6.856 1.877 25.048
PSAi (>20) 1.824 .573 10.133 1 .001 6.195 2.015 19.041
GS <7 7.328 2 .026
GS = 7 .335 .709 .223 1 .636 1.398 .349 5.608
GS >7 1.176 .475 6.145 1 .013 3.243 1.279 8.220
CS <T2b 3.350 2 .187
CS T2b/T2c -.662 .551 1.443 1 .230 .516 .175 1.519
CS >T2c .464 .818 .321 1 .571 1.590 .320 7.895
Age <65y 1.053 .418 6.352 1 .012 2.867 1.264 6.504
EBRT <50Gy 2.674 1.044 6.562 1 .010 14.498 1.874 112.164
HDR dose <20Gy 1.763 1.023 2.973 1 .085 5.830 .786 43.261
Interval EBRT to HDR -.187 .303 .381 1 .537 .829 .458 1.502

Legend: 2D (two dimensional plan), 3D (tridimensional plan), ADT (Androgen deprivation therapy), BC (biochemical control), Comorb (Comorbidites), CS (Clinical stage), CSS (Clinical Specific Survival), EBRT (External beam radiotherapy), GS (Gleason score), IR (Intermediate risk group), HDR (High-dose-rate brachytherapy), HR (High risk group), LR (Low risk group), NAAD (neoadjuvant hormonal therapy), OS (overall survival), P vol. (Prostate volume cc)

Table 7. Cox regression for BC

B SE Wald df Sig. Exp(B) 95.0% CI for Exp(B)
Lower Upper
LR 62.053 2 .000
IR -2.660 .568 21.948 1 .000 .070 .023 .213
HR -2.309 .330 48.920 1 .000 .099 .052 .190
2D x 3D -.789 .656 1.448 1 .229 .454 .126 1.642
ADT -.455 .307 2.192 1 .139 .634 .347 1.159
PSAi <10 13.634 2 .001
PSAi (>10<20) 1.822 .498 13.403 1 .000 6.182 2.331 16.393
PSAi >20 1.346 .462 8.494 1 .004 3.843 1.554 9.502
GS <7 8.944 2 .011
GS =7 .957 .465 4.240 1 .039 2.603 1.047 6.469
GS >7 1.127 .378 8.915 1 .003 3.088 1.473 6.473
CS <T2b 2.825 2 .244
CS T2b/T2c -.647 .410 2.493 1 .114 .523 .234 1.169
CS >T2c -.306 .580 .278 1 .598 .737 .236 2.294
EBRT 50Gy 1.411 .550 6.590 1 .010 4.101 1.396 12.044
HDR dose <20Gy -.470 .680 .477 1 .490 .625 .165 2.370
Interval EBRT to HDR -.064 .230 .078 1 .780 .938 .597 1.473

Legend: 2D (two dimensional plan), 3D (tridimensional plan), ADT (Androgen deprivation therapy), BC (biochemical control, Comorb (Comorbidites), CS (Clinical stage), CSS (Clinical Specific Survival), EBRT (External beam radiotherapy), GS (Gleason score), IR (Intermediate risk group), HDR (High-dose-rate brachytherapy), HR (High risk group), LR (Low risk group), NAAD (neoadjuvant hormonal therapy), OS (overall survival), P vol. (Prostate volume)

Table 8. Cox regression for OS

B SE Wald df Sig. Exp(B) 95.0% CI for Exp(B)
  Lower Upper
ADJ .149 0.3 0.3 1 .580 1.161 .684 1.970
Age <65y .223 0.2 1.0 1 .322 1.250 .804 1.942
Comorbidity -.310 0.2 2.1 1 .149 .734 .482 1.117
EBRT

Pelvic x Local

-.089 0.2 0.1 1 .722 .915 .560 1.494
LR 14.3 2 .001
IR -1.259 0.4 10.5 1 .001 .284 .133 .608
HR -.954 0.3 11.7 1 .001 .385 .223 .665

Legend: ADJ (adjuvant hormonal therapy, EBRT (External beam radiotherapy), IR (Intermediate risk group), HDR, HR (High risk group), LR (Low risk group), OS (overall survival)

Discussion

Conventional EBRT to treat PCa is securely limited to doses of 64–70 Gy in 1.8–2.0 Gy fractions. These levels of doses are determined by the risk of long-term toxic effects to the bladder and rectum. The clinical and biochemical relapse rates associated with these dose levels are around 33% within 5 years. Peeters et al 12 published the results of a randomized trial comparing total doses of 68 Gy and 78 Gy using EBRT alone. The 5-year OS in the higher dose arm of that study was 83% using ASTRO definition and the BC was significantly better in the 78-Gy arm compared to the 68-Gy arm, with an adjusted hazard ratio of 0.74 (p=0.02). Other published reports using dose-escalated photon beam EBRT alone also point in the same direction with respect to their long-term BC results [13-14].

HDR can escalate the dose given to the prostate by the combination with EBRT, and further more, in locally advanced disease has also the possibility of including the seminal vesicles when they needed to be encompassed. HDR has also a potential biological advantage through the delivery of high doses per fraction [10]. It is important to note that the comparisons between series published are difficult due differences in the techniques and planning for both, EBRT and HDR.

The combination of values of PSAi, GS and CS to identify a more or less aggressive disease has being extensively discussed in the literature, and was confirmed by this study. The most frequent challenge is to identify, for example the indication of prostate versus pelvic EBRT, varying risk categories, absence or use of NAAD, ADT and their length. Despite this, the combination of HDR and EBRT provides an optimal modulation of dose delivery. Results of this combination, in terms of BC and with more than 5 years of FU, range from 57% to 100% according to the risk group for biochemical failure (Table 9).

Table 9. Results of biochemical control by risk groups in series of HDR plus EBRT with more than 5-year follow up

Reference n Median FU  (months) Biochemical control by risk groups (%)

Low       Intermediate       High

Dose in Gy

(HDR(n.fx)/EBRT)

13 344 61 84 74 19.5(3) / 46
14 121 63 91 10(1)/50
15 313 68 100 88 79 23(2)/46
16 229 61 95 90 57 21(3)/50.4
17 64 105 84 80 18(3)/45
18 90 95 80 16.5(3)/45
19 264 75 97 18(3)/45
20 100 62 84 82 10(1)/60
21 64 61 100 91 21(3)/50
22 196 66 86 18(3)/46
23 131 63 87 71 30(4)/45

The search for factors predicting BC and CSS is important on defining what patients should be treated more aggressively. We, as other authors [26-28] observed that PSAi <10 ng/ml was confirmed as a favorable predictive factor related to BC and CSS.

Age<65 years was found to be an adverse prognostic factor in our analysis for CSS, with a marginally statically significance impact on OS, not confirmed on multivariate analysis. Smolska-Ciszewska et al, conversely to our results, noted that younger age at time of treatment impacted only on OS, not explaining if there was any association between treatment and side effects or worsening of associated comorbidities. As in our analysis, they found that low risk group and association of HDR to EBRT correlated with improved BC [29].

As in our results, Kamrava et al found that T stage, GS, and use of ADT were significantly associated with CSS on univariate analysis, but on multivariate analysis only GS and use of ADT were significantly associated CSS [30]

It is expected that the grouping of the patients in risk groups for biochemical failure based on PSAi, GS and CS, to aggregate patients with adverse features in the intermediate and high risk, leading to worse CSS and BC for the two last one, what was confirmed in our analysis. This was also observed by Morris et al [31].

In our series, as in others, patients who received adjuvant ADT had significantly higher risk features suggesting patient selection bias for CSS in this group of patients, instead of a negative interaction between HDR and EBRT [31-32].

Mature data in the literature evaluated the 10-year outcomes of intermediate- and high-risk patients noting a clear dose response by increasing the dose escalation through HDR doses [27]. More recently the use of Intensity modulated radiation therapy combined to HDR has being investigated. Chen et al. published the results of 148 patients treated with HDR – 22 Gy in 4 fractions followed IMRT up to 50.4Gy. All patients with Gleason score of 8 or higher had ADT for 1 year. They noted a 4-year actuarial CSS of 96.8% and of 100%, 100% and 94% for low, intermediate and high risk, respectively [32].

The results of the first randomized prospective trial, which has addressed dose escalation using an HDR and EBRT is a trial with a relatively slow accrual rate. There are some critics that must be addressed as the changes in EBRT technique during the time of the study, and, by current standards, the control arm is a relatively low-dose treatment. Despite that, the study reported the results of 218 patients treated between 1997 and 2005. There were 108 patients assigned to EBRT alone and 110 patients treated by EBRT followed by HDR. They noted that CSS was significantly higher in patients treated with combined modality (p = 0.04). In multivariate analysis the category treatment modality and ADT were significant covariates for BC, but with no differences in OS, as observed in our study. After a median follow-up time of 10.5 year follow-up, an 18% increase in CSS was obtained relative to EBRT alone, reflecting a 31% reduction in the risk of recurrence (p = 0.01) and no evidence of an increase in long-term severe morbidity [9].

Surgically induced gland deformation is inevitable during brachytherapy procedures. We observed that the use more of advanced methods of images (3D plan based on CT, MR or TRUS) images to identify the target, organs at risk and needles is important and have already been reported to impact on BC and CSS [33]. In our analysis Multivariate Cox regression analysis confirmed EBRT dose >50 Gy as predictor for CSS and BC, but with no impact on OS. This may be explained by the relative low dose per fraction schedule used in both groups. Of importance is to note that the dose given by HDR was relative constant thorough the risk groups, leading to higher biological effective dose to intermediate and high risk patients, and even though, these patients had a worse outcome, showing that there is space for further studies of dose escalation or treatment combination. After 2005 with the introduction of real time TRUS image acquisition and planning we have changed our protocol and moved forward for a more intense dose escalation, increasing dose and reducing the number of fractions.

Other information of this study is that presence of NAAD had no impact on DSS, BC or OS in any risk group, showing that this treatment strategy should be reserved for downsizing the prostate prior to treatment, in special for low risk patients.

In conclusion, this report demonstrates that HDR combined with EBRT is an important and effective method in achieving dose escalation in the radical radiotherapy of PCa. This combination has also the advantage of treatment time reduction and in increasing in the capability of work load of the linear accelerators, especially in developing countries, where waiting lists and lack of radiation oncology facilities are a reality. The present data represents a unique uni-institutional study at long FU for the given technique, and a comparison with the current literature confirms the excellent results achieved with this treatment modality. The satisfactory BC, CSS and OS are probably result of improved LC achieved with dose escalation, showing that HDR is an optimal alternative method of local dose escalation when combined to EBRT.

References

  • Quinn MJ, d’Onofrio A, Møller B, Black R, Martinez-Garcia C, et al. (2003) Cancer mortality trends in the EU and acceding countries up to 2015. Ann Oncol 14: 1148-1152. [crossref]
  • http://www.inca.gov.br/estimativa/2014/sintese-de-resultados- comentarios.asp
  • Novara G, Ficarra V, Mocellin S, et al. (2012) Systematic review and meta-analysis of studies reporting oncologic outcome after robot-assisted radical prostatectomy. Eur Urol 62: 382.
  • Al-Mamgani A, van Putten WL, Heemsbergen WD, van Leenders GJ, Slot A, et al. (2008) Update of Dutch multicenter dose-escalation trial of radiotherapy for localized prostate cancer. Int J Radiat Oncol Biol Phys 72: 980-988. [crossref]
  • Dearnaley DP, Sydes MR, Graham JD, et al. (2007) Escalated-dose versus standard-dose conformal radiotherapy in prostate cancer: first results from the MRC RT01 randomized controlled trial. Lancet Oncol 8: 475.
  • Kuban DA, Tucker SL, Dong L, Starkschall G, Huang EH, et al. (2008) Long-term results of the M. D. Anderson randomized dose-escalation trial for prostate cancer. Int J Radiat Oncol Biol Phys 70: 67-74. [crossref]
  • Zietman AL, DeSilvio ML, Slater JD, et al. (2005) Comparison of conventional-dose vs high-dose conformal radiation therapy in clinically localized adenocarcinoma of the prostate: a randomized controlled trial. JAMA 294: 1233.
  • Pellizzon AC, Salvajoli JV, Maia MA, et al. (2004) Late urinary morbidity with high dose prostate brachytherapy as a boost to conventional external beam radiation therapy for local and locally advanced prostate cancer. J Urol 171: 1105.
  • Hoskin PJ, Rojas AM, Bownes PJ, et al. (2012) Randomized trial of external beam radiotherapy alone or combined with high-dose-rate brachytherapy boost for localized prostate cancer. Radiother Oncol 103: 217.
  • Pellizzon AC, Nadalin W, Salvajoli JV, Fogaroli RC, et al. (2003) Results of high dose rate afterloading brachytherapy boost to conventional external beam radiation therapy for initial and locally advanced prostate cancer. Radiother Oncol 66: 167.
  • Roach M 3rd, Hanks G, Thames H Jr, et al. (2006) Defining biochemical failure following radiotherapy with or without hormonal therapy in men with clinically localized prostate cancer: recommendations of the RTOG-ASTRO Phoenix Consensus Conference. Int J Radiat Oncol Biol Phys 65: 965.
  • Peeters ST, Heemsbergen WD, Koper PC, et al. (2006) Dose-response in radiotherapy for localized prostate cancer: results of the Dutch multicenter randomized phase III trial comparing 68 Gy of radiotherapy with 78 Gy. J Clin Oncol
  • Pollack A, Zagars GK, Starkschall G, Antolak JA, Lee JJ, et al. (2002) Prostate cancer radiation dose response: results of the M. D. Anderson phase III randomized trial. Int J Radiat Oncol Biol Phys 53: 1097-1105. [crossref]
  • Dearnaley DP, Sydes MR, Graham JD, et al. (2007) Escalated dose versus standard-dose conformal radiotherapy in prostate cancer: first results from the MRC RT01 randomized controlled trial. Lancet Oncol 8: 475.
  • Khor R, Duchesne G, Tai KH, et al. (2013) Direct 2-arm comparison shows benefit of high-dose-rate brachytherapy boost vs external beam radiation therapy alone for prostate cancer. Int J Radiat Oncol Biol Phys 85: 679.
  • Cury FL, Duclos M, Aprikian A, et al. (2012) Single-fraction high-dose-rate brachytherapy and hypofractionated external beam radiation therapy in the treatment of intermediate-risk prostate cancer – long term results. Int J Radiat Oncol Biol Phys 82: 1417.
  • Prada PJ, González H, Fernández J, Jiménez I, Iglesias A, et al. (2012) Biochemical outcome after high-dose-rate intensity modulated brachytherapy with external beam radiotherapy: 12 years of experience. BJU Int 109: 1787-1793. [crossref]
  • Kotecha R, Yamada Y, Pei X, Kollmeier MA, Cox B, et al. (2013) Clinical outcomes of high-dose-rate brachytherapy and external beam radiotherapy in the management of clinically localized prostate cancer. Brachytherapy 12: 44-49. [crossref]
  • Kaprealian T, Weinberg V, Speight JL, et al. (2012) High-dose-rate brachytherapy boost for prostate cancer: comparison of two different fractionation schemes. Int J Radiat Oncol Biol Phys 82: 222.
  • Savdie R, Symons J, Spernat D, Yuen C, Pe Benito RA, et al. (2012) High-dose rate brachytherapy compared with open radical prostatectomy for the treatment of high-risk prostate cancer: 10 year biochemical freedom from relapse. BJU Int 110 Suppl 4: 71-76. [crossref]
  • Aluwini S, van Rooij PH, Kirkels WJ, Jansen PP, Praag JO, et al. (2012) High-dose-rate brachytherapy and external-beam radiotherapy for hormone-naïve low- and intermediate-risk prostate cancer: a 7-year experience. Int J Radiat Oncol Biol Phys 83: 1480-1485. [crossref]
  • Agoston P, Major T, Fröhlich G, et al. (2011) Moderate dose escalation with single-fraction high-dose-rate brachytherapy boost for clinically localized intermediate- and high-risk prostate cancer: 5-year outcome of the first 100 consecutively treated patients. Brachytherapy 10: 376.
  • Ghadjar P, Keller T, Rentsch CA, Isaak B, Behrensmeier F, et al. (2009) Toxicity and early treatment outcomes in low- and intermediate-risk prostate cancer managed by high-dose-rate brachytherapy as a monotherapy. Brachytherapy 8: 45-51. [crossref]
  • Zwahlen DR, Andrianopoulos N, Matheson B, Duchesne GM, Millar JL (2010) High-dose-rate brachytherapy in combination with conformal external beam radiotherapy in the treatment of prostate cancer. Brachytherapy 9: 27-35. [crossref]
  • Viani GA, Pellizzon AC, Guimarães FS, Jacinto AA, dos Santos Novaes PE, et al. (2009) High dose rate and external beam radiotherapy in locally advanced prostate cancer. Am J Clin Oncol 32: 187-190. [crossref]
  • Aoki M, Miki K, Kido M, et al. (2014) Analysis of prognostic factors in localized high-risk prostate cancer patients treated with HDR brachytherapy, hypofractionated 3D-CRT and neoadjuvant/adjuvant androgen deprivation therapy (trimodality therapy). J Radiat Res 55: 527.
  • Martinez AA, Gonzalez J, Ye H, et al. (2011) Dose escalation improves cancer-related events at 10 years for intermediate- and high-risk prostate cancer patients treated with hypofractionated high-dose-rate boost and external beam radiotherapy. Int J Radiat Oncol Biol Phys 79: 363.
  • Shigehara K, Mizokami A, Komatsu K, Koshida K, Namiki M (2006) Four year clinical statistics of iridium-192 high dose rate brachytherapy. Int J Urol 13: 116-121. [crossref]
  • Smolska-Ciszewska B, Miszczyk L, Bialas B, et al. (2015) The effectiveness and side effects of conformal external beam radiotherapy combined with high-dose-rate brachytherapy boost compared to conformal external beam radiotherapy alone in patients with prostate cancer. Radiat Oncol 10: 366.
  • Kamrava M, Rwigema JC, Chung M, Banerjee R, Wang J, et al. (2013) Predictors of distant metastasis after combined HDR brachytherapy and external beam radiation for prostate cancer. J Contemp Brachytherapy 5: 127-133. [crossref]
  • Morris LM, Izard MA, Wan WY (2015) Does prostate-specific antigen nadir predict longer-term outcome es of prostate cancer after neoadjuvant and adjuvant androgen deprivation therapy in conjunction with brachytherapy? Brachytherapy 14: 322.outcome
  • Chen WC, Tokita KM, Ravera J, Fu P, Jiang Y, et al. (2013) Four-year outcomes of hypofractionated high-dose-rate prostate brachytherapy and external beam radiotherapy. Brachytherapy 12: 422-427. [crossref]
  • Pellizzon AC, Salvajoli J, Novaes P, et al. (2008) The relationship between the biochemical control outcomes and the quality of planning of high-dose rate brachytherapy as a boost to external beam radiotherapy for locally and locally advanced prostate cancer using the RTOG-ASTRO Phoenix definition. Int J Med Sci 5: 113.

Is Intravenous Iron Treatment a Risk for Infection?

Abstract

Background: Iron is a pro-oxidant and an essential nutrient for different bacteria. Experimental animal studies have demonstrated exacerbating sepsis episodes. Intravenous iron treatment has been implicated, at least theoretically in increasing infection episodes. However, these studies did not obtain any conclusion in this respect. Therefore, the aim of our study was to evaluate whether there is a risk between intravenous iron treatment and infection episodes following iron treatment.

Methods: In our study, 186 patients who received intravenous iron treatment were included. The biochemical parameters included “pre and post iron treatment” (e.g., ferritin, serum iron, transferring saturation, and hemoglobin) and the later emergence of infections. Moreover, we evaluated all possible risk factors that could interfere with the subsequence appearance of infection.

Results: Infectious complications were reported in 24 patients (12.8%) after the iron treatments began, and no infection was reported in 87.15% (n=162) of the patients. The most common infections were urinary (33%) and respiratory infections (25%). The most common infectious agents were enterobacteriae (e.g., E coli, E faecalis, and E faecium). Notably, we did not observe any intracellular pathogens. In our statistical survey, we did not find a relationship between infection onset and intravenous iron treatment. To analyze the baseline disease, comorbidities, such as diabetes and other treatment (e.g., corticosteroids or anti-TNF) were evaluated, and, no association was found.

Conclusion: In our study, intravenous iron was an effective treatment to correct anemia, and it did not appear to correlate with the development of secondary infections.

Key words

iron therapy; intravenous iron; iron infection

Abbreviations

IV – intravenous; HD – hemodialysis infection

Introduction

Iron is an important nutrient for many bacteria, and in laboratory animals, it was shown to exacerbate sepsis. [1] It has been postulated that increased plasma iron is responsible for the association of hemochromatosis with infections by Vibrio vulnificus, Yersinia enterocolitica, and Escherichia coli. [2] Accordingly, there are host defense mechanisms that tend to restrict the available iron from invading pathogens. [3] For example, the transferrin receptor is the major pathway for delivery of iron to peripheral tissues through endocytosis of its ligand, transferrin, which binds to iron and circulates in the plasma. Down regulation of the transferrin receptor limits the cell’s ability to acquire transferrin-bound iron and concomitantly reduces the endosomal pool of iron that can be accessed by intracellular pathogens, such as L. pneumophila, Mycobacterium tuberculosis, and Mycobacterium avium, and thus restricts their growth. [4, 5] Iron repletion with oral iron has been associated with adverse outcomes for certain infections. In a study of 137 iron-deficient Somali nomads, who were treated with placebo or oral iron (71 subjects), Murray et al. noted seven infection episodes in the placebo group and 36 in the oral iron group (including reactivation of preexisting malaria, brucellosis, and tuberculosis). [6] A large iron supplementation trial of young children on Pemba Island, was prematurely terminated as a result of an excess of serious adverse events (including deaths) in those receiving iron. [7] Ferric iron (Fe)–carbohydrate complexes are widely used for treating Fe deficiency in patients who are unable to meet their Fe requirements with oral supplements. [8] Intravenous (IV) Fe is generally well tolerated and effective in correcting Fe-deficient states. However, complexing Fe to carbohydrate polymers does not block its potent pro-oxidant effects; therefore, systemic free radical generation and, possibly, tissue damage may result. [9] On the other hand, excessive iron administration may lead to oversaturation of transferrin and the release of free, catalytically active iron into circulation (NTBI) [10] which could be readily utilized by bacteria, leading to their multiplication and the possibility of an overwhelming infection. [11, 12] The aim of the present work was to determine the short-term infection rate associated with IV iron treatment and the possible risk factors that can predict these infections in a contemporary patient cohort.

Material and methods

Patient enrollment A retrospective, longitudinal study was carried out at Marqués de Valdecilla University Hospital (Santander, Spain). The hospital records of patients who underwent ambulatory treatment with IV iron at the hospital day center between January 2011 and December 2012 were reviewed.

Patient parameter evaluation The medical records of these patients were searched after institutional review board approval was obtained for the following data fields: a) demographic features; b) principal diagnosis; c) comorbid factors, such as diabetes mellitus, arterial hypertension, and dislipemia; d) concomitant treatment as potential infection causes, such as corticosteroids, immunosuppresive therapy, and anti-TNF treatment; e) previous infection, and; f) laboratory data prior to and after IV iron treatment, such as hemoglobin concentration, mean cell hemoglobin (MCH), mean cell hemoglobin concentration (MCHC), red cell volume distribution width (RDW), serum iron, transferrin saturation, and serum ferritin.

Intravenous iron treatment One thusand mg (50 mg/ml) of ferric carboxymaltose was administered in an ambulatory regimen to the subjects at the hospital day center. The doses of this treatment were adapted subsequently according to the Ganzoni equation and their efficacy.

Case definitions We used a retrospective cohort design with a 1-month baseline period. After IV iron treatment was started, all of the patients were followed for 3 months. We looked for any infectious diseases, and we differentiated the subjects by bacterial, viral and fungal infections, as well as by gastrointestinal, genitourinary, respiratory and other diseases. If a single blood culture was positive for coagulase-negative staphylococci, Corynebacteria, or Bacillus sp., the culture was considered contaminated or representative of a transient bacteremia but not of a bacteremic episode. All other situations in patients in whom at least one blood culture was positive were defined as bacteremic episodes.

Statistical Analysis The results were analyzed with the SPSS 15.0 computer software package (Statistical Package for Social Sciences, Inc., Chicago. IL). Continuous variables were summarized as the means or as the medians and ranges. Categorical variables were compared with the chi-square and Fisher´s exact tests. Correlations between the data sets were examined using the Pearson (r) or Spearman rank (rs) correlation coefficients. Any differences were considered significant for all statistical tests at p values of less than 0.05.

Results

A total of 186 adult patients (70 men and 116 women; mean age, 63 yrs; range, 18 to 80 yrs) were enrolled. The principal diagnosis of the patients included in the study were cardiac diseases (n=41, 22%), neoplasm diseases (n=32, 17.2%), renal diseases (n=31, 16.7%), malnutrition due to bariatric surgery (n=19, 10.2%), hepatic diseases (n=15, 8.1%), and lung diseases (n=15, 8.1%) (Table 1). A comorbid condition known to increase the infection risk was found in 88 patients (47.3%), which included diabetes mellitus (n = 53), current malignancy (n = 32) (under treatment and/or not cured), being a transplant recipient (n= 3), and having both a malignancy and diabetes mellitus (n= 5). Twelve patients were treated with corticosteroids and six were treated with anti-TNF therapy. The pretreatment median hemoglobin level was 9.5 gr/dL (5.6- 12.6 gr/ dL) and after the treatment it was 11.8 gr/dL (7.4-14.1 gr/dL) (Table 2). Additionally, we found a statistically significant difference between the baseline biochemical iron metabolism parameters pre-and post IV iron treatment (Table 2). Thus, we corroborated that IV iron was an effective therapy in our patients.

Table 1. The principal diagnosis of the patients included in the study

Disease n (%)
Cardiac diseases 41 (22%)
Neoplasms diseases 32 (17.2%)
Kidney disease 31 (16.7%)
Bariatric surgery 19 (10.2%)
Liver diseases 15 (8.1%)
Lung diseases 15 (8.1%)
Others 33 (17.7%)

Table 2. The baseline laboratory iron metabolism parameters pre-and post-intravenous iron treatment

  Pre-treatment Post-treatment P
Hemoglobin (gr/dL) 9.5 (5.6-14.5) 11.8 (7.4- 14.10) <0.01
MCH (pg/RBC) 26.4 (8.6-37.5) 29.9 (21.8-37.4) <0.01
MCHC (gr/dL) 32.4 (28.6-35.3) 33.1 (25.5-35.3) <0.01
RDW (%) 18.9 (12.2-37.4) 21.4 (9-43.6) <0,01
Serum iron (mcg/dL) 25 (10-96) 69 (16-177) <0.541
Transferrin saturation (Fe/TIBC)% 7 (2-37) 23,5 (5-62) <0.01
Serum ferritin 54 (2-753) 408 (10-1492) <0.01

MCH – mean cell hemoglobin;
MCHC – mean cell hemoglobin concentration;
RDW – red cell volume distribution width.

No patients had more than one bacteremic episode within the month prior to treatment. Twenty-four patients (12.9%) suffered from one infection episode after the IV iron treatment, and 162 patients (87.1%) did not have any infection episodes. The majority of these infections were from bacterial microorganisms (75%, n=18) followed by unknown etiologies (16.7% n=4) and viral episodes (8.3%, n=2). There were no fungal infections. The urinary tract was involved in 33.3% of the cases (n=8); 25% of the cases involved therespiratory system (n=6), which was similar to the unknown focus case percentage; and 16.7% of the cases involved the gastrointestinal system (n=4). The infectious agent was unknown in 63.5% of the cases (n=15). The pathogens responsible for these episodes were E coli (16.7%, n=4) followed by E faecalis, E faecium, Lysteria and Proteus mirabilis, which all occurred in 4.2% of the cases (n=1). No intracellular microorganisms or non-capsulated bacteria were found in our series. Additionally, no serious diseases and no mortality cases were reported three months after the treatments began.

The main characteristics of the patients with and without infection episodes are shown in Table 3. More patients with an infection episode had a comorbidity (diabetes or malignancy) and ongoing immunosuppressive therapy than the patients without infections. However, this was not statistically significant. Furthermore, when we analyzed the relationship between infections with other comorbidities, such as diabetes, cancer, transplantation or treatments such as steroids or anti-TNF we did not find any association.

Table 3. Comorbidity incidences in the infection or no infection groups

  Infection No Infection p
Diabetes mellitus 8 (33.3%) 45 (28.3%) NS
Arterial hypertension 14 (58.3%) 65 (40.1%) NS
Dislipemia 5 (20.8%) 23 (14.2%) NS
Cardiac diseases 7 (29.2%) 34 (21%) NS
Renal diseases 7 (29.2%) 24 (14.8%) NS
Lung diseases 1 (4.2%) 14 (8.6%) NS
Liver diseases 1 (4.2%) 14 (8.5%) NS
Bariatric surgery 3 (12.5%) 16 (9.9%) NS
Neoplasm 7 (29.2%) 25 (15.4%) NS
Organ transplantation 0 (0%) 3 (1.9%) NS
Corticosteoids 3 (12.5%) 9 (5.6%) NS
Biologic therapy 1 (4.2%) 5 (3.1%) NS

NS – Non-Significant

Discussion

Almost all life forms require iron because of its involvement in basic cellular processes. Free iron was shown to potentiate bacterial growth in vitro. [13] In fact, during infections, pathogens use various means to acquire iron from their hosts, whereas hosts attempt to withhold it from pathogens. [14, 15] Iron therefore represents a point of conflict between the host and the pathogen, and an altered iron balance associated with poor outcomes in several infectious diseases, including malaria, [7] tuberculosis, [16] and HIV-1 infection. [17] Furthermore, certain bacterial species, including E. Coli, Klebsiella spp., and Salmonella spp., use unbound iron in the blood to enhance their growth. These organisms release siderophores, which are iron chelators, into the blood. Once these siderophores are released, bacteria can compete with proteins, such as transferrin for unbound iron in the serum. [18, 19] Staphylococcus aureus and Haemophilus influenzae do not possess siderophore; however, they do have transferrin receptors, which allow these bacteria to use iron for growth. [18] Vibrio vulnificus cannot grow if there is no iron available, and their virulence depends on the ability to obtain iron combined with transferrin. Hepcidin, which is produced during innate immune responses to infections, reduces the iron availability in the serum by inhibiting ferroportin function in macrophages and enterocytes and potentially limits extracellular pathogen growth therein. [20] Intravenous iron may also impair immune function and increase infection susceptibility. [21] Gupta et al. [22] found that exposure of mononuclear cells to IV iron agents induced significant intracellular oxidative stress and shortened CD4+ T lymphocyte survival. High doses of IV iron agents impaired the phagocytic activity and microbial killing capability of polymorphonuclear leukocytes [23-25]. Furthermore, in a recent in vitro study, iron sucrose led to impaired phagocytic function and increased polymorphonuclear leukocyte apoptosis. [26] However, the current evidence in clinical practice cannot determine whether iron supplementation increases the risk of infection or worsens outcomes due to infection. [27, 28] There is increasing data to suggest that infective and adverse-event risks may be related to the intensity and frequency of IV iron dosing. [29-31] Brookhart et al. [32] studied iron dosing patterns in a retrospective cohort of 117.050 prevalent hemodialysis (HD) patients and found that administration of large boluses of IV iron for repleting iron deficiency was associated with increased infection-related hospitalization or death compared with smaller doses of IV iron maintenance therapy. The risk of infection-related hospitalization was increased further in patients who experienced infections within the past month. Similarly, the DOPPS study showed a trend towards an increase infection.related mortality in prevalent HD patients treated with > 300 mg of IV iron. [33] A recent meta-analysis of randomized controlled trials evaluating IV iron use (often administered as frequent boluses) in patients with varying infective risk profiles found IV iron to be associated with a 30% greater risk of infection compared with oral or no iron therapy. [34] Conversely, a prospective observational study of 985 patients failed to demonstrate a relationship between infection and serum ferritin or IV iron dosing. [35] In our study, large IV iron boluses were an effective treatment for anemia that was caused by different etiologies, because hemoglobin increased at 2 or 3 points at the end of the treatment and we found any relationship between IV iron administration and infection, which was similar to the previously published data. Furthermore, in our study, transferrin saturation increased to 23.5%, thereby leaving little to no unbound iron available for bacterial utilization, as shown in previous in vitro studies. [10] For example, in the K. pneumonia case, bacterial suppression occurred throughout its incubation until the transferrin saturation exceeded 60%, at which time bacterial growth occurred. [19] Another in vitro study showed that the inhibition of Staphylococcus epidermidis growth was lost once the transferrin saturation exceeded 80%. [18] Subsequent studies had ambiguous results that left the relationship somewhat unclear. [36, 37] In a retrospective observational cohort study of 23.000 adult patients on HD hospitalized for bacterial infection, Ishida et al. found no association between iron treatment and readmission for infection. [38] Feldman’s group, in a re-analysis of their HD cohort using multivariable analysis, showed no statistically significant association between any level of iron administration and mortality. [39] Moreover, a French multicenter prospective study regarding bacteremia risk factors in HD patients (EPIBACDIAL) did not find any correlation between parenteral iron or ferritin and bacteremia. [40] Furthermore, in the Anker study, quality of life and functional status improved in heart failure (a relatively high-risk group) without an increase in infections [41].

Our study had limitations due to its retrospective nature. However, of the patients who were analyzed, we found a 12.8% infections after the beginning of iron therapy. Notably, an important difference in our study compared with the previously published studies was that we did not find any association between IV iron treatment and intracellular pathogens.

In conclusion, based on our study, iron treatment is safe and it does not associate with the development of new infections. However, the infection relationship is not clear and many studies are treating to investigate the different mechanisms regarding this issue. It is important to verify this result with other studies to improve the care and future treatment of patients because iron treatment is frequently used worldside. This knowledge can improve anemia management and avoid side effects. Thus, large multi-centered randomized controlled trials designed to evaluate both the short- and long-term safety of different IV iron dosing regimens are still required to determine the optimal iron therapy.

Conflict of interests

No conflict of interest exists and all authors had full access to all the data used in the study and take full responsibility for the decision to submit the manuscript for publication.

References

  • Guerinot ML (1994) Microbial iron transport. Annu Rev Microbiol 48: 743-772. [crossref]
  • Khan FA, Fisher MA, Khakoo RA (2007) Association of hemochromatosis with infectious diseases: expanding spectrum. Int J Infect Dis 11: 482-487. [crossref]
  • Wander K, Shell-Duncan B, McDade TW (2009) Evaluation of iron deficiency as a nutritional adaptation to infectious disease: an evolutionary medicine perspective. Am J Hum Biol 21:172-179.
  • Byrd TF, Horwitz MA (1989) Interferon gamma-activated human monocytes downregulate transferrin receptors and inhibit the intracellular multiplication of Legionella pneumophila by limiting the availability of iron. J Clin Invest 83:1457-1465.
  • Clemens DL, Horwitz MA (1996) The Mycobacterium tuberculosis phagosome interacts with early endosomes and is accessible to exogenously administered transferrin. J Exp Med 184:1349-1355.
  • Murray MJ, Murray AB, Murray MB, Murray CJ (1978) The adverse effect of iron repletion on the course of certain infections. Br Med J 2: 1113-1115. [crossref]
  • Sazawal S, Black RE, Ramsan M, Chwaya HM, Stoltzfus RJ, Dutta A, et al. (2006) Effects of routine prophylactic supplementation with iron and folic acid on admission to hospital and mortality in preschool children in a high malaria transmission setting: community-based, randomised, placebo-controlled trial. Lancet 367:133-1343.
  • Clinical practice guidelines and clinical practice recommendations for anemia in chronic kidney Disease in adults (2006) Am J Kid Dis 47 (5 suppl3): S16-S85.
  • Zager RA (2006) Parenteral iron compounds: potent oxidants but mainstays of anemia management in chronic renal disease. Clin J Am Soc Nephrol 1 Suppl 1: S24-31. [crossref]
  • Parkkinen J, von Bonsdorff L, Peltonen S, Grönhagen-Riska C, Rosenlöf K. (2000) Catalytically active iron and bacterial growth in serum of haemodialysis patients after i.v. iron-saccharate administration. Nephrol Dial Transplant 15: 1827-1834.
  • Slotki I (2005) Intravenous iron supplementation in the anaemia of renal and cardiac failure–a double-edged sword? Nephrol Dial Transplant 20 Suppl 7: vii16-23. [crossref]
  • Bullen JJ, Rogers HJ, Spalding PB, Ward CG (2005) Iron and infection: the heart of the matter. FEMS Immunol Med Microbiol 43: 325-330. [crossref]
  • Fishbane S (1999) Review of issues relating to iron and infection. Am J Kidney Dis 34: S47-52. [crossref]
  • Weinberg ED (1984) Iron withholding: a defense against infection and neoplasia. Physiol Rev 64: 65-102. [crossref]
  • Armitage AE, Eddowes LA, Gileadi U, Cole S, Spottiswoode N, et al. (2011) Hepcidin regulation by innate immune and infectious stimuli. Blood 118: 4129-4139. [crossref]
  • Boelaert JR, Vandecasteele SJ, Appelberg R, Gordeuk VR (2007) The effect of the host’s iron status on tuberculosis. J Infect Dis 195: 1745-1753. [crossref]
  • McDermid JM, Jaye A, Schim van der Loeff MF, Todd J, Bates C, Austin S, et al. (2007) Elevated iron status strongly predicts mortality in West African adults with HIV infection. J Acquir Immune Defic Syndr 46:498-507.
  • Brewster UC, Perazella MA (2004) Intravenous iron and the risk of infection in end-stage renal disease patients. Semin Dial 17: 57-60. [crossref]
  • Cieri E (1999) Does iron cause bacterial infections in patients with end stage renal disease? ANNA J 26: 591-596. [crossref]
  • Rivera S, Nemeth E, Gabayan V, Lopez MA, Farshidi D, Ganz T (2005) Synthetic hepcidin causes rapid dose-dependent hypoferremia and is concentratedin ferroportin-containing organs. Blood 106:2196-2199.
  • Ishida JH, Johansen KL (2014) Iron and infection in hemodialysis patients. Semin Dial 27: 26-36. [crossref]
  • Gupta A, Zhuo J, Zha J, Reddy S, Olp J, Pai A (2010) Effect of different intravenous iron preparations on lymphocyte intracellular reactive oxygen species generation and subpopulation survival. BMC Nephrol 11:16.
  • Brewster UC (2006) Intravenous iron therapy in end-stage renal disease. Semin Dial 19: 285-290. [crossref]
  • Deicher R, Ziai F, Cohen G, Müllner M, Hörl WH (2003) High dose parenteral iron sucrose depresses neutrophil intracellular killing capacity. Kidney Int 64:728-736.
  • van Asbeck BS, Marx JJ, Struyvenberg A, Verhoef J (1984) Functional defects in phagocytic cells from patients with iron overload. J Infect 8: 232-240. [crossref]
  • Ichii H, Masuda Y, Hassanzadeh T, Saffarian M, Gollapudi S, Vaziri ND (2012) Iron sucrose impairs phagocytic function and promotes apoptosis in polymorphonuclear leukocytes. Am J Nephrol 36: 50-57.
  • Kliger AS, Foley RN, Goldfarb DS, Goldstein SL, Johansen K, et al. (2013) KDOQI US commentary on the 2012 KDIGO Clinical Practice Guideline for Anemia in CKD. Am J Kidney Dis 62: 849-859. [crossref]
  • Shah A, Roy NB2, McKechnie S3, Doree C4, Fisher SA4, et al. (2016) Iron supplementation to treat anaemia in adult critical care patients: a systematic review and meta-analysis. Crit Care 20: 306. [crossref]
  • Feldman HI, Santanna J, Guo W, Furst H, Franklin E, et al. (2002) Iron administration and clinical outcomes in hemodialysis patients. J Am Soc Nephrol 13: 734-744. [crossref]
  • Freburger JK, Ellis AR, Kshirsagar AV, Wang L, Brookhart MA (2014) Comparative short-term safety of bolus versus maintenance iron dosing in hemodialysis patients: a replication study. BMC Nephrol 15:154.
  • Agarwal R, Kusek JW, Pappas MK (2015) A randomized trial of intravenous and oral iron in chronic kidney disease. Kidney Int 88: 905-914. [crossref]
  • Brookhart MA, Freburger JK, Ellis AR, Wang L, Winkelmayer WC, et al. (2013) Infection risk with bolus versus maintenance iron supplementation in hemodialysis patients. J Am Soc Nephrol 24: 1151-1158. [crossref]
  • Bailie GR, Larkina M, Goodkin DA, Li Y, Pisoni RL, Bieber B, et al. (2015) Data from the Dialysis Outcomes and Practice Patterns Study validate an association between high intravenous iron doses and mortality. Kidney Int 87: 162-168.
  • Litton E, Xiao J, Ho KM (2013) Safety and efficacy of intravenous iron therapy in reducing requirement for allogeneic blood transfusion: systematic review and meta-analysis of randomized clinical trials. BMJ 347: f4822.
  • Hoen B, Paul-Dauphin A, Hestin D, Kessler M (2002) Intravenous iron administration does not significantly increase the risk of bacteriemia in chronic hemodialysis patients. Clin Nephrol 57:457-461.
  • Bansal A, Sandhu G, Gupta I, Kalahalli S, Nayak R, Zouain E, et al. (2014) Effect of aggressively driven intravenous iron therapy on infectious complications in end-stage renal disease patients on maintenance hemodialysis. Am J Ther 21:250-253.
  • Miskulin DC, Tangri N, Bandeen-Roche K, Zhou J, McDermott A, et al. (2014) Intravenous iron exposure and mortality in patients on hemodialysis. Clin J Am Soc Nephrol 9: 1930-1939. [crossref]
  • Ishida JH, Marafino BJ, McCulloch CE, Dalrymple LS, Dudley RA, et al. (2015) Receipt of Intravenous Iron and Clinical Outcomes among Hemodialysis Patients Hospitalized for Infection. Clin J Am Soc Nephrol 10: 1799-1805. [crossref]
  • Feldman HI, Joffe M, Robinson B, Knauss J, Cizman B, et al. (2004) Administration of parenteral iron and mortality among hemodialysis patients. J Am Soc Nephrol 15: 1623-1632. [crossref]
  • Hoen B, Paul-Dauphin A, Hestin D, Kessler M (1998) EPIBACDIAL: a multicenter prospective study of risk factors for bacteremia in chronic hemodialysis patients. J Am Soc Nephrol 9: 869-876. [crossref]
  • Anker SD, Comin Colet J, Filippatos G, Willenheimer R, Dickstein K, et al. (2009) Ferric carboxymaltose in patients with heart failure and iron deficiency. N Engl J Med 361: 2436-2448. [crossref]

Platinum Plus Gemcitabine as the Most Effective Regimen in the First Line of Chemotherapy in Advanced Squamous Cell Lung Cancer

Abstract

Purpose: Platinum-based doublet chemotherapy had been the standard first-line treatment for advanced NSCLC, regardless of histologic subtypes. We report overall survival (OS) and time to treatment failure (TTF) in patients with squamous cell lung cancer (SCC) receiving doublet of platinum.

Patients and Methods: Patients (N = 82) with advanced NSCLC received doublet of platinum. Sixty five (79,2%) patients were treated with a combination of platinum plus gemcitabine and 17 (20,7%) received microtubules inhibitor (3 patients were treated with vinorelbine, 3 patients with docetaxel and 11 patients with paclitaxel).

Results: Median TTF was 2,53 months CI95% [2,21 – 2,84] and median OS was 8,246 months CI95% [5,8 –2,6]. Regarding doublet of chemotherapy, in patients in which gemcitabine was used there was an improvement in TTF of 1,2 months (p= 0,107; log rank) and 4,75 months in OS (p= 0,018; log rank).

Conclusion: Gemcitabine plus platinum must be the chemotherapy of ghoice in advanced SCC. Randomized clinical trials with gemcitabine in advanced SCC are needed.

Keywords

squamous cell lung cancer, chemotherapy, gemcitabine

Introduction

Primary lung cancer is the most common malignancy and the first death related causes from cancer in the worldwide. Nowadays, it is the most important cause of cancer mortality in men and women. Lung cancer is still increasing both in incidence and mortality worldwide. In Spain, more than 21,000 men were diagnosed of lung cancer in 2012, while over 17,000 died. Lung cancer is the leading cause of dead among Spanish men. Figures in women were near 5,000 and more than 3,500 respectively. Women got into the habit of smoking some decades later than men in Spain [1]. Non-small-cell lung cancers (NSCLC) account for 85%–90% of lung cancers. NCSLC includes several histologic subtypes such as adenocarcinoma, squamous cell carcinoma (SCC), and large cell carcinoma. Platinum-based doublet chemotherapy had been the standard first-line treatment for advanced NSCLC, regardless of histologic subtypes [2].

New agents has been developed recently (anti folate, anti VEGF, antiEGFR, etc) [3]. These agents play a crucial role in first-line systemic therapy for nonsquamous histology while they do not have activity in SCC.

On the other hand, several regimens of platinum-based doublet chemotherapy are currently the standard first-line therapy for advanced lung SCC, including platinum combined with gemcitabine, docetaxel, paclitaxel, or vinorelbine and these scheludes have similar effectiveness [4].

There are not any phase III studies focused on determining what is the most active platinum-based chemotherapy regimen to treat advanced lung SCC. This study examined the comparative effectiveness of various platinum-based regimens as first-line therapy for advanced lung SCC.

Material and Methods

Patients

This is a retrospective study. The study population included patients with newly diagnosed lung SCC from 2012 to 2014 in the University General Hospital of Ciudad Real (Spain). The following inclusion criteria were used to identify eligible patients: (1) pathologically proven initial diagnosis of lung SCC as the single primary cancer; (2) age ≥ 18 years; and (3) advanced disease stage at diagnosis, which was defined as stage IIIB or stage IV disease according to the American Joint Committee on Cancer, 7th edition.5 Patients who underwent surgery during the first course of treatment and those who underwent radiotherapy with curative intent (which was defined as a cumulative dose > 50 Gy) were excluded.

All patients received chemotherapy for advanced lung SCC. Main regimens considered in our study including cisplatin (P), carboplatin (CP), gemcitabine (G), docetaxel (D), paclitaxel (T), or vinorelbine (V). Platinum agent was considered and patients were classified into patients who received cisplatin or carboplatin.

Objective

The main objective was overall survival (OS). OS was determined according to the date of diagnosis of advanced lung SCC to the date of death.

Statistical analysis

Baseline demographic and clinical variables were summarized with descriptive statistics. Regard chemotherapy, G were recoded as antimetabolite and D, T, V as microtubules inhihitor (MI).

The OS was estimated using the Kaplan-Meier method, and the differences between the study groups were compared using the log-rank test. The Cox proportional hazard model was used to estimate the univariate or adjusted hazard ratios and associated 95% confidence intervals for detecting differences in the effects of treatments on overall mortality. The sex, age, brain metastases and type of platinum were adjusted in the Cox proportional hazard model. Subgroup analyses defined according to sex, age (< 70 or ≥ 70 years) and platinum were performed as sensitivity analyses to determine whether the differences in effects on mortality of platinum + antimetabolite compared with those of P + MI. Two-sided P values of ≤ .05 were considered statistically significant. All analyses were performed by SPSS for windows v. 18.

Results

Baseline characteristics

Eighty two patients were included in this study. Among them, 79 (96.3%) were men, 41 (50%) were aged ≥ 70 years, and 2 (2,7%) had brain metastases (Table 1). Sixty five (79,2%) patients were treated with a combination of platinum plus gemcitabine and 17 (20,7%) received microtubules inhibitor (3 patients were treated with vinorelbine, 3 patients with docetaxel and 11 patients with paclitaxel). Patients aged < 70 years were more likely to receive chemotherapy with microtubules inhibitors than older patients (70,6% vs. 44,6%, P = 0.057). Up to December the 31th, 2014, 66 patients (80,5%) were with progression disease, 68 (82,2%) had died and 45 patients (54,9%) were controlled by the Palliative Care Unit. The median follow-up time was 6 months (table 1).

Table 1. Baseline characteristics of patients with advanced lung squamous cell carcinoma in our series


Baseline Characteristics

Gemcitabine


Microtubule inhibitor


All p
N (%) 65 (79,2%) 17 (20,7%) 82 (100%)
Age (median, range) 71 (44-88) 64 (40-81) 70 (40-84) 0,118
Years (n, %)

<70 años

>70 años


29 (44,6)

36 (55,4)


12 (70,6)

5 (29,4)


41 (50,0)

41 (50,0)


0,057

Gender (n, %)

Male

Female


63 (96,9)

2 (3,1)


16 (94,1)

1 (5,9)


79 (96,3)

3 (3,7)


0,583

Brain Metastases (n, %)

No

Yes


63 (96,9)

2 (3,1)


17 (100,0)

0 (0,0)


80 (97,6)

2 (2,4)


0,464

Platinium (n,%)

Cisplatin

Carboplatin


21 (32,3)

44 (67,7)


3 (17,6)

14 (82,4)


24 (29,3)

58 (70,7)

0,237
Progression first line (n, %)

No

Yes


11 (16,9)

54 (83,1)


5 (29,4)

12 (70,6)


16 (19,5)

66 (80,5)

0,247
Second line  (n, %)

Taxanes

Gemcitabine

TKI

27 (41,5)

21 (77,7)

0 (0,0)

6 (22,2)

  4 (23,5)

2 (50,0)

1 (25,0)

1 (25,0)

31 (37,8)

23 (74,19)

1 (3,3)

7 (22,5)

0,173
Control by Palliative Care Unit (n, %)

No

Yes


29 (44,6)

36 (55,4)


8 (47,1)

9 (52,9)


37 (45,1)

45 (54,9)

0,857
Estatus

Alive

Exitus


12 (18,5)

53 (81,5)


2 (11,8)

12 (88,2)


14 (17,1)

68 (82,9)

0,514

In patients, the main causes of death were progression disease in 59 patients (86,7%), pulmonary embolism in 2 patients (2,9%), stroke in 1 patient (1,47%), chronic obstructive pulmonary disease in 3 patients (4,4%), myocardial infarction in 1 patient (1,47%), hemoptysis in 1 patient (1,47%) and chemotherapy related toxicity in 1 patient (1,47%) (Figure 1).

Figure 1. main causes of death of patients

Figure 1. main causes of death of patients

Time to treatment failure

Median TTF was 2,53 months CI95% [2,21 – 2,84] (Figure 2). Considering age, sex, brain metastases, platinum compound and doublet of chemotherapy, we did not find differences (Table 2). Regarding doublet of chemotherapy, in patients in which gemcitabine was used there was an improvement in TTF of 1.2 months (p= 0.107, log rank) (Figure 3).

Figure 2. Median time to treatment failure in all patients

Fig 2.Median time to treatment failure in all patients

Figure 3. Time to treatment failure regarding doublet of chemotherapy.

Fig3.Time to treatment failure regarding doublet of chemotherapy.

Table 2. Medians and hazard ratios of time to treatment failure regarding age, sex, brain metastases, platinum compound and doublet of chemotherapy

  Median months, IC95%


P, log rank Hazard ratio, IC95% P, cox
Age

<70 años

>70 años


2,9 [2,07-3,9]

2,3 [2,1-2,5]


0,264


0,757 [0,46-1,24]


0,269

Sex

Male

Female


2,5 [2,2-2,8]

1,9 [0,0-5,04]


0,714


0,806 [0,25-2,6]


0,718

Brain Metastases (n, %)

No

Yes


2,5 [2,1-2,8]

2,3 [n.r.]


0,771


0,747 [0,1-5,5]


0,774

Platinum (n,%)

Cisplatin

Carboplatin


2,3 [2,01-2,7]

2,6 [1,9- 3,2]


0,895


1,037 [0,6-1,7]


0,896

Doublet of CT (n, %)

Microtubules inhibitor

Gemcitabine


1,7 [0,0-4,3]

2,5 [2,2- 2,8]


0,107


1,677 [0,8-3,1]


0,115

Overall survival

Median OS was 8,246 months CI95% [5,8 –2,6] in all patients (Figure 4). Overall survival rate al 6, 12 and 18 months were 62,8%, 35,1% and 3,8% respectively. Considering age, sex, brain metastases, platinum compound and doublet of chemotherapy there were statistically significant differences regard sex and doublet of CT (Table 3).

Figure 4. Overall survival in all patients

Fig 4. Overall survival in all patients

Table 3. Medians and hazard ratios of time to treatment failure regarding age, sex, brain metastases, platinium compound and doublet of chemotherapy

  Median months, IC95%


P, log rank Hazard ratio, IC95% P, cox
Age

<70 años

>70 años


7,5 [4,6-10,5]

8,9 [6,4-11,3]


0,619


0,884 [0,54-1,43]


0,619

Sex

Male

Female


8,3 [6,2-10,5]

3,2 [2,4-4,1]


0,006


0,217 [0,06-0,719]


0,012

Brain Metastases (n, %)

No

Yes


8,2 [5,8-10,6]

4,3 [n.r.]


0,596


1,466 [0,35-6,1]


0,599

Platinium (n,%)

Cisplatin

Carboplatin


10,48 [3,9-17,02]

7,65 [4,9- 10,33]


0,260


0,764 [0,42-1,2]


0,263

Doublet of CT (n, %)

Microtubules inhibitor

Gemcitabine


5,7 [3,8-7,6]

9,45 [6,7- 12,1]


0,018


1,989 [1,1-3,5]


0,021

In multivariate analyses adjusted for sex, age (< 70 or ≥ 70 years) and platinium the first line chemotherapy regimen based in antimetabolites was a predictor of OS (p=0.018).

Second line

Only 31 (37,8%) patients received second line therapy of treatment. Most common agents were docetaxel (17 patients, 54,8%), paclitaxel (6 patients, 19,9%), erlotinib (6 patients, 19,4%), gefitinib (1 patient, 3,2%) and gemcitabine (1 patient, 3,2%).

Median OS posprogression (OSpp) was 6,637 months CI95% [5,4 –7,8]. With respect to type of treatment, patients treated with docetaxel had a median of 9,01 months CI95% [5,1 –12,9], patients treated with paclitaxel 6,6 months CI95% [0,5 –12,7] and patients treated with erlotinib 5,8 months CI95% [4,6 –7,1]. Patient treated with gefitinib and gemcitabina were alive while 5,4 months and 3,2 months respectively. There were statistically significant differences in median OSpp regarding type of treatment (p=0,026 log rank). Hazard ratio for use of taxanes was 0,695, CI95% [0,26 –1,83], p=0,4.

Discussion

Squamous cell NSCLC is a particularly aggressive type of lung cancer, and few treatments are effective [6]. The NCCN and ESMO frontline recommendations include chemotherapy doublets, which are considered the cornerstone of initial therapy for squamous NSCLC [7,8]. To our knowledge, no prospective clinical trial has specifically compared cytotoxic chemotherapies for advanced lung SCC so there is is uncertainty about the best option of treatment.

Respect gender, women is represented in 3,7% in our study. In most published studies, little is reported about women diagnosed of advanced squamous NCSLC treated with CT. Overall survival among women in our study is poor (3,2 months versus 8,3). Recently, it has been described that females patients with squamous NCSLC had a significantly higher rate of human papillomavirus (HPV) infection compared to males with SCC [9] and HPV infection appears to be involved in cancer progression in SCC by promoting the expression of p53. On the other hand, patterns of mutation in SCC are unknown being KRAS, FGFR1 and PIK3CA most frequently reported and women seem to have less PIK3CA mutation than men. Moreover, there may exist unknown endocrine mechanisms this particularly lack of response and bad prognosis in women. To our knowledge, there are no differences in smoking patters that could explain this fact [10].

Elderly and young patients, defined by >70 years or <70 years, have similar proportion in our series. Although doublets with microtubule inhibitors are less used in old patients overall survival is similar in both groups. The definition of elderly patients varies widely across trials and and an uniform definition is lacking. Particularly in the actual world setting, older patients are often untreated even even when free of comorbid illnesses. Most studies in advanced NSCLC define elderly patients as those older than 70 years for the treatment of advanced NSCLC [11] and the benefit of platinum-based doublet regimens in this population seems to be greater than single-agent chemotherapy. So avoiding the use of doublets in elderly  is not justified in absence of comorbid status. Studies in elderly patients show similar response rates than in younger ones even with aggressive regimens of chemotherapy.

Palliative Care Unit (PCU) has played a preeminent role in the management of patients. More than half of our patients were remitted to PCU (45 patients, 54,9%) This fact allowed better control of symptoms, especially at home, and ultimately improved patients’ quality of life [12]. Early integration of palliative care into the treatment strategy should be mandatory because it may improve quality of life, particularly end-of-life care and improve overall survival. Our institution is working to make success this target.

Median time to treatment failure was 2,53 months and overall survival 8,24 months. The use of cisplatin or carboplatin has no impact on TTF or on OS, although use of cisplatin has a tendency to improve overall survival in 3 months over the use of carboplatin. Our data are similar to the reported about Veterans Health Administration data [12]. The use of gemcitabine as platinum doublet has demonstrated increased survival in our patients over microtubule inhibitors (9,45 months versus 4,7 months). A phase III trial of cisplatin and pemetrexed compared with cisplatin and gemcitabine revealed a statistically significant improvement in OS with cisplatin and gemcitabine in patients with squamous cell histology (10.8 vs 9.4 months) [13,14]. A retrospective study in patients with advanced lung SCC, revealed the use of various regimens did not have a significant effect on survival outcomes [15].

Finally, 31 patients (37,8%) received second line of treatment being docetaxel the most common agent used in this setting followed by paclitaxel and erlotinib. Although the number of patients is small, there is an improvement in survival in the group treated with taxanes respect to the group treated with tyrosine kinase inhibitor TKI). In TITAN phase III study, [16] patients were randomized to receive TKI or CT (taxanes or pemetrexed) and both treatments were similar in efficacy with different toxicity profiles.

We conclude that gemcitabine must be the CT of choice in advanced SCC. On the other hand, female patients had worse prognosis, patients aged >70 years old must receive a double of platinum, cisplatin is similar to carboplatin and cisplatin must be used when there is no contraindication for its use. Aditional agents and strategies must be developed in this setting to improve quality of life and survival.

References

  • Ferlay J, Steliarova-Foucher E, Lortet-Tieulent J, Rosso S, Coebergh JW, et al. (2013) Cancer incidence and mortality patterns in Europe: estimates for 40 countries in 2012. Eur J Cancer 49: 1374-1403. [crossref]
  • Le Chevalier T, Scagliotti G, Natale R, Danson S, Rosell R, et al. (2005) Efficacy of gemcitabine plus platinum chemotherapy compared with other platinum containing regimens in advanced non-small-cell lung cancer: a meta-analysis of survival outcomes. Lung Cancer 47: 69-80.
  • Reck M, Popat S, Reinmuth N, De Ruysscher D, Kerr KM, et al. (2014) Metastatic non-small-cell lung cancer (NSCLC): ESMO Clinical Practice Guidelines for diagnosis, treatment and follow-up. Ann Oncol 25 Suppl 3: iii27-39. [crossref]
  • Schiller JH, Harrington D, Belani CP, et al. (2002) Comparison of four chemotherapy regimens for advanced non small-cell lung cancer. N Engl J Med 346: 92-8.
  • Edge SB, Compton CC (2010) The American Joint Committee on Cancer: the 7th edition of the AJCC cancer staging manual and the future of TNM. Ann Surg Oncol 17: 1471-1474. [crossref]
  • McKeage MJ, Jameson MB, et al. (2010) Comparative outcomes of squamous and non-squamous non-small cell lung cancer (NSCLC) patients in phase II studies of ASA404 (DMXAA): retrospective analysis of pooled data. J Thorac Dis 2:199-204.
  • Ettinger DS, Wood DE, Akerley W, Bazhenova LA, Borghaei H, et al. (2014) Non-small cell lung cancer, version 1.2015. J Natl Compr Canc Netw 12: 1738-1761. [crossref]
  • Reck M, Popat S, Reinmuth N, De Ruysscher D, Kerr KM, Peters S (2014) ESMO Guidelines Working Group. Metastatic non-small-cell lung cancer (NSCLC): ESMO Clinical Practice Guidelines for diagnosis, treatment and follow-up. Ann Oncol 25 Suppl 3: iii27-39.
  • Fan X, Yu K, Wu J, Shao J, Zhu L, et al. (2015) Correlation between squamous cell carcinoma of the lung and human papillomavirus infection and the relationship to expression of p53 and p16. Tumour Biol 36: 3043-3049. [crossref]
  • Qiong Z, Na WY, Bo W2, Zhu Z, Ling P, et al. (2015) Alterations of a spectrum of driver genes in female Chinese patients with advanced or metastatic squamous cell carcinoma of the lung. Lung Cancer 87: 117-121. [crossref]
  • Owonikoko TK, Ramalingam SS2 (2015) Minimize toxicity or preserve efficacy? A delicate trade-off in the management of older patients with lung cancer. J Clin Oncol 33: 534-536. [crossref]
  • Wagner B, Meffert C2, Becker G2 (2015) [Availability and integration of palliative medicine at certified lung cancer centers]. Pneumologie 69: 218-224. [crossref]
  • Santana-Davila R, Szabo A, Arce-Lara C, Williams CD, et al. (2014) Cisplatin versus carboplatin-based regimens for the treatment of patients with metastatic lung cancer. An analysis of Veterans Health Administration data. J Thorac Oncol 9: 702-9.
  • Scagliotti GV, Parikh P, von Pawel J, et al. (2008) Phase III study comparing cisplatin plus gemcitabine with cisplatin plus pemetrexed in chemotherapy-naive patients with advanced-stage non-small-cell lung cancer. J Clin Oncol 26:3543-3551.
  • Liao BC, Shao YY, Chen HM, Shau WY, Lin ZZ, et al. (2015) Comparative effectiveness of first-line platinum-based chemotherapy regimens for advanced lung squamous cell carcinoma. Clin Lung Cancer 16: 137-143. [crossref]
  • Ciuleanu T, Stelmakh L, Cicenas S (2012) Efficacy and safety of erlotinib versus chemotherapy in second-line treatment of patients with advanced, non-small-cell lung cancer with poor prognosis (TITAN): a randomised multicentre, open-label, phase 3 study. Lancet Oncol 13:300-8.

Humanized Monoclonal Antibodies in Pulmonology: An Integrated Review

Abstract

Asthma is an important chronic disease affecting a lot of people worldwide. Treatment options for asthma like biological agents are being developed more frequently nowadays. Despite a lot of treatment options, some patients still remain symptomatic. As more and more practitioners choose treatment with biologic agents as a convenient way of therapy, biologic agents and other valuable methods must be discovered in order to cope with a growing number of treatment agents. This manuscript emphasizes on new generation monoclonal human (ized) antibodies in asthmatics and off-label use. The first developed biologic agent is the anti- immunoglobulin E monoclonal antibody called omalizumab. Currently it is an approved treatment option for asthma.

Introduction

Asthma is an important chronic disease affecting a lot of people worldwide [1]. Treatment options for asthma like biological agents are being developed more frequently nowadays. Despite a lot of treatment options, some patients still remain symptomatic. As more and more practitioners choose treatment with biologic agents as a convenient way of therapy, biologic agents and other valuable methods must be discovered in order to cope with a growing number of treatment agents. This special issue emphasizes on new generation monoclonal human (ized) antibodies in asthmatics [2-4].

The pathophysiological mechanisms underlying asthma, which is a heterogeneous disease, are characterized by interactive responses among various cell types and the hematopoietic cells of the adaptive and innate immune systems. Frequently is conventional therapy like inhaled steroids and beta-agonists sufficient for asthma symptoms. However, a little minority of the asthmatics is not controlled with conventional therapy. Therefore, are new treatment options essential for severe asthmatic patients [5].

Anti-IL-5 Molecules

Interleukins derived from T-helper-2 (Th2) cells and innate lymphoid cells play an important role in the pathogenesis of asthma. Monoclonal antibodies targeting these cytokines as treatment for severe asthma are expected to be beneficial [6]. Eosinophilic inflammation is an important event in the pathogenesis of asthma. IL-5 is a key cytokine that arranges eosinophil production, survival, maturation and recruitment of eosinophils to the inflammation [7]. Mepolizumab, reslizumab, and benralizumab are new developed monoclonal antibodies that target the cytokine IL-5. Mepolizumab and reslizumab have been approved by the US Food and Drug Administration (FDA) for the treatment of patients with severe asthma with an eosinophilic phenotype [8,9]. Mepolizumab and reslizumab binds directly to IL-5 ligand. These molecules effectively decreased circulating and sputum eosinophil counts, but they failed to improve airway mucosal eosinophilia, acute exacerbation rates, lung function and symptom scores in several studies. These disappointing results may be affected from inappropriate selection of the patients. In order to overcome the probable mechanistic limitations of early anti-IL-5 agents, an anti-IL5R monoclonal antibody was developed and called as benralizumab. Benralizumab, previously known as MEDI-563, is a humanized recombinant IgG1-k isotype monoclonal antibody. It was constructed from the mouse anti-human IL-5Rα mAbs generated by mice immunized with recombinant human IL- 5Rα [10]. Clinical studies revealed that anti-interleukin 5 monoclonal therapies for asthma could be safe for slightly improving FEV1 (or FEV1% of predicted value), quality of life, and reducing exacerbations risk and blood and sputum eosinophils. However these drugs have no significant effect on PEF, and SABA rescue use. These may be a result of patient selection. Further trials are required to clarify the optimal antibody for different patients [7].

Anti-IL-4/IL-13 Molecules

Another investigated cytokine important in the inflammatory pathways in the pathogenesis of asthma is anti-IL-4. IL-4 is a pleiotropic cytokine secreted mainly by activated T cells. Mast cells, basophils, and eosinophils can also secret IL-4 [10,11]. IL-4 is important in inducing IgE isotype switching, T cell polarization into Th2 cells, and generation of IL-4, IL-5, and IL-13 by Th2 cells. IL-4Rα is expressed on CD4+ and CD8+ T cells, B cells, macrophages, lung epithelial cells, airway goblet cells, and smooth muscle cells [11]. There is a functional homogeniety between IL-4 and IL-13. IL-4 can activate a heterodimeric receptor complex consisting of the IL-4 receptor α- subunit (IL-4Rα) and a γC subunit. IL-13 can activate the IL-4Rα and the IL-13 receptor α1-subunit (IL-13Rα1) [5]. Both IL-4 and IL-13 can bind to heterodimeric combination of the α-subunit of the IL-13 receptor and the α-subunit of the IL-4 receptor. And this leads to signaling of both IL-4 and IL-13. Therefore, will blocking IL-4R α with an antibody of this receptor chain expected to block the effects of both IL-4 and IL-13 [6].

Pascolizumab and VAK694 are anti-IL-4 neutralizing monoclonal antibodies. Also, IL-4 receptor antagonist drugs like dupilumab, pitrakinra and AMG-317 have been discovered. Even a recombinant IL-4Rα that captures soluble IL-4 and prevents their binding to IL-4 receptors, has been developed. It is called altrakincept. However, further research on this drug was discontinued by its manufacturer, since the phase 3 clinical trial failed to confirm its earlier promising results. Since there is a high redundancy of IL-4 and IL-13 signaling, blocking of both IL-4 and IL-13 has been expected to be more efficient [11]. Dupilumab is a drug that inhibits signaling from IL- 4 and IL-13 concomitantly. It is a molecule that binds to the alpha subunit of the IL-4 receptor. Phase II trials for dupilumab showed that asthma exacerbations were decreased in patients using this drug [12,13]. Dupilumab also improved lung function. It reduced the inhaled corticosteroid dose in the patient group. There was also an associated reduction in fractional exhaled nitric oxide with reduced serum concentrations of Th2-associated inflammatory markers such as CCL17 (TARC), CCL26 (eotaxin-3), and IgE [6]. These results are promising and further clinical trials will us show us the long-term efficacy of dupilumab [11].

Another similar drug that targets IL-4 is pitrakinra. It is a recombinant human IL-4 variant that competitively inhibits IL-4Ra to interfere with the actions of both IL-4 and IL-13. Studies on this competitive antagonist called pitrakinra revealed that it leads to significant reduction in asthma exacerbations and improves asthma symptoms in patients with eosinophilia [14]. Pitrakinra also attenuated the late-phase asthmatic response to allergen challenge in patients with mild atopic asthma [6]. The other drug called AMG317 was evaluated in another phase II trial in approximately 300 patients with moderate to severe asthma. Weekly injections over 12 weeks were well tolerated but did not have significant effects on the Asthma Control Questionnaire score (ACQ score; the primary outcome) [14].

Interleukin 13 shares 30% homology with interleukin 4. IL-13 is secreted by Th2 cells, ILC2s, mast cells, basophils, and eosinophils. IL-13 has the potential to increase goblet-cell differentiation, and activation of fibroblasts. IL-13 production can induce an increase in bronchial hyperresponsiveness, and switching of B-cell antibody production towards IgE [6]. IL-13 is similar to IL-4 and uses the same signaling pathways. The high-affinity receptor of IL-13 is a heterodimer of IL-4Rα/IL- 13Rα1. IL-13Rα1 is present on eosinophils, B cells, monocytes, macrophages, smooth muscle cells, lung epithelial cells, airway goblet cells, and endothelial cells. Biologicals that target IL-13 are anti-IL-13 mAbs: anrukinzumab, dectrekumab, GSK679586, IMA-026, lebrikizumab, RPC-4046, and tralokinumab [11].

Patients with severe asthma often have elevated levels in sputum despite therapy with high dose inhaled or oral corticosteroids. Lebrikizumab is one of the many humanized monoclonal antibodies that have been developed to specifically bind to IL-13 and inhibit its function [14]. In a randomized, double-blind, placebo- controlled study were 219 asthma patients observed and evaluated whether the drug lebrikizumab could alter the course of asthma. Lebrikizumab treatment was associated with improved lung function. Patients with high pretreatment levels of serum periostin had greater improvement in lung function with lebrikizumab. This therapy needs futher evaluation before being utilized in clinics [15]. Another monoclonal antibody called tralokinumab, an investigational human IL-13-neutralising immunoglobulin G4 monoclonal antibody, has been evaluated in adults with moderate to severe uncontrolled asthma despite controller therapies. Patients were randomly assigned to receive tralokinumab or placebo subcutaneously every 2 weeks for 13 weeks. Although it had an acceptable safety and tolerability, it did not reduce asthma exacerbations [16].

Antithymic stromal lymphopoietin

Thymic stromal lymphopoietin (TSLP) is an epithelial cell derived cytokine that may trigger allergic inflammation and, thus, play a role in allergic asthma [17]. It is an epithelial-derived cytokine and makes its effect through its receptor, TSLP-R, which is a heterodimeric receptor that consists of the IL-7 receptor alpha chain (IL-7Rα) and the TSLP receptor alpha chain 1 (TSLPRα). In hematopoietic cells, TSLP-R is mainly expressed in DCs, monocytes, B cells, T cells, NK cells, invariant natural killer T (iNKT) cells, eosinophils, basophils, and mast cells [11].

A human anti TSLP monoclonal immunoglobulin G2 lambda (AMG 157) that binds human TSLP and prevents receptor interaction was assessed in a trial. Randomly assigned 31 patients with mild allergic asthma received AMG 157 (700 mg) or placebo intravenously, once a month for three doses. The primary outcome, the maximum percentage decrease in the FEV during the late asthmatic response was 45.9 percent less in the AMG 157 group than the placebo group on day 84. AMG 157 reduced allergen induced bronchoconstriction and airway inflammation. No serious adverse effects were reported. Further studies on this drug are planned to clarify its use in clinical practice [17].

Anti-IL-9 Monoclonal Antibody

IL-9 is a Th2 cytokine and a T cell and mast cell growth factor. Anti-IL-9 antibody-treatment has been shown to protect from allergen-induced airway remodeling, with a concomitant reduction in mature mast cell numbers and activation. It can also decrease expression of the profibrotic mediators transforming growth factor (TGF)-b1, vascular endothelial growth factor (EGF), and fibroblast growth factor-2 (FGF-2) in the lung. The function of IL-9 in allergy has been investigated for its pleiotropic activities on cell types associated with allergic diseases including Th2 lymphocytes, mast cells, B cells, eosinophils, and airway epithelial cells. An anti-IL-9 monoclonal antibody (MEDI-528) has been studied in a clinical trial on 327 asthmatic subjects. Patients were randomized to receive placebo or one of three doses of MEDI-528 (dosage 30, 100, or 300 mg s.c. twice weekly for 4 weeks) in addition to their usual asthma medications. The addition of MEDI-528 to existing asthma controller medications did not improve ACQ-6 scores, asthma exacerbation rates, or FEV1 values. Further clinical trials are needed to explore this drug for altering the course of asthma. Thus, the potential clinical benefit of targeting IL-9 or its receptor in the treatment of asthma remains to be shown in further studies [5].

Anti-IL-2 antibody

Allergen exposure can stimulate IL-2 and its receptor expression (IL -2R) a chain (sCD25) in airways of patients with severe asthma. Daclizumab is a humanized monoclonal antibody that binds specifically to a subunit (CD25) of the high-affinity IL-2R, and inhibits IL-2 binding and its biological activity. Daclizumab can inhibit various T cell functions, including T cell proliferation and cytokine production. It has been investigated in a randomized controlled study. The drug has the potential to improve pulmonary function and asthma control in patients moderate to severe chronic asthma [18]. The risk of immunosuppression in clinical practice needs to be clarified.

Anti-GATA3-spesific DNAzyme

Approximately half of the asthmatic patients exhibit a Th2 type in response to allergen exposure. This Th2 endotype is characterized by a predominant activation of Th2 cells that produce cytokines such as interleukins 4, 5, and 13. The expression and production of all these Th2 cytokines have been shown to be controlled by the zinc finger transcription factor GATA3, which is essential for Th2-cell differentiation and activation. It is considered to be the master transcription factor of the Th2 pathway of immune activation. Therefore, could be interventions to disrupt this immune network, a synthetic DNA molecule (DNAzyme), that binds to GATA3 messenger RNA and cleaves it, a solution. This synthetic molecule called SB010 could significantly attenuate both late and early asthmatic responses after allergen provocation in patients with allergic asthma. Biomarker analysis after this drug showed an attenuation of Th2-regulated inflammatory responses [19].

Anti-IL-17 antibody

Although half of the asthma patients exhibit a Th2 type endotype, some remaining patients exhibit a Th17 driven endotype. This subpopulation is characterized with a Th17 driven inflammation. Th17 cells can contribute to airway hyperresponsiveness by recruiting both eosinophils and neutrophils. Therefore, has been IL-17 receptor blocking suggested to beneficial in asthma treatment [20]. Biologicals targeting IL-17 include an anti-IL-17A mAb: secukinumab and an anti-IL- 17 receptor mAb: brodalumab. Although the inhibition of IL-17 receptor A had no effect on subjects with asthma as a whole, a subgroup analysis showed an effect with uncertain significance. Further studies are needed to determine the role of secukinumab in asthma [11]. Brodalumab (AMG 827) is a human, anti–IL-17RA immunoglobulin G2 (IgG2) monoclonal antibody that binds with high affinity to human IL-17RA, blocking the biologic activity of IL- 17A, -17F, -17A/F heterodimer, and -17E (IL-25). Brodalumab can block IL-25 activity and IL-17A and IL-17F. In a randomized controlled study were 302 patients taking this drug evaluated and at the end of the study there was no evidence for an effect of brodalumab in these patients. Further studies may clarify the potential of this drug [20].

Anti TNF antibodies

In addition, human(ized) monoclonal antibodies (HMA) evaluated for the treatment of severe persistent asthma (SPA), but not approved after Phase II trial are as follows; Infliximab (Recombinant human–murine chimeric anti-TNFα monoclonal antibody Infliximab), etanercept (Soluble TNFα receptor fusion protein), and golimumab (Fully human TNFα-blocking antibody) [5]. The expression of TNF alfa is increased in asthma in association with airway neutrophilia. Berry and colleagues have demonstrated that the TNF-α axis is upregulated in patients with refractory asthma, as evidenced by the increased expression of membrane-bound TNF-α, TNF receptor 1, and TNF-α– converting enzyme by peripheral-blood monocytes [21]. Treatment with golimumab did not demonstrate a favorable risk-benefit profile in patients with severe persistent asthma [22]. A study with etanercept showed a small decrease in asthma exacerbations was observed in a randomized placebo controlled study [23]. In a case-series report was it told that in severe, uncontrolled, steroid-dependent asthma infliximab could reduce exacerbations and hospitalizations [24]. In some severe refractory asthma endotypes anti-TNFα therapy may have a role. However, it should be kept in mind that these agents have some safety concerns and should use carefully only in some severe refractory asthma endotypes [5].

ANTI-IgE

The first developed biologic agent is the anti-immunoglobulin E monoclonal antibody called omalizumab. Currently it is an approved treatment option for asthma [5].

The other human(ized) promising monoclonal antibody drug developed, but not approved yet is ligeluzimab. Ligeluzimab binds with very high affinity to the Cε3 domain of IgE. Ligeluzumab may provide longer supression of IgE. Trials with this biologic agent are ongoing [5].

Anti-ige: off-label use non-atopic asthma

The off-label use of omalizumab in patients with uncontrolled non-atopic asthma has resulted in a decrease in exacerbation rates and improvement in asthma symptom scores. In a study conducted in 2013, omalizumab was administered to 266 patients with severe allergic asthma and 29 patients with non-atopic severe asthma for two years, and the study found a decline in the exacerbation rate, increase in the quality of life, and significantly improved disease control in both groups [25-27]. In two studies which used omalizumab in a group of patients with non-atopic severe asthma, the authors observed downregulation of FcRI expression in the basophils and increased FEV1.

Nasal polyposis, allergic rhinitis, and allergic bronchopulmonary aspergillosis

Allergic bronchopulmonary aspergillosis affects 7 to 9% of patients with cystic fibrosis (CF) and 1 to 2% of patients with asthma, posing a diagnostic challenge [28,29]. Cases series related to ABPA were first published in 2007. In a series of eight cases with cystic fibrosis and ABPA published by Tanou et al. [30] in 2014, the authors reported increased FEV1, improved respiratory symptoms, and reduced steroid consumption. In a series of six cases with CF diagnosed with ABPA published by Lehman et al. [31], the authors reported improved symptoms in patients receiving omalizumab, whereas the efficacy of the treatment was less pronounced in patients diagnosed with ABPA and long disease duration and in patients who developed progressive lung problems [31]. In a series of 14 patients with severe asthma and ABPA in 2015, Aydın et al. [32] showed that 11 patients achieved complete and three patients achieved partial response. The authors also reported an overall improvement in the pulmonary functions and respiratory symptoms with a statistically significant reduction in the use of oral corticosteroids (OCS) and number of disease episodes. Also, the patients with a total immunoglobulin E (IgE) level of <1,000 IU showed a better response to omalizumab, compared to those with a total IgE level of >1,000 IU. However, this finding was found to have a low-evidence level, considering the lack of large-scale, prospective case series and randomized and placebo- controlled studies.

Efficacy and safety of omalizumab were first evaluated in a randomized, double-blind, placebo-controlled study of 221 patients with seasonal allergic rhinitis in 2002 [33]. This study reported a significant symptomatic relief up to 48% in the combination treatment group (specific immunotherapy [SIT]+omalizumab), compared to SIT group alone. A randomized study in Japan reported a significant improvement in daily nasal and eye symptoms in patients with seasonal allergic rhinitis receiving omalizumab [34].

In 2007, a randomized placebo-controlled study of eight patients was the first to report reduced rates of postoperative polyp recurrence in patients with atopic asthma and nasal polyps (NP) [35]. In a study of 19 patients with severe asthma and NP in 2011, Vennera et al. [36] reported symptom reduction and disease stabilization with the use of omalizumab treatment. In addition, Tajiri et al. [37] evaluated omalizumab in patients with severe asthma and NP, and reported significant improvements in nasal symptoms, asthma control, and sinus tomography results. However, not all studies were able to show the beneficial effects of the treatment. In a randomized, double-blind, placebo-controlled study of patients with chronic rhinosinusitis receiving omalizumab, Pinto et al. [38] showed improvement in the Sino-Nasal Outcome Test (SNOT-20) scores at three, five, and six months, although there was no significant difference in the scores compared to the control group. The aforementioned study did not observe any changes in the quality of life, symptom scores, cellular inflammation, nasal passage, and olfactory test parameters.

Atopic Dermatitis And Food Allergy

In a series of three patients published in 2005, the authors reported no response after four months of treatment [39], while Lane et al. [40] published a series of three patients in the same study period and reported successful treatment outcomes of severe AD using omalizumab [40]. In addition, a pilot study of 21 patients published in 2009 found a statistically significant clinical improvement in all patients [41]. Another series of three patients published in 2011 reported significant improvement in the Eczema Area and Severity Index (EASI) and itching severity score in patients with severe AD unresponsive to conventional treatment and those with elevated IgE levels [42]. A study of 11 patients published in the same year reported reduced SCORing Atopic Dermatitis (SCORAD) scores, reduced symptoms, and significant improvement in the quality of life (3). The efficacy of omalizumab was also evaluated in 20 adults with severe AD in a prospective, 28-week, open-label study conducted by Hotze et al. [43] in 2014. The authors reported no response to treatment in seven patients harboring filaggrin gene mutation (FLG), while there was a significant improvement in the remaining eight patients. The authors also concluded that the patients with FLG gene mutation were prone to achieve lower response to omalizumab.

Furthermore, in food-related immunotherapy (IT) studies, omalizumab initiated before or received simultaneously with the treatment facilitated the development of tolerance. In a series of 11 patients with cow milk allergy scheduled for IT, 10 patients tolerated daily intake of 8 g cow milk after the initiation of omalizumab, nine weeks before IT, and combination with IT treatment, thereafter [44]. Another use of this treatment is to facilitate a rapid and safe transition to the maintenance phase in patients with food allergy receiving oral IT [45]. Another use of the treatment in food allergy is eosinophillic esophagitis developing in association with multiple food allergies. Also, in a study administered omalizumab to patients with eosinophillic esophagitis, the authors found reduced allergic symptoms and improved quality of life, although there was no change in endoscopic and histologic characteristics of the disease [46].

Food Allergy and Anaphylaxis

Anaphylaxis can occur as a result of exposure to various allergens such as food, drug, and venom; however, no triggering factor can be shown in some cases, of which the latter is known as idiopathic anaphylaxis. The patients with elevated baseline tryptase levels or those diagnosed with mastocytosis are expected to have higher rates of anaphylaxis with a more aggressive course of disease. In particular, patients with venom allergy on IT may experience some difficulties in switching to maintenance dose. Severe anaphylactic episodes can be observed in patients diagnosed with mastocytosis on IT due to venom allergy. In addition, IT combined with omalizumab has enabled a safe transition to the maintenance phase in this group of patients [47-49]. Addition of omalizumab to rush and ultra-rush venom IT protocols has increased the success of IT and enabled a safer transition to the maintenance phase. Another use of omalizumab is to prevent recurrent anaphylactic episodes in patients who are unable to be controlled with conventional therapies [50- 55]. There are case reports on the role of this treatment in preventing idiopathic anaphylactic episodes [56-58].

Several studies have reported asthma symptom control, improved quality of life, and development of tolerance to aspirin in two patients with the use of omalizumab in patients with aspirin-induced airway disease, nasal polyps, and severe asthma [59, 60]. Two patients with recurrent insulin allergy, despite the use of desensitization protocols, and one patient of carboplatin allergy during carboplatin therapy due to ovarian cancer successfully continued their treatment with the addition of omalizumab to the treatment [61-63].

In conclusion, although omalizumab has been approved for the treatment of severe allergic asthma and chronic idiopathic urticaria, it offers an off-label use as a final resort in many allergic diseases. Recent studies have shown that omalizumab is effective in treating bullous pemphigoid, Stevens-Johnson syndrome (SJS)/toxic
epidermal necrolysis (TEN, Type-III/IV reaction, such as graft versus host disease), Netherton syndrome, asthma and chronic obstructive pulmonary disease overlap syndrome (ACOS). Its effects on soluble inflammatory markers, such as sCD200, sTRAIL, hematopoietic cells, Th1/2 cytokines (CXCL8; IL-1β; IL-4; IL-5; IL17A), total antioxidant capacity, hydrogen peroxide, malondialdehyde and total nitric oxide concentrations were demonstrated in several studies [64-70].

Monoclonal antibodies are a candidate for use in several indications with the contribution of large-scale studies to the literature in the near future.

Declaration of Interest

All authors declare that they have no conflict of interest.

Acknowledgements

Prof.Dr. Tse Wen Chang, Prof.Dr.Saadet Gumuslu, Prof.Dr. Fatih Uz, Prof.Dr Arzu Mirici.

References

  • Beasley R, Semprini A, Mitchell EA (2015) Risk factors for asthma: is prevention possible? Lancet 386: 1075-1085. [crossref]
  • Yalcin AD, Celik B, Gumuslu S (2014) D-dimer levels decreased in severe allergic asthma and chronic urticaria patients with the omalizumab treatment. Expert Opin Biol Ther 14:283-6.
  • Yalcin AD (2015) Advances in anti-IgE therapy. Biomed Res Int 2015: 317465. [crossref]
  • Yalcin AD, Cilli A, Bisgin A, et al. (2013) Omalizumab is effective in treating severe asthma in patients with severe cardiovascular complications and its effects on sCD200, d-dimer, CXCL8, 25-hydroxyvitamin D and IL-1ß levels. Expert Opin Biol Ther 13:1335-41.
  • Mitchell PD, El-Gammal AI, O’Byrne PM (2016) Emerging monoclonal antibodies as targeted innovative therapeutic approaches to asthma. Clin Pharmacol Ther 99:38-48.
  • Chung KF (2015) Targeting the interleukin pathway in the treatment of asthma. Lancet 386: 1086-1096. [crossref]
  • Wang FP, Liu T, Lan Z, Li SY, Mao H (2016) Efficacy and Safety of Anti-Interleukin-5 Therapy in Patients with Asthma: A Systematic Review and Meta-Analysis. PLoS One 11: e0166833. [crossref]
  • Ortega HG, Liu MC, Pavord ID, Brusselle GG, FitzGerald JM, et al. (2014) Mepolizumab treatment in patients with severe eosinophilic asthma. N Engl J Med 371: 1198-1207. [crossref]
  • Castro M, Zangrilli J, Wechsler ME et al. (2015) Reslizumab for inadequately controlled asthma with elevated blood eosinophil counts: results from two multicentre, parallel, double-blind, randomised, placebo-controlled, phase 3 trials. Lancet Respir Med 3:355-66.
  • Khorasanizadeh M, Eskian M, Assa’ad AH, Camargo CA Jr, Rezaei N,  et al. (2016) Efficacy and Safety of Benralizumab, a Monoclonal Antibody against IL-5Rα, in Uncontrolled Eosinophilic Asthma. Int Rev Immunol 35: 294-311. [crossref]
  • Tan HT, Sugita K, et al. (2016) Novel Biologicals for the Treatment of Allergic Diseases and Asthma. Curr Allergy Asthma Rep 16: 70. [crossref]
  • Wenzel S, Ford L, Pearlman D, Spector S, Sher L, et al. (2013) Dupilumab in persistent asthma with elevated eosinophil levels. N Engl J Med 368: 2455-2466. [crossref]
  • Wenzel S, Castro M, Corren J, et al. (2016) Dupilumab efficacy and safety in adults with uncontrolled persistent asthma despite use of medium-to-high- dose inhaled corticosteroids plus a long-acting ß2 agonist: a randomised double-blind placebo-controlled pivotal phase 2b dose-ranging trial. Lancet 388:31-44.
  • Hambly N, Nair P (2014) Monoclonal antibodies for the treatment of refractory asthma. Curr Opin Pulm Med 20: 87-94. [crossref]
  • Corren J, Lemanske RF, Hanania NA, Korenblat PE, Parsey MV, et al. (2011) Lebrikizumab treatment in adults with asthma. N Engl J Med 365: 1088-1098. [crossref]
  • Piper E, Brightling C, Niven R, Oh C, Faggioni R, et al. (2013) A phase II placebo-controlled study of tralokinumab in moderate-to-severe asthma. Eur Respir J 41: 330-338. [crossref]
  • Gauvreau GM, O’Byrne PM, Boulet LP, et al. (2014) Effects of an anti-TSLP antibody on allergen-induced asthmatic responses. N Engl J Med 370:2102-10.
  • Busse WW, Israel E, Nelson HS, et al. (2008) Daclizumab improves asthma control in patients with moderate to severe persistent asthma: a randomized, controlled trial. Am J Respir Crit Care Med 178:1002-8.
  • Krug N, Hohlfeld JM, Kirsten AM, et al. (2015) Allergen-induced asthmatic responses modified by a GATA3-specific DNAzyme. N Engl J Med 372:1987-95.
  • Busse WW, Holgate S, Kerwin E, et al. (2013) Randomized, double-blind, placebo-controlled study of brodalumab, a human anti-IL-17 receptor monoclonal antibody, in moderate to severe asthma. Am J Respir Crit Care Med 188:1294-302.
  • Berry MA, Hargadon B, Shelley M, Parker D, Shaw DE, et al. (2006) Evidence of a role of tumor necrosis factor alpha in refractory asthma. N Engl J Med 354: 697-708. [crossref]
  • Wenzel SE, Barnes PJ, Bleecker ER, et al. (2009) A randomized, double-blind, placebo-controlled study of tumor necrosis factor-alpha blockade in severe persistent asthma. Am J Respir Crit Care Med 179:549-58.
  • Morjaria JB, Chauhan AJ, Babu KS, et al. (2008) The role of a soluble TNFalpha receptor fusion protein (etanercept) in corticosteroid refractory asthma: a double blind, randomised, placebo controlled trial. Thorax 63:584-91.
  • Taillé C, Poulet C, Marchand-Adam S, Borie R, Dombret MC, et al. (2013) Monoclonal Anti-TNF-α Antibodies for Severe Steroid-Dependent Asthma: A Case Series. Open Respir Med J 7: 21-25. [crossref]
  • Domingo C, Pomares X, Angril N, Rudi N, Amengual MJ, et al. (2013) Effectiveness of omalizumab in non-allergic severe asthma. J Biol Regul Homeost Agents 27: 45-53. [crossref]
  • Garcia G, Magnan A, Chiron R, et al. (2013) A proof-of-concept, randomized, controlled trial of omalizumab in patients with severe, difficult-to-control, nonatopic asthma. Chest 144:411-9.
  • de Llano LP, Vennera Mdel C, Álvarez FJ, Medina JF, Borderías L, et al. (2013) Effects of omalizumab in non-atopic asthma: results from a Spanish multicenter registry. J Asthma 50: 296-301. [crossref]
  • Laufer P, Fink JN, Bruns WT, Unger GF, Kalbfleisch JH, et al. (1984) Allergic bronchopulmonary aspergillosis in cystic fibrosis. J Allergy Clin Immunol 73: 44-48. [crossref]
  • Greenberger PA, Patterson R (1988) Allergic bronchopulmonary aspergillosis and the evaluation of the patient with asthma. J Allergy Clin Immunol 81: 646-650. [crossref]
  • Tanou K, Zintzaras E, Kaditis AG (2014) Omalizumab therapy for allergic bronchopulmonary aspergillosis in children with cystic fibrosis: a synthesis of published evidence. Pediatr Pulmonol 49:503-7
  • Lehmann S, Pfannenstiel C, Friedrichs F, Kröger K, Wagner N, et al. (2014) Omalizumab: a new treatment option for allergic bronchopulmonary aspergillosis in patients with cystic fibrosis. Ther Adv Respir Dis 8: 141-149. [crossref]
  • Aydin Ö, Sözener ZÇ, Soyyigit S et al. (2015) Omalizumab in the treatment of allergic bronchopulmonary aspergillosis: One center’s experience with 14 cases. Allergy Asthma Proc 36:493-500.
  • Kuehr J, Brauburger J, Zielen S, et al. (2002) Efficacy of combination treatment with anti-IgE plus specific immunotherapy in polysensitized children and adolescents with seasonal allergic rhinitis. J Allergy Clin Immunol 109:274-80.
  • Okubo K, Nagakura T (2008) Anti-IgE antibody therapy for Japanese cedar pollinosis: omalizumab update. Allergol Int 57: 205-209. [crossref]
  • Penn R, Mikula S (2007) The role of anti-IgE immunoglobulin therapy in nasal polyposis: a pilot study. Am J Rhinol 21: 428-432. [crossref]
  • Vennera Mdel C, Picado C, Mullol J, Alobid I, Bernal-Sprekelsen M (2011) Efficacy of omalizumab in the treatment of nasal polyps. Thorax 66: 824-825. [crossref]
  • Tajiri T, Matsumoto H, Hiraumi H, Ikeda H, Morita K, et al. (2013) Efficacy of omalizumab in eosinophilic chronic rhinosinusitis patients with asthma. Ann Allergy Asthma Immunol 110: 387-388. [crossref]
  • Pinto JM, Mehta N, DiTineo M, et al. (2010) A randomized, double-blind, placebo- controlled trial of anti-IgE for chronic rhinosinusitis. Rhinology 48:318-24.
  • Krathen RA, Hsu S (2005) Failure of omalizumab for treatment of severe adult atopic dermatitis. J Am Acad Dermatol 53: 338-340. [crossref]
  • Lane JE, Cheyney JM, Lane TN, Kent DE, Cohen DJ (2006) Treatment of recalcitrant atopic dermatitis with omalizumab. J Am Acad Dermatol 54: 68-72. [crossref]
  • Sheinkopf LE, Rafi AW, Do LT, Katz RM, Klaustermeyer WB (2008) Efficacy of omalizumab in the treatment of atopic dermatitis: a pilot study. Allergy Asthma Proc 29: 530-537. [crossref]
  • Thaiwat S, Sangasapaviliya A (2011) Omalizumab treatment in severe adult atopic dermatitis. Asian Pac J Allergy Immunol 29: 357-360. [crossref]
  • Hotze M, Baurecht H, Rodríguez E, et al. (2013) Increased efficacy of omalizumab in atopic dermatitis patients with wild-type filaggrin status and higher serum levels of phosphatidylcholines. Allergy 69:132-5.
  • Nadeau KC, Schneider LC, Hoyte L, Borras I, Umetsu DT (2011) Rapid oral desensitization in combination with omalizumab therapy in patients with cow’s milk allergy. J Allergy Clin Immunol 127: 1622-1624. [crossref]
  • Bégin P, Dominguez T, Wilson SP, Bacal L, Mehrotra A, et al. (2014) Phase 1 results of safety and tolerability in a rush oral immunotherapy protocol to multiple foods using Omalizumab. Allergy Asthma Clin Immunol 10: 7. [crossref]
  • Rocha R, Vitor AB, Trindade E, Lima R, Tavares M, et al. (2011) Omalizumab in the treatment of eosinophilic esophagitis and food allergy. Eur J Pediatr 170: 1471-1474. [crossref]
  • Kontou-Fili K. High omalizumab dose controls recurrent reactions to venom immunotherapy in indolent systemic mastocytosis. Allergy 63:376-8.
  • Sokol KC, Ghazi A, Kelly BC, Grant JA (2014) Omalizumab as a desensitizing agent and treatment in mastocytosis: a review of the literature and case report. J Allergy Clin Immunol Pract 2: 266-270. [crossref]
  • da Silva EN, Randall KL (2013) Omalizumab mitigates anaphylaxis during ultrarush honey bee venom immunotherapy in monoclonal mast cell activation syndrome. J Allergy Clin Immunol Pract 1:687- 8.
  • Douglass JA, Carroll K, Voskamp A, Bourke P, Wei A, et al. (2010) Omalizumab is effective in treating systemic mastocytosis in a nonatopic patient. Allergy 65: 926-927. [crossref]
  • Jagdis A, Vadas P (2014) Omalizumab effectively prevents recurrent refractory anaphylaxis in a patient with monoclonal mast cell activation syndrome. Ann Allergy Asthma Immunol 113:115-6.
  • Paraskevopoulos G, Sifnaios E, Christodoulopoulos K, Mantopoulou F, Papakonstantis M, et al. (2013) Successful treatment of mastocytic anaphylactic episodes with reduction of skin mast cells after anti-IgE therapy. Eur Ann Allergy Clin Immunol 45: 52-55. [crossref]
  • Matito A, Blázquez-Goñi C, Morgado JM, Alvarez-Twose I, Mollejo M, et al. (2013) Short-term omalizumab treatment in an adolescent with cutaneous mastocytosis. Ann Allergy Asthma Immunol 111: 425-426. [crossref]
  • Bell MC, Jackson DJ (2012) Prevention of anaphylaxis related to mast cell activation syndrome with omalizumab. Ann Allergy Asthma Immunol 108: 383-384. [crossref]
  • Kibsgaard L, Skjold T, Deleuran M, et al. (2014) Omalizumab induced remission of idiopathic anaphylaxis in a patient suffering from indolent systemic mastocytosis. Acta Derm Venereol 94:363-4.
  • Lee J (2014) Successful prevention of recurrent anaphylactic events with anti-immunoglobulin E therapy. Asia Pac Allergy 4: 126-128. [crossref]
  • Demirtürk M, Gelincik A, ColakoÄŸlu B, Dal M, Büyüköztürk S (2012) Promising option in the prevention of idiopathic anaphylaxis: omalizumab. J Dermatol 39: 552-554. [crossref]
  • Jones JD, Marney SR Jr, Fahrenholz JM (2008) Idiopathic anaphylaxis successfully treated with omalizumab. Ann Allergy Asthma Immunol 101:550-1.
  • Bobolea I, Barranco P, Fiandor A, et al. (2010) Omalizumab: a potential new therapeutic approach for aspirin-exacerbated respiratory disease. J Investig Allergol Clin Immunol 20:448-9.
  • Matheu V, Franco A, Perez E, Hernández M, Barrios Y (2007) Omalizumab for drug allergy. J Allergy Clin Immunol 120: 1471-1472. [crossref]
  • Cavelti-Weder C, Muggli B, Keller C, et al. Successful use of omalizumab in an inadequately controlled type 2 diabetic patient with severe insulin allergy. Diabetes Care 35:e41.
  • Yong PF, Malik R, Arif S, Peakman M, Amiel S, et al. (2009) Rituximab and omalizumab in severe, refractory insulin allergy. N Engl J Med 360: 1045-1047. [crossref]
  • Ojaimi S, Harnett PR, Fulcher DA (2013) Successful carboplatin desensitization by using omalizumab and paradoxical diminution of total IgE levels. J Allergy Clin Immunol Pract 2:105-6.
  • Uzun R, Yalcin AD, Celik B, et al. (2016) Levofloxacin Induced Toxic Epidermal Necrolysis: Successful Therapy with Omalizumab (Anti-IgE) and Pulse Prednisolone. Am J Case Rep 17:666-71.
  • Yalcin AD (2015) A case of netherton syndrome: successful treatment with omalizumab and pulse prednisolone and its effects on cytokines and immunoglobulin levels. Immunopharmacol Immunotoxicol 38:162- 6.
  • Yalcin AD, Celik B, Yalcin AN (2016) Omalizumab (anti-IgE) therapy in the asthma-COPD overlap syndrome (ACOS) and its effects on circulating cytokine levels. Immunopharmacol Immunotoxicol 38:253-6.
  • Yalcin AD, Genc GE, Celik B, Gumuslu S (2014) Anti-IgE monoclonal antibody (omalizumab) is effective in treating bullous pemphigoid and its effects on soluble CD200. Clin Lab 60: 523-524. [crossref]
  • Yalcin AD, Bisgin A, Gorczynski RM (2012) IL-8, IL10, TGF-ß and GCSF levels were increased in severe persistent allergic asthma patients with the anti-IgE treatment. Mediators inflamation
  • Yalcin AD, Bisgin A (2012) The Relation of sTRAIL Levels and Quality of Life In Omalizumab Using Severe Persistent Allergic Asthma Patients. (WISC 2012: WAO Outstanding Abstract Award) Med Sci Monit 18: LE9-10.
  • Yalcin AD, Ucar S, Gumuslu S, Strauss L (2015) Effects of Omalizumab on Eosinophil Cationic Peptid, 25-Hydroxyvitamin-D, IL-1ß, and sCD200 in a cases of Samter’s syndrome: 36 Months follow-up. Immunopharmacology And Immunotoxicology.

The Usefulness of the Rate Pressure Product (RPP) for Cardiac Rehabilitation Exercise Prescription

Introduction

The autonomic nervous system (ANS) is an arm of the nervous system surrounded by the peripheral nervous system (PN) and the central nervous system (CNS). It is responsible for the regulation of involuntary bodily functions such as the beating of the heart to the way in which food is digested [1-4]. This system further separates into two division: the sympathetic nerves (SNs) and the parasympathetic nerves (PNs) with each carrying efferent (motor) signals to the heart and afferent responses to the brain [2,3]. In maintaining the body’s homeostasis, each nerve fibre triggers internal or external stimulus. Stimulations coming from the SNs releases epinephrine and norepinephrine prepare the body for stressful or emergency situations or what is best known as the fight or flight state [2]. SNs activities increase heart rate, cardiac output, contractility, conduction velocity and blood pressure during physical stimuli such as exercise [2]. SNs also makes the palm of the hand sweat, the pupils to dilate, and causes the hair on the body to stand on end [2].

In contrast, the PNs which originate from the brain stem and the sacral portion of the spinal cord releases acetylcholine to conserve energy during normal relaxed situations [2]. The efferent outflow termed the vagus nerve operates the parasympathetic to transmit nerves fibres to the lung, heart and other organs [2, 3,]. These nerves work to lower blood pressure (BP), to slow the heart rate (HR) down and to control digestive functions [2].

The SNs and PNs work in opposite direction of each other and as such the SNs enhance automaticity, while the PNs inhabit it [5]. A good demonstration of SNs and PNs operating in opposed action would be if the heart receives a neural stimulus from the parasympathetic branch; it would slow the heart down whereas sympathetic activities would speed up the heart. There is a wide consent suggesting that any changes between the systems play a role in pathological dysfunctions of the ANS [3-5]. For example, a cascade of adverse cardiac events takes place if parasympathetic vagal tone decreases [3, 5-6]. Hypertension-related diseases, coronary heart disease, heart failure and myocardial ischemia are various heart conditions caused by chronic SNs activation [5-8]. The shifts to a more sympathetic overdrive are a catastrophe for ANS impairment. As such any treatment whether by drug action or with exercise training that tilts the autonomic balance toward greater parasympathetic dominance and less sympathetic activity significantly improve prognosis [3].

Moreover, cardiovascular autonomic functions or dysfunctions are clinically evaluated by measuring resting heart rate (RHR), heart rate (HR), BP or heart rate recovery (HRR) [6]. Whether done directly or indirectly these autonomic parametres are good indicators in determining how the heart is working during conditions like exercise or stress [6,7,5,9]. In clinical practices, more specifically in cardiac rehabilitation (CR), several autonomic parametres are used in assessing patients ANS function and their physical capacity. Unfortunately, because of the difficulties and the lack of experience to perform some tests, and the time it takes to do the test, some methods are not applicable in CR setting [4].

In looking at different nerve simulations, clinical research studies found that ANS parametres were risk markers for cardiovascular diseases [5,7,9]. A decline in heart rate variability (HRV), for example, was associated with many cardiac conditions including sudden death [9]. Indeed clinical procedures like HRV in monitoring autonomic processes are necessary with patients. They are practical to check if the ANS is operating normally or to see if a disease or disorders are attacking the system. In this paper, we briefly look at the RPP and how the usefulness of this autonomic test is to CR. The RPP has been quoted in the literature, but it is now accepted as a reliable tool for making clinical decisions for exercise prescription.

Cardiac Rehabilitation and Exercise Testing (ET)

Cardiac rehabilitation is an outpatient health programme delivered by a multidisciplinary team of health professionals (i.e. physicians, nurses, exercise physiologist, dieticians) following cardiac incidents [10-13]. The plan typically provides a multifaceted offering of health services such as low to moderate exercise training, health education, risk factor modifications, counselling and social services [10-12]. The objective of CR is to enhance secondary prevention by lessening cardiac symptoms thereby reducing cardiac mortalities and morbidities for patients with cardiovascular disease [13]. Evidence demonstrate the efficacy of CR interventions where these schemes have improved patient’s quality of life (i.e. reduce depression, better risk profile, enhanced functional status) [12-14]. In one study a CR exercise-based programme was safe to improve cardiopulmonary function with patients who had preserved left ventricular ejection fraction (LVEF) and reduced LVEF [15]. In another research, the authors suggested following coronary artery bypass surgery exercise has the potential to better the long-term prognosis and lower the need for hospital care in cardiac patients [16]. CR is indicative in supporting cardiac autonomic functions to improve the long-term health and well-being of cardiac patients and their families.

Exercise prescription in CR is a determinant on patient’s ET results. Before the start of a CR programme, it is standard practice for all patients to undergo clinical assessments which include ET [11]. With a goal to boost patient’s clinical outcome, ET is done by evaluating left ventricular function (LVF) using an echocardiography or with a maximal exercise test limited by symptoms [11,17-20]. Before the beginning and ending of the programme, ET is the most critical testing component in CR. It provides plenty of information about patients’ functional capacity, their hemodynamic adaptation to maximal and submaximal levels of exercise HR and BP, their residual myocardial ischemia, and their cardiac arrhythmias which can be either induced or worsens with activity [20]. CR exercise testing also let us knows the amount needed to calculate patients training heart rate (THR) for the aerobic exercise [20].

The cardiopulmonary graded test or CPX is the gold standard and approved method used for CR exercise testing. Testing is conducted by treadmill walking, ergometre cycling, stepping, or performing a 12 minute timed walking test [11, 18-20]. During the CPX, patient’s peak oxygen uptake (VO2peak), their anaerobic threshold, their VE/VCO2 and O2 are observed as well as other parametres such as their maximal workload, and their resting and exercised BP and HR [20]. VO2peak is the most frequently analysed CPX parametre as it determines patients’ functional capacity, and it is the strongest prognostic for cardiovascular disease [20]. VO2peak provides information on exercise intensity with a percentage of 50% to 70% the most acceptable [18, 20]. Under the supervision of a healthcare professional patient’s workload is monitored at various exercise stage [18, 20]. They are asked about the perception of exercise intensity using the well-known Borg Rating of Perceived Exertion Scale (RPE) [11, 20]. Furthermore, it is advisable the patient completes each stages of exercise [11]. However, with their discretion, the physician or cardiologist could terminate the test at a particular heart rate or at the request of the patient [11].

Following the completion of ET patients HR, BP and their total VO2peak are recorded and analysed [20]. As a component of functional capacity, the VO2peak decides exercise prescription and is cited as an independent predictor of all-cause mortality in patients with cardiac conditions [11, 20]. After they have been discharged from CR, studies show patient’s functional capacity gets better [20]. The VO2peak test appears to be a valuable clinical assessment in the planning of patients’ management. If the test is not available to measure patients’ fitness capacity, the one metabolic equivalent (MET) formula is applied [11, 20]. The one METs is a very simple procedure to express the energy cost of physical activities as multiples of resting metabolic rate [11]. It is a measurement of the exertion intensity of physical activity, and it is defined by the amount of oxygen consumed while sitting quietly at rest and is equal to 3.5 ml O2 per kg body weight x min (i.e. 3.5 ml O2/kg/min) [11, 20]. For example, a physical activity requiring an 8-MET resting metabolic rate represents a VO2 of 28 ml • kg-1 • min-1. In calculating the absolute oxygen requirement of the activity with 8 MET the individual’s body weight is multiplied by the VO2 (kg-1 • min-1) (i.e. VO2 (kg-1 • min-1 =28 kg-1 • min-1 x 70 kg = 1.960 ml • min-1). A noted feature of the metabolic equivalent is that men and women do not produce the same values (i.e. METs= 14.7 – 0.11 x age for males and respectively 14.7 – 0.13 x age for females.) [20]. This gender difference in computation accounts for women’s having lower level of work capacity [11].

As mentioned earlier, patients’ exertion level in CR is estimated from the RPE scale. The scale ranges from 6 to 20, but the American Association of Cardiovascular and Pulmonary Rehabilitation (AACPR) suggest a RPE of 11 to 15 as a safe zone for patients [11]. An important characteristic of the RPE is that it works linearly with HR and with exercise intensity [11,21]. As such you can estimate the HR value of various levels of work intensity by adding a zero to each point on the PRE [21]. For instance, RPE of 6 becomes 60 and represents HR at rest, and 20 becomes 200, which may represent patients maximal HR [21]. Subsequently, you can use the RPP to know patients’ maximal HR and training workload. Case in point, if a patient develops some discomfort in the chest (i.e. angina pectoris) at a given level of exercise intensity, for safety the CR health professional should advise the patient to workout at a lower intensity. In this way, it would help to keep his training HR below the threshold where he may experience physical symptoms. The RPP is complementary to the RPE while having the ability to support safe CR exercise prescription for cardiac patients who might experience mild chest pain while they are exercising.

Rate Pressure Product (RPP)

To determine the energy requirement and establish the amount of stress put on the heart during exercise, cardiac specialist or exercise physiologists use the RPP. It is an observation of myocardial oxygen consumption (MVO2) [22-26] representing the internal myocardial workload when the heart beats while the external myocardial work is a reflection of different stages of exercise. [27]. Expressed as the product of systolic blood pressure (SBP) and resting heart rate, you can calculate the RPP by multiplying the SBP by the RHR and dividing by 100 (i.e. RPP = SBP x HR/100) [21-27]. PNs and SNs mediate both HR and SBP with SBP only affected by SN [25]. What’s more, depending on the individual physical or health condition RPP score may vary. Fornitano and de Godoy suggested RPP above 30,000 mmHg bpm are good values to predict the absence of obstructive coronary artery disease in patients with positive ET [27].

Heart Rate and Blood Pressure on Exercise Training

The heart needs sufficient amount of oxygen to work properly, and if there is not enough supply, it will cause the heart to weaken (e.g. heart failure) [22]. In this case, the RRP is important in providing information on patients’ myocardial oxygen consumption [20]. Blood pressure and HR is a determinant of physical fitness since they both increase during exercise, but not at the same pace [20, 24, 25]. In subjects with BP between 110 to 120 systolic and 60-80 diastolic whereas resting heart rate (RHR) is 65 to 70 beats per minute (bpm) is considered normal [26]. Under these conditions, the heart does not need to work as hard because the oxygen demand is less [26]. Conversely, in patients with BP over 140/90 mm Hg and an RHR of 85 bpm or higher the heart works harder as it requires more oxygen [26].

Typically, an increase in HR during exercise is a sign that more blood and oxygen is travelling to the working muscles, while elevated BP indicates more blood gets pumped to the heart [24, 26]. As noted, increased BP and HR do not occur at the same time. Thus, a rise in HR triggers blood vessels to widen which in turn helps to keep BP under control [24]. This situation is why healthy people can recover much faster from exercise as compared to someone with a medical condition [20, 22]. The quick recovery is also a sign that there is more parasympathetic vagal tone and less sympathetic activity, which also accounts for the reduction in HR [22].

Extensive clinical and rehabilitation studies on the impact of RPP noted its efficacy as a reliable index to assess patients’ with cardiovascular conditions or related complications on myocardial oxygen consumption during their exercise. Coelho and colleague identified positive changes in MVO2 values following training in patients with ischemic heart disease [28]. Keyhani and co-authors investigated the effects of an eight-week CR aerobic exercise programme on BP, HR, and RPP in patients with congestive heart failure (CHF) found their cardiac functional capacity improved as well as their autonomic function [29]. Still, Adams et al. compared peak RPP values with various modes of aerobic exercise after CR training discovered treadmill walking to associate with a higher score while resistance training produced a much lower number [21].

Looking at the RPP and autonomic responses of Tai Chi practitioners and non-practitioners at rest and using two different stressors: hand gripping and standing Figueroa and colleagues saw improved autonomic function (i.e. parasympathetic tone) with the Tai Chi group [27]. The Tai Chi practitioners’ sympathetic outflow and RPP were also significantly lower at rest suggesting they were better efficient in myocardial oxygen use during resting and pathological stress [27]. The positive outcomes are a testament that the RPP is a reliable tool and an acceptable approach in observing patient’s cardiac autonomic exercise responses that favour greater parasympathetic tone.
The magnitude and the time BP and HR changes after the cessation of exercise are not without discrepancies [28]. When compared to pre-exercise during the first hour of recovery, Somers et al. [30] found lower BP levels, whilst Pescatello et al. [30] saw a significant fall that was up to 12 hours following exercise. Equally, post-exercise HR was reported to enhance, cause no change or decrease [30]. These observations give us a hint that different exercise intensity, duration, and mode significantly influence BP and HR responses following training. Forjaz et al. [31] study recognised that exercise training at a lower intensity, does not only generate a small increase in RPP during exercise, but it also decreases post-exercise rate at rest. By doing so, this reduces myocardial oxygen consumption and lower cardiovascular risks after exercise. In regards to exercise at moderate or high intensity, RPP appears to be greater during training but it decreases below baseline following the recovery period [31]. As cited RPP varies with exercise and there is evident it has clinical implications in providing exercise prescription with those experiencing medical conditions [30].

Conclusion

In addition to standardised CR exercise tests, the RPP supplements with other ET. This autonomic measurement is efficient as gives clues and evaluates patient’s physical or cardiac functional capacity, exercise tolerance and oxygen demand during CR exercise testing and training. Importantly, its utilisation offers support to CR health professionals in selecting the right exercise intensity or training method for those patients whom may show cardiac risk.

References

  • Shields RW Jr (1993) Functional anatomy of the autonomic nervous system. J Clin Neurophysiol 10: 2-13. [crossref]
  • Freeman JV, Dewey FE, Hadley DM, Meyers J, Froelicher VF (2006) Autonomic nervous system interaction with the cardiovascular system during exercise. Pro ardiovasc Dis 48: 342-362.
  • Curtis BM, O’Keefe JH Jr (2002) Autonomic tone as a cardiovascular risk factor: the dangers of chronic fight or flight. Mayo Clin Proc 77: 45-54. [crossref]
  • Zygmunt A, Stanczyk J (2010) Methods of evaluation of autonomic nervous system function. Arch Med Sci 6: 11-18. [crossref]
  • Sztajzel J (2004) Heart rate variability: a noninvasive electrocardiographic method to measure the autonomic nervous system. Swiss Med Wkly 134: 514-522.
  • Martin B, Papelier Y, Laursen PB, Ahmaidi S (2007) Noninvasive assessment of cardiac parasympathetic function: postexercise heart rate recovery or heart rate variability? Am Jf Physiol Heart Circ Physiol 293: H8-H10.
  • Ruediger H, Seibt R, Scheuch K, Krause M, Alam S (2004) Sympathetic and parasympathetic activation in heart rate variability in male hypertensive patients under mental stress. J Hum Hypertens 18: 307-315.
  • Palatini P, Julius S (2009) The role of cardiac autonomic function in hypertension and cardiovascular disease. Curr Hypertens Rep 11: 199-205. [crossref]
  • Del Pozo JM, Gevirtz RN, Scher B, Guarneri E (2004) Biofeedback treatment increases heart rate variability in patients with known coronary artery disease. Am Heart J 147: 545.
  • National Health and Medical Research Council: Strengthening cardiac rehabilitation and secondary prevention for Aboriginal and Torres Strait Islander Peoples: a guide for health professionals. Canberra, Australia: Australian Government; 2005.
  • Goble AJ, Worcester M (1999) Best practice guidelines for cardiac rehabilitation and secondary prevention. Victoria, Australia: Heart Research Centre – on behalf of Department of Human Services Victoria
  • Cardiac rehabilitation: a model of care for South Australia. Australia: South Australia Department of Health, Statewide Service Strategy division.
  • Cardiac rehabilitation: evidence-based best practice guidelines. New Zealand: Heart Foundation; 2002.
  • Williams MA, Ades PA, Hamm LF, Keteyian SJ, LaFontaine TP, et al. (2006) Clinical evidence for a health benefit from cardiac rehabilitation: an update. Am Heart J 152: 835-841. [crossref]
  • Chul K, Choi HE, Lim YJ (2016) The effect of cardiac rehabilitation exercise training on cardiopulmonary function in ischemic cardiomyopathy with reduced left ventricular ejection fraction. Ann Rehabil Med 40: 647-656.
  • Hedbäck B, Perk J, Hörnblad M, Ohlsson U (2001) Cardiac rehabilitation after coronary artery bypass surgery: 10-year results on mortality, morbidity and readmissions to hospital. J Cardiovasc Risk 8: 153-158.
  • Zoneraich S (1983) Exercise testing and cardiac rehabilitation in patients with coronary artery disease. Bull N Y Acad Med 59: 635-659. [crossref]
  • Pina IL, Balady GJ, Hanson P, Labovitz AJ, Madonna DW, Myers J (1995) Guidelines for Clinical Exercise Testing Laboratories A Statement for Healthcare Professionals From the Committee on Exercise and Cardiac Rehabilitation, American Heart Association. Circulation 91:912-21.
  • Fletcher GF, Balady GJ, Amsterdam EA, Chaitman B, Eckel R, et al. (2001) Exercise standards for testing and training a statement for healthcare professionals from the American Heart Association. Circulation 104: 1694-1740.
  • Niebauer J (2011) Cardiac rehabilitation manual.
  • Adams J, Hubbard M, McCullough-Shock T, Simms K, et al. (2010) Myocardial work during endurance training and resistance training: a daily comparison, from workout session 1 through completion of cardiac rehabilitation. In Baylor University Medical Center.
  • Rishu S, Gupta V, Walia L, Mittal N (2013) Rate pressure product predicts cardiovascular risk in type 2 diabetics with cardiac autonomic neuropathy. Nat J Physiol, Pharma and Pharmacology 3: 43-47
  • Miyai N, Arita M, Miyashita K, Morioka I, Shiraishi T, Nishio I (2002) Blood pressure response to heart rate during exercise test and risk of future hypertension. Hypertension 39:761-6.
  • Gobel FL, Norstrom LA, Nelson RR, Jorgensen CR, Wang Y (1978) The rate-pressure product as an index of myocardial oxygen consumption during exercise in patients with angina pectoris. Circulation 3: 549-556.
  • Figueroa MA, Demeersman RE, Manning J (2012) The autonomic and rate pressure product responses of tai chi practitioners. N Am J Med Sci 4: 270-275. [crossref]
  • Sembulingam P, Sembulingam K, Ilango S, Sridevi G (2015) Rate pressure product as a determinant of physical fitness in normal young adults. IOSR-JDMS 1: 8-12.
  • Fornitano LD, Godoy MF (2006) Increased rate-pressure product as predictor for the absence of significant obstructive coronary artery disease in patients with positive exercise test. Arquivos brasileiros de cardiologia 86:138-44. 28
  • Coelho EM, Monteiro F, Da Conceição JM, Cruz J, Cunha D, et al. (1982) The rate pressure product: fact of fallacy? Angiology 33: 685-689. [crossref]
  • Keyhani D, Kargarfard M, Sarrafzadegan N, Sadeghi M (2013) Autonomic function change following a supervised exercise program in patients with congestive heart failure. ARYA atherosclerosis 9:150.
  • Al-Shamma YMH, Mhous AJ, Mousawi AM (2008) Heart Rate and Blood Pressure Changes After Exercise In Normal Adolescent In Relation To Body Mass Index. Kufa J Med 11: 437-447
  • Forjaz CL, Matsudaira Y, Rodrigues FB, Nunes N, Negrão CE (1998) Post-exercise changes in blood pressure, heart rate and rate pressure product at different exercise intensities in normotensive humans. Braz J Med Biol Res 31: 1247-1255. [crossref]

Revisiting ‘what causes cancer?’

Letter to the Editor

A thoughtful editorial previously published in Cancer Studies and Therapeutics pondered the question of “What is the Main Cause of Cancer?’ [1]. Certainly there are no simple answers.

Perhaps a study by Poutahidis et al (2015) [2] provides some clues to this ‘What Causes Cancer?’ enigma. Their studies in animal models revealed multigenerational cancer phenomena that were transplantable using fecal microbiota alone. These findings raise the possibility that disrupted microbiota, arising from societal practices such as refined diets or antibiotics during earlier generations, may have carcinogenic consequences in subsequent generations. The authors postulated that detrimental microbial effects in utero and during infancy lead to a dysregulated host immune system featuring premature thymic involution, possibly via epigenetic mechanisms. Under these immune-suppressed conditions, future infant mucosal surfaces become more permeable to environmental threats including sepsis [3]. Extrapolating across generations, microbiota may function as part of a quorum sensing mechanism ultimately influencing host immune and hormonal homeostasis, thus altering cancer susceptibility of progeny animals [4]. In those studies, grandchildren of mice consuming ‘fast food’ diets were at high risk to develop cancer at a young age, even without other predisposing genetic or environmental risks.

These intriguing data are supported by other findings suggesting that bacteria should be on our ‘What Causes Cancer?’ radar screen [5-7]. Firstly, direct evidence exists in humans with Helicobacter pylori infection and inflammation-associated gastric cancer [8]. Likewise, in the lower bowel, infection with a related microbe H. hepaticus leads to inflammation-associated colon and mammary tumors in mice [9, 10]. Further, certain pathogenic Escherichia coli organisms are shown to cause DNA damage in gut epithelia [6], and even to invade the bloodstream and extra-intestinal tissues. Indeed, E. coli has been implicated in mastitis and breast cancer in women [11], whereas Lactobacillus sp apparently inhibits mammary cancer development [12]. This raises the possibility that certain microbiota serve as invisible mutagens or guardians that help to explain the enigma.

And there’s more. Many studies have now shown that cancer-fighting capacity of our immune system can be mobilized or inhibited by our gut bacteria [10, 13-15]. Animal model systems mimicking complex cancer processes in human subjects reveal that microbes indirectly modulate tissue injury repair capacity and risk for tumor development and progression [3, 7, 9, 13-17]. For example, Poutahidis et al (2013) found that microbe therapy in mice led to proficient wound repair occurring twice-as-fast as in untreated controls [16]. Another study by Varian et al (2016) showed that microbe monotherapy was sufficient to increase thymus gland size, inhibit intestinal polyp formation, and increase lifespan in mouse models [18]. The proposed immune mechanisms involved microbial up-regulation of transcription factor Forkhead box protein N1 (FoxN1), the protein that is entirely lacking in athymic nude mice rendering them without T lymphocytes and as a result highly permissive to cancer growth [18, 19].

This leads us back to the original question of ‘What causes Cancer?’. The original author posited that for a theory of to be widely accepted, the answer should explain the striking differences in cancer risk by age and among tissues [1]. We should at least consider the possibility that our modernized lifestyle practices using antibiotics, Caesarian births, and refined diets have depleted valuable diversity and beneficial organisms in our microbiome with carcinogenic consequences to future generations. After all, oral supplementation with a model organism Lactobacillus reuteri, once believed to be widespread in humans but now dwindling to <4% of people worldwide [4], was sufficient to rescue multigenerational health impairments in infant mice [2, 20].

Further research is needed to better understand the roles of microbiota among the many possibilities for “What is the Main Cause of Cancer?’. However, based on existing data, opportunities abound for engineering diets and microbe cocktails to reinforce host balance and extinguish cancer for generations to come.

References

  • López-Lázaro M (2016) What is the Main Cause of Cancer? Can Stu The J 1:1-2.
  • Poutahidis T, Varian BJ, Levkovich T, Lakritz JR, Mirabal S, et al. (2015) Dietary microbes modulate transgenerational cancer risk. Cancer Res 75: 1197-1204. [crossref]
  • Erdman SE, Poutahidis T (2015) Gut bacteria and cancer. Biochim Biophys Acta 1856: 86-90. [crossref]
  • Erdman SE, Poutahidis T (2016) Microbes and Oxytocin: Benefits for Host Physiology and Behavior. Int Rev Neurobiol 131: 91-126. [crossref]
  • Rao VP, Poutahidis T, Fox JG and Erdman SE (2007) Breast cancer: should gastrointestinal bacteria be on our radar screen? Cancer Res 67:847-850.
  • Arthur JC, Perez-Chanona E, Muhlbauer M, Tomkovich S, et al. (2012) Intestinal inflammation targets cancer-inducing activity of the microbiota. Science 338:120-123.
  • Erdman SE (2016) Gut microbiota: Microbes offer engineering strategies to combat cancer. Nat Rev Gastroenterol Hepatol 13:125-126.
  • Wroblewski LE, Peek RM, Jr. and Wilson KT (2010) Helicobacter pylori and gastric cancer: factors that modulate disease risk. Clinical microbiology reviews 23:713-739.
  • Erdman SE, Poutahidis T, Tomczak M, Rogers AB, Cormier K, et al. (2003) CD4+ CD25+ regulatory T lymphocytes inhibit microbially induced colon cancer in Rag2-deficient mice. Am J Pathol 162: 691-702. [crossref]
  • Rao VP, Poutahidis T, Ge Z, Nambiar PR, et al. (2006) Innate immune inflammatory response against enteric bacteria Helicobacter hepaticus induces mammary adenocarcinoma in mice. Cancer Res 66:7395-7400.
  • Urbaniak C, Gloor GB, Brackstone M, Scott L, Tangney M, et al. (2016) The Microbiota of Breast Tissue and Its Association with Breast Cancer. Appl Environ Microbiol 82: 5039-5048. [crossref]
  • Lakritz JR, Poutahidis T, Levkovich T, Varian BJ, et al. (2014) Beneficial bacteria stimulate host immune cells to counteract dietary and genetic predisposition to mammary cancer in mice. Int J Cancer 135:529-540.
  • Erdman SE, Rao VP, Olipitz W, Taylor CL, Jackson EA, et al. (2010) Unifying roles for regulatory T cells and inflammation in cancer. Int J Cancer 126: 1651-1665. [crossref]
  • Vétizou M, Pitt JM,  Daillère R,  Lepage P2, Waldschmitt N3, et al. (2015) Anticancer immunotherapy by CTLA-4 blockade relies on the gut microbiota. Science 350: 1079-1084. [crossref]
  • Sivan A, Corrales L, Hubert N, Williams JB, et al. (2015) Commensal Bifidobacterium promotes antitumor immunity and facilitates anti-PD-L1 efficacy. Science 350:1084-1089.
  • Poutahidis T, Kearney SM, Levkovich T, Qi P, Varian BJ, et al. (2013) Microbial symbionts accelerate wound healing via the neuropeptide hormone oxytocin. PLoS One 8: e78898. [crossref]
  • Dvorak HF (2015) Tumors: wounds that do not heal-redux. Cancer Immunol Res 3: 1-11. [crossref]
  • Varian BJ, Goureshetti S, Poutahidis T, Lakritz JR,  et al. (2016) Beneficial bacteria inhibit cachexia. Oncotarget 7: 11803-11816. [crossref]
  • Erdman SE (2016) Microbes and healthful longevity. Aging (Albany NY) 8: 839-840. [crossref]
  • Buffington SA, Di Prisco GV, Auchtung TA, Ajami NJ, et al. (2016) Microbial Reconstitution Reverses Maternal Diet-Induced Social and Synaptic Deficits in Offspring. Cell 165:1762-1775.