Monthly Archives: February 2020

SRR 20 - 101_Joshua A Bloom_F1

Internal Loop Recording of Prolonged (39 Second) Sinus Pause Causing Syncope

Abstract

Presentation: A 53 year old woman presented with a syncopal episode which occurred whilst sitting in bed reading, witnessed by her husband. She was unrousable for maybe half a minute. She had no other medical history, clinical examination was unremarkable, as were multiple investigations.

Diagnosis: A loop recorder was inserted without difficulty. A few weeks later she again blacked out. Her loop recorder showed asystole for 39 seconds, followed by a return to sinus bradycardia and then sinus rhythm, accompanied by recovery of consciousness.

Treatment: She went on to have a dual chamber pacemaker inserted. At review after six weeks, six months and one year she had had no further syncopal episodes. 

Conclusion: This case reports one of the longest documented episodes of asystole with spontaneous recovery and serves as a reminder of the utility of internal loop recorders in the investigation of syncope.

Introduction

This case reports a patient with syncope in whom an internal loop recorder revealed one of the longest documented episodes of asystole with spontaneous recovery.

Case Report

A 53 year old woman presented with a syncopal episode which occurred whilst sitting in bed reading, witnessed by her husband. She was unrousable for maybe half a minute. She was a non-smoker, on no medications. Her father had a pacemaker inserted in his 70s, for slow atrial fibrillation; there was no family history of sudden adult death. She had no other clinical history; specifically, nothing to suggest sarcoidosis, haemochromatosis or other deposition disorders. Clinical examination was unremarkable. Multiple investigations, including echocardiography, electroencephalography and Holter monitoring, were essentially normal, as was brain magnetic resonance imaging. A Medtronic Reveal LINQ™ loop recorder was inserted without difficulty. A few weeks later she awoke as usual, went to the toilet, micturated and returned to bed feeling fine. Whilst lying in bed, she again blacked out. She recovered consciousness a while later, and felt nauseated with a slight headache.  That morning she was contacted by the hospital and advised to come in directly. Her loop recorder showed prolonged asystole!  Figure 1. She had gradually developed sinus bradycardia and then sinus arrest. After 39.4 seconds she returned to sinus bradycardia and then sinus rhythm without any compensatory tachycardia. There was no ventricular escape rhythm, simply a sinus pause with no rescue. The next day she was brought to the operating room for pacemaker insertion under local anaesthetic. Just after left subclavian vein cannulation, she had another 20 second pause, though she recovered before external pacing could be initiated. She regained consciousness and went on to have a dual chamber pacemaker inserted, with good thresholds in the right ventricular apex and right atrial appendage. At review after six weeks, six months and one year she had had no further syncopal episodes. 

JCCP-2020-303_G. Pate_F1

Figure 1. Internal loop recorder tracing of 39.4 second asystolic pause.

Discussion

Loop recorders have proved very useful in documenting previously unrecognized arrhythmias, particularly intermittent pauses [1]. Current guidelines recommend loop recorder insertion for any unexplained syncope [2]. In the event of documentation of any symptomatic pauses greater than 3 seconds, or nocturnal pauses greater than 6 seconds, pacemaker insertion is recommended [3]. Anything more than 10 seconds is described as a very long pause. Multiple papers have documented pauses of 10 seconds or more [4–7], including one of 44 seconds [8]. During a tilt table test one paper described asystole for 72 seconds [9], but this was a provoked pause and cardiopulmonary resuscitation was commenced so this cannot truly be described as spontaneous recovery of rhythm. Another consideration here was of artefact, a recognized issue with loop recorders [10]. However, the patient’s clinical picture was consistent with the observed pause, she had not been undertaking any activity that might have produced an artefactual pause, and the fact she had another witnessed pause of 20 seconds in the hospital confirm that the observed pause was real.

No cause was identified for her pauses. However, she did not have tilt-table testing, electrophysiological studies or cardiac MRI scanning prior to pacemaker insertion; regardless, management would still have involved pacemaker insertion. This case reports one of the longest documented episodes of asystole with spontaneous recovery and provides a very graphic reminder of the utility of internal loop recorders in the investigation of syncope.

References

  1. Maggi R, Rafanelli M, Ceccofiglio A, Solari D, Brignole M, et al. (2014) Additional diagnostic value of implantable loop recorder in patients with initial diagnosis of real or apparent transient loss of consciousness of uncertain origin. Europace 16: 1226–1230. [Crossref]
  2. Varosy PD, Chen LY, Miller AL, Noseworthy PA, Slotwiner DJ, et al. (2017) Pacing as a Treatment for Reflex-Mediated (Vasovagal, Situational, or Carotid Sinus Hypersensitivity) Syncope: A Systematic Review for the 2017 ACC/AHA/HRS Guideline for the Evaluation and Management of Patients With Syncope: A Report of the American College of Cardiology/American Heart Association Task Force on Clinical Practice Guidelines and the Heart Rhythm Society. J Am Coll Cardiol 70: 664–679. [Crossref]
  3. European Society of C, European Heart Rhythm A, Brignole M, Auricchio A, Baron-Esquivias G, et al. (2013) 2013 ESC guidelines on cardiac pacing and cardiac resynchronization therapy: the task force on cardiac pacing and resynchronization therapy of the European Society of Cardiology (ESC). Developed in collaboration with the European Heart Rhythm Association (EHRA). Europace 15: 1070–1118. [Crossref]
  4. Mairesse GH, Marchand B (2003) Prolonged asymptomatic sinus pause indicated by implantable loop recording. Heart 89: 244. [Crossref]
  5. Zaidi A, Clough P, Mawer G, Fitzpatrick A (1999) Accurate diagnosis of convulsive syncope: role of an implantable subcutaneous ECG monitor. Seizure 8: 184–186. [Crossref]
  6. Deharo JC, Jego C, Lanteaume A, Djiane P (2006) An implantable loop recorder study of highly symptomatic vasovagal patients: the heart rhythm observed during a spontaneous syncope is identical to the recurrent syncope but not correlated with the head-up tilt test or adenosine triphosphate test. J Am Coll Cardiol 47: 587–593. [Crossref]
  7. Menozzi C, Brignole M, Garcia-Civera R, Moya A, Botto G, et al. (2002) Mechanism of syncope in patients with heart disease and negative electrophysiologic test. Circulation 105: 2741–2745.
  8. Kanjwal K, Karabin B, Kanjwal Y, Grubb BP (2010) A case of mistaken identity: asystole causing convulsions identified using implantable loop recorder. Int J Med Sci 7: 209–212.
  9. Leftheriotis DI, Theodorakis GN, Kremastinos DT (2003) Prolonged asystole during head-up tilt testing with clomipramine infusion. Europace 5: 313–315. [Crossref]
  10. Ali H, Sorgente A, Daleffe E, Cappato R (2014) Asystole detected by implantable loop recorders: true or false? Ann Noninvasive Electrocardiol 19: 595–597. [Crossref]
JDMR 2020-301_Savina Gupta_f2

Bladder Necrosis Due to Septic Shock

Abstract

Background: Chronic constipation leading to fecal impaction and stercoral perforation is an important cause of morbidity and mortality in the aging population. Gangrenous cystitis, an even more rare entity, previously reported primarily in obstetric cases, has not been reported in association with stercoral perforation until this report.

Summary: This case report details the clinical presentation and treatment of a 61-year-old female with history of end-stage renal disease and history of kidney transplantation who presented in septic shock with a positive urinalysis. She underwent an emergent computed topography scan of the abdomen and pelvis which demonstrated a perforation originating from the sigmoid colon. Damage control surgery was performed, the sigmoid colon was resected, and the intestine was left in discontinuity. The abdomen was left open with a temporary abdominal dressing and a catheter for direct peritoneal resuscitation. She returned for a “second look” laparotomy where ischemic bladder tissue was noted. A partial cystectomy was performed, and the bladder was reconstructed over a Foley catheter and her abdomen remained open for continued direct peritoneal resuscitation. Ultimately, the
family determined that this level of care was not consistent with the patient’s wishes and she was made comfort measures.

Conclusion: This is the first report of stercoral perforation of the sigmoid colon in association with gangrenous cystitis in the literature. This case report highlights the importance of a thorough evaluation of the pelvis during surgical management of stercoral perforation so as not to miss concurrent gangrenous cystitis.

Keywords

sepsis, sterocoral perforation, gangrenous cystitis

Introduction

Gangrenous cystitis is a rare condition that has only been reported in the literature a total of 240 times worldwide since 1934. It was once seen in obstetric cases, associated with labor and delivery, but is now most commonly secondary to pelvic radiation/surgery, chemotherapeutic agents, urinary retention, urosepsis, pelvic thrombophlebitis, and colovesical fistulae. The pathogenesis is unknown but is thought to be initiated by bladder ischemia that is then subject to microbial superinfection [1] . Fecal impaction secondary to chronic constipation can lead to Stercoral Perforation (SP) through pressure necrosis of the large bowel [2]. SP is a well-defined entity in the literature that is associated with significant morbidity and mortality and has also been associated with a prior history of renal transplantation [3]. This case report is the first to identify SP of sigmoid colon as a cause of gangrenous cystitis.

Case History/Examination

The patient is a 61-year-old female with a history of End Stage Renal Disease (ESRD) and remote kidney transplantation, with recent admission to the hospital for intertrochanteric fracture after fall. She was subsequently discharged to a rehab facility after a surgical repair of the fracture. The patient presented to our hospital two weeks later in septic shock. On physical examination she had an altered mental status, she was in respiratory distress, and profoundly hypotensive. The abdominal examination was remarkable for a soft but distended abdomen and a palpable transplant kidney in the right lower quadrant with no peritoneal signs.

Investigations and Treatment

White blood cell count was 11,000 with 94% neutrophils and serum lactate was found to be 6.1 cells per cubic millimeter of blood. A Urinalysis (UA) was grossly positive Urinary Tract Infection (UTI) so the patient was transferred to the Medical Intensive Care Unit (ICU) for suspected urosepsis. The patient was intubated and fluid resuscitation along with empiric broad spectrum antibiotics were initiated. An emergent Computed Tomography (CT) scan of the abdomen and pelvis was obtained and showed radiological evidence of perforated viscous, most likely from the sigmoid colon (Figure 1).

SRR 20 - 101_Joshua A Bloom_F1

Figure 1. CT scan of the abdomen and pelvis showing significant stranding and multiple locules of air outside the bowel lumen in the left lower quadrant adjacent to the sigmoid colon and along the left paracolic gutter.

An emergent surgical consult was obtained and the patient was taken immediately to the operating room for exploratory laparotomy. Upon entry to the abdomen, there was foul smelling, turbid fluid and an ischemic, dilated proximal sigmoid colon was encountered. A stercoral perforation of the sigmoid colon on the mesenteric border into the retroperitoneum was noted. The left side of the retroperitoneum had a large amount of necrotic tissue extending into the pelvis.

A damage control surgery was performed. The sigmoid colon was resected, and the intestine was left in discontinuity. The left side of the retroperitoneum and pelvis were opened, and debridement of the necrotic retroperitoneal tissue was performed. A 19 Fr blake drain was placed intra peritoneally for direct peritoneal resuscitation [4, 5]. At the end of the case, the patient was transferred to the Surgical ICU for further resuscitation and correction of metabolic abnormalities.

Postoperatively, the patient’s hemodynamics improved transiently, and vasopressor requirement did decrease somewhat but her serum lactate level continued to rise. With a new elevation of serum lactate the patient was taken to the operating room for a “second look” laparotomy approximately 24 hours later. No further bowel ischemia or necrosis was noted. There was still a significant amount of retroperitoneal necrotic tissue, especially in the pelvis. Further dissection into the pelvis did reveal a 7 cm cystostomy with ischemic bladder tissue mostly on the left side with clear demarcation of ischemic changes. There was some ischemia of the right side of the bladder as well. A Urology and Transplant Surgery consultation were obtained due her history of kidney transplant.

Outcome and Follow-Up

A multidisciplinary discussion resulted in the decision to perform a partial cystectomy and not explant the donor kidney. All of the obvious necrotic tissue was then resected, and the bladder was reconstructed over a Foley catheter. Afterwards, since the patient still was in a profound state of shock, the patient’s bowel was left in discontinuity, the abdomen was temporarily closed, and the patient was transferred back to the Surgical ICU for further management.

The next day the patient underwent a planned relaparotomy with abdominal wash out and temporary abdominal closure. No further areas of bowel or bladder necrosis were noted. Due to the patient’s extensive comorbidities and lack of improvement over the following 48 hours as well as the extent of the care she would continue to require, the family felt this was not consistent with her wishes and elected to make her comfort measures. The patient passed away shortly thereafter.

Discussion

This is the first case report of bladder necrosis due to stercoral perforation of the sigmoid colon. With no literature to guide us, it is difficult to make absolute conclusions, but we believe that the stercoral perforation into the retroperitoneum led to an inflammatory reaction and local infection around the bladder leading to ischemia and gangrenous cystitis.

In the literature, there are numerous causes of bladder necrosis published, mostly in the pre-antibiotic era. These causes include prolonged labor, pelvic radiation, chemotherapy, urinary retention, urosepsis, and pelvic thrombophlebitis to name a few. In these published cases, the mainstay of treatment has been early antibiotic therapy and surgical treatment with extensive debridement of necrotic bladder and wide drainage [6, 7].

In this case report, we differed from the traditional management in that we performed a damage control laparotomy with temporary abdominal closure and direct peritoneal resuscitation. This strategy allowed for source control in the OR and rapid transfer to the ICU for further resuscitation and correction of metabolic abnormalities. This provided our patient with the best chance of survival. Ultimately, it was her wishes that she would not want to live if she were not guaranteed to return to her former quality of life, and she was made comfort measures. However, we believe that she most likely would have survived this hospitalization had this been in line with her wishes.

Conclusion

Whether this patient’s bladder necrosis was due to her stercoral ulcer or her septic shock remains unclear as the literature is equally vague regarding both topics. However, surgeons should be aware of this phenomenon and while operating on the bowel emergently for perforation, should take the time to assess the pelvis, especially in patients with a grossly positive urinalysis.

Lessons Learned

Stercoral perforation of the sigmoid colon leading to septic shock can be associated with gangrenous cystitis and necessitates a thorough evaluation of the pelvis while operating on this entity.

References

  1. De Rosa A, Amer T, Waraich B, Bello A, Parkinson R (2011) Gangrenous cystitis in a 42-year-old male. BMJ Case Reports  2011: 1–4. [Crossref]
  2. Chakravartty S, Chang A, Nunoo-Mensah V (2013) A systematic review of stercoral perforation. Colorectal Disease 15: 930–935. [Crossref]
  3. Dubinsky I (1996) Stercoral Perforation of the Colon: Case Report and Review of the Literature. Journal of Emergency Medicine 14: 323–325. [Crossref]
  4. Rai R, Sikka P, Aggarwal N, Shankaregowda SA (2015) Gangrenous Cystitis in a Woman Following Vaginal Delievery: An Uncommon Occurrence -A Case Report. Journal of Clinical and Diagnostic Reasearch 9: 13–14.
  5. Smith JW, Neal Garrison R, Matheson PJ, Harbrecht BG, Benns MV, et al. (2014) Adjunctive treatment of abdominal catastrophes and sepsis with direct peritoneal resuscitation: indications for use in acute care surgery. J Trauma Acute Care Surg 77: 393–398 [Crossref]
  6. Hinev A, Anakievski D, Krasnaliev I (2010) Gangrenous Cystitis: Report of a Case and Review of the Literature. Urologia Internationalis 85: 479–481. [Crossref]
  7. Piraprez M, Ben Chehida M, Fillet M (2017) Case Report: Emphysematous cystitis. Red Med Liege 384–387.
Weekly case conference

Bronchoscopy: A not-so-innocent invasive examination

Abstract

Bronchoscopy has for many years been the only invasive examination used to screen for bronchus in real time, remove objects that have entered the airway, healing properties, and finally a sample including missing tissue for biopsy for the right follow up medical evaluation and treatment. The usual examination is performed by a flexible bronchoscope which does not cause much discomfort to the patient and causes few complications, complications such as bleeding, cardiac arrhythmias, fever, pneumonia, death, introduction and exacerbation of infection, etc.

This short research is about to overturn this nice and enjoyable environment that has been created regarding the safety of this invasive examination that will eventually and happily very soon be replaced. The present short research is here to overthrow the benefits of bronchoscopy and present the reality as this has not been presented to patients before undergoing an invasive examination that may not eventually need to be done.

Dedication: This short research is dedicated to my Father Panagiotis, who recently died.

Keywords

bronchoscopy, hemoptysis, death, complications, pneumonia

Introduction

Very easily, mainly after a CT scan, a PET/CT has appeared in our lives to improve the quality of imaging data, also including the case but not always the lack of knowledge, recommend that patients undergo an invasive bronchoscopy. that the diagnostic process in short time will end, and the patient is transferred to the next stage of treatment, but if the patient never reaches the treatment stage and is instead hospitalized with complications? according to the literature, it is reported that bronchoscopy is performed by an experienced physician, how can the patient know if the physician is experienced or not?

How can the patient know if during the examination they will not contribute to the examination and trainees which is prohibitive in certain coexisting lung diseases where particular experience is required, such as a patient with bronchectasis, COPD, tec, who they need bronchoscopy from a very experienced physician. Is the procedure is followed of informing the patient prior to bronchoscopy about the pros and cons of the examination as well as their complications? Finally, is it worth doing a bronchoscopy which, depending on the clinical picture of the patient, may eventually have the opposite effect? bronchoscopy is not for everyone.

Analysis

Bronchoscopy is an invasive examination performed in public and private hospitals as well as in private diagnostic centers and clinics. Before conducting the examination blood tests are performed, including blood and cardiology tests, so, how many tests for a diagnostic examination that is considered safe? The complications that it presents contradict the advantages, advantages that in cases depending on the severity of the patient are disadvantages.

Advantages that become disadvantages when one of the following reasons are met.

  1. Inexperienced Invasive physician
  2. Bronchoscopy by trainees (depends on case).
  3. Inexperienced staff.
  4. Hygiene conditions.
  5. Disinfection, cleaning, and sterilization of a bronchoscope.
  6. The clinical picture of the patient.
  7. Consideration of medical examinations to avoid bronchoscopy.
  8. Inform the patient about the complications of bronchoscopy.

When one or more of the above is not observed, then the patient is at high risk, as the complications of the bronchoscopy examination can cause the patient even more serious damage than the disease itself led the patient to bronchoscopy. What safe examination are they talking about?

Is there a mortality rate of about 0.5% these patients were aware of the complications? Should they have done bronchoscopy? have the hygiene rules been adhered to or fallen into a category of the above 8 listed? Although international literature indicates guidelines for safe bronchoscopy examinations, does the patient know whether the guidelines are being followed?

One of the major complications of bronchoscopy is bleeding, ranges for example from low 10ml to 150ml which is very high. It is a serious complication that needs to be addressed immediately since its origin is complex, it can come from many areas such as pulmonary capillaries, pulmonary arteries, pulmonary veins, and finally large thoracic vessels. Bleeding is directly related to the biopsy, in most cases bronchoscopy is performed to obtain a biopsy, an experienced physician in a burdensome patient with a history who knows before, noted here the bronchoscopy requires the patient to hold already a CT, which will require a CT scan. is the one who will judge it must be done, if it is to be done, to pay attention, what requires observation, coexisted, possible complications, time of examination in relation to the severity of the patient, the participation of trainees or not, and how to get a sample.

There are two types of sample deficiencies: endobronchial and transobronchial biopsy, transobronchial biopsy causes the patient and most bleeding, here is a big question, in patients with bronchiectasis, or similar medical cases that usually occur in these medical cases colonies and bacteria such as pseudomonas aeruginosa that are usually resistant to antibiotics, a transobronchial biopsy is responsible for burdening the patient’s clinical picture? Thus, correlated the bleeding with the number of biopsies and how they were obtained. Considering the fact that patients with congenital diseases, medicines that are taken for various important reasons, a bleeding can reach or exceed 40% depending on the case of patients undergoing bronchoscopy. So why should they do a bronchoscopy? The treating physician should be able to judge the overall picture of the patient in order to be able to make a correct diagnosis, taking into account patients with a poor medical history considering the negative aspects of a bronchoscopy, however, bronchoscopy is an invasive risk examination depending on the patient’s physical condition and medical history. Bronchoscopy examination is not for everyone.

It is concluded that the bleeding of the patient after bronchoscopy implies with further clinical progress, although the incidence of sudden death is small as has been mentioned above. Small bleeding can be easily treated large bleeding to stop may require laser and even surgery, the patient must consider all options and exhaust all parameters. It is worth considering whether it is worth the effort, pain and risk to perform a bronchoscopy examination that no one can guarantee his or her physical situation after the examination is completed.

Most complications that have occurred during the examination or thereafter have to do with how to obtain and receive biopsy material. Such cases are brushes that have broken down or have not worked properly. Continuous aspiration during the examination may lead to hypoxemia and atelectasis. Pseudomonas aeruginosa is the most frequently transmitted organism from an inappropriate bronchoscope (see above 8 reasons) which has not been properly disinfected and cannot be used. Using such a bronchoscope is a criminal act against the patient. During bronchoscopy, patients have been observed to have increased blood pressure and increased heart rate, this is due to increased oxygen demand from the myocardium which may then lead the patient to arrhythmias and ischemia. Cardiac arrhythmias that occur after bronchoscopy confess hypoxemia. Particularly in COPD patients with hypercapnia hypoxia is contraindicated for flexible bronchoscopy. It is worth noting at this point that complications of bronchoscopy often occur when there are concomitant diseases such as pneumonia or tumor, as well as the type of forceps to be used, that is toothed or non-serrated forceps. In patients with chronic bronchiectasis, the physician should consider all indications for the overall picture of the patient and whether or not to perform the bronchoscopy. It is the physician that will analyze the patient’s respiratory function and the degree of criticality. It should also be borne in mind that some patients with infections will need antibiotics after bronchoscopy, these patients likely to need antibiotics that will be able to deal with germs and bacteria that are resistant. These patients are more likely to develop febrile episodes as well as critical respiratory function.

The physician is solely responsible for analyzing the pros and cons, it is the one who weighs the benefit of the risk. Patients with bronchiectasis should not be bronchoscopied by trainees or by physicians who rarely perform bronchoscopy. When these patients show haemoptysis, the detection of bleeding is crucial. Finally, bronchoscopy in COPD patients is particularly burdensome compared to non-COPD patients, COPD patients should be evaluated on the findings of their clinical trials together with medical evacuation before performing the bronchoscopy. Assessment of potential advantages over advantages must be evaluated.

Conclusion

Bronchoscopy is a conditional safe examination when all safety rules are met, medical evaluation is performed separately for each patient, each patient is different. Bronchoscopy is not for all patients, generally described as a safe invasive examination but with so many complications that there are people who have had a bronchoscopy and have not returned home, is this safe medical examination they say? it is not a safe medical examination, it is a safe conditional examination, evaluating the clinical picture of the patient in combination with the degree of experience of the physician and the clinical picture of the patient judging its effectiveness.

Patients with co-existing health problems should be assessed for the advantages of screening in conjunction with screening complications. Physicians should not be dragged into the altar of the rapid effect of detecting the problem by undergoing bronchoscopy in patients who are not allowed to do a bronchoscopy based on physical or medical pre-existing health conditions. It is a medical examination with uncertain complications sometimes simple, sometimes heavy and sometimes deadly.

Classical bronchoscopy has begun to come to a second myrrh as soon as virtual bronchoscopy is implemented and thus the complications of classical bronchoscopy will be eliminated. Bronchoscopy should be chosen as a medical examination after all other medical examinations and methods have been utilized and under conditions based on the clinical picture of the patient, in strict compliance with the hygiene guidelines.

References

  1. Kovaleva J, Peters FT, van der Mei HC, Degener JE (2013) Transmission of infection by flexible gastrointestinal endoscopy and bronchoscopy. Clin Microbiol Rev 26: 231–254. [Crossref]
  2. Pereira W Jr, Kovnat DM, Snider GL (1978) A prospective cooperative study of complications following flexible fiberoptic bronchoscopy. Chest 73: 813–816. [Crossref]
  3. Kreider ME, Lipson DA (2003) Bronchoscopy for atelectasis in the ICU: a case report and review of the literature. Chest 124: 344–350. [Crossref]
  4. Trouillet JL, Guiguet M, Gibert C, Fagon JY, Dreyfuss D, et al. (1990) Fiberoptic bronchoscopy in ventilated patients. Evaluation of cardiopulmonary risk under midazolam sedation. Chest 97: 927–933. [Crossref]
  5. Hanson RR, Zavala DC, Rhodes ML, Keim LW, Smith JD (1976) Transbronchial biopsy via flexible fiberoptic bronchoscope; results in 164 patients. Am Rev Respir Dis 114: 67–72. [Crossref]
  6. Da Conceiçao M, Genco G, Favier JC, Bidallier I, Pitti R (2000) Fiberoptic bronchoscopy during noninvasive positive-pressure ventilation in patients with chronic obstructive lung disease with hypoxemia and hypercapnia. Ann Fr Anesth Reanim 19: 231–236. [Crossref]
JDMR 2020-301_Savina Gupta_f5

Relationship between polycystic ovarian syndrome (PCOS) and fatty liver disease

Abstract

Background – Polycystic ovarian syndrome (PCOS) and fatty liver disease are considered to be off-shoots of insulin resistance. However, the link between the two disorders have recently been found to be variable.

Objective – To explore the association of fatty liver disease with PCOS and to model the association of hyperandrogenism, obesity and insulin resistance indices among subjects with or without PCOS and fatty liver disease.

Methodology – This study was carried out between Jan-2018 to Aug-2019 at PNS HAFEEZ hospital. Odds ratio (OR) for having PCOS with fatty liver disease were calculated. We utilized general linear model (GLM) by keeping hyperandrogenism, abdominal volume index (AVI) and insulin resistance as dependent variables against PCOS and fatty liver disease as independent factors.

Results – OR for having PCOS in subjects with fatty liver disease was 1.34(95%CI: 1.34(0.868-2.065). Using Free Androgen Index(FAI) as dependent variable and fatty liver and PCOS as fixed factors in a GLM analysis, the group wise differences are depicted as: Group-1: No Fatty liver+No PCOS=2.37(+1.30),n=97), Group-2: No PCOS+Fatty Liver=3.35(+2.23),n=66), Group-3: PCOS+No Fatty Liver=6.08(+5.05),n=88), and Group-4: PCOS+Fatty Liver=6.83(+4.70),n=80).(p<0.001). Abdominal obesity was not associated with PCOS (p=0.980), but was significantly associated with fatty liver disease (p<0.001).

Conclusion – Presence of fatty liver disease in females can lead to slightly higher frequency of PCOS. Biochemical and clinical hyperandrogenism were associated with presence of PCOS, while abdominal obesity and insulin resistance were linked with fatty liver disease.

Keywords

Polycystic ovarian syndrome (PCOS), free androgen index (FAI), modified Ferriman-Gallwey score (mFG score), fatty liver and Rotterdam PCOS criteria.

Background

Lipids are considered as the mainstream culprits in pathogenesis of development of polycystic ovarian syndrome (PCOS) and fatty liver disease. [1, 2] Therefore the probability based upon the famous “Common Soil Hypothesis” dealing in directly with metabolic syndrome suggest a common linkage between the two pathogenic disorders. [3] Both PCOS and Fatty liver disease amounts to multiple complications. PCOS has been shown to result in hirsutism and reproductive issues. [4], while fatty liver disease is associated with acceleration liver damage leading to cirrhosis and hepatocellular carcinoma (HCC). [5]

While the mechanism seems more understandable in terms of extra fat accumulation within liver but some evidence indicates PCOS phenotype variability does allow differential association with fatty liver disease. Macut et al have shown that subjects having higher serum testosterone, a hallmark of PCOS are associated with a two-fold increased risk of fatty liver. [6] Rocha et al in their systematic review from 2007 to 2017 highlighted that prevalence of PCOS with NAFLD remains variable, but the combined presence of PCOS and NAFLD results in higher degree of clinical and biochemical hyperandrogenism than the female subjects only demonstrating PCOS with former category more associated with metabolic derangements. [7] Contrary to that there is evidence where both fatty liver disease and PCOS are associated and attributed to common pathogenesis. The research work by Vassilatou et al have demonstrated that lipid based abnormalities are central to the development of PCOS and NAFLD; however, he categorized data from PCOS patients as either being obese or otherwise. [8] Similarly, Kauffman et al have demonstrated that PCOS and NAFLD can occur due to common pathogenic mechanisms including androgen excess and insulin resistance. [9, 2]

So, the obvious question arises as to how fat accumulation or associated metabolic defects differentially affect the two organs? While PubMed data search indicates both fatty liver disease /NASH/NAFLD and PCOS both being the off-shoots of insulin resistance, [10] still there are both genetic and epigenetic  mechanism at work which can probably change the overall phenotype of metabolic syndrome and related diseases. In this regard a study from Poland had identified GG genotype variation to result in higher frequency of NAFLD in PCOS than PCOS subjects without Cannabinoid Receptor-1 gene polymorphism thus highlighting genetic predilections towards PCOS-fatty liver occurrence. [11] Similarly, Jones et al have identified higher risk of fatty liver disease with hyperandrogenism associated PCOS in comparison to female subjects having reduced hyperandrogenism independent of insulin resistance. [12] Bruce et al by highlighting the concept of “Metabolic Circadian Clock System” have attempted to highlight epigenetic factor from environmental triggers which change the phenotypic presentation of metabolic syndrome, and thus can be interpreted indirectly as the effect of regional effects or ethnic triggers. [13] Another aspect of this is the adipocyte size which has been shown to result in variability in hepatic steatosis [14], which have been smaller but with increase adipocyte area in Asian population than Caucasians and so the affect could be due to specific racial reasons [15]. So racial differences due to variability adipocyte area, genetic factors and epigenetic influences need to be considered and may probably be different in whatever has been observed elsewhere. Based upon these newly emerging evidence a compelling need was therefore felt to learn the association between the PCOS, fatty liver disease and androgenicity which were supposedly to be associated due to common trigger i.e., insulin resistance.

A study is therefore planned to explore the association of fatty liver disease, PCOS and hyperandrogenism by estimating the hirsutism, anthropometric, biochemical and endocrine differences (Free androgen index) between subjects with fatty liver associated PCOS and non-fatty liver PCOS.

Methods

We planned a cross-sectional analysis among reproductive-age female subjects after formal approval of hospital’s ethical review committee of PNS HAFEEZ Hospital. The study involved department of radiology, pathology, obstetrics and gynecology. The duration of study was 18 months from Jan-2018 to Aug-2019. Females in reproductive age post 2 years of menarche were initially included as target population. Patient selection was based non-probability convenience mode of sampling. Females who some acute or chronic conditions including pelvic inflammatory disease, metabolic diseases like hypertension, diabetes and ischemic heart disease, autoimmune disorder, on any medication, fertility treatment, or other unknown drugs were excluded from the study. Subjects who could not complete all testing formalities for any reason were excluded from the study. Finally selected females were formally requested to visit pathology department on 2nd day of menstrual cycle Subjects who finally followed up for study in medical fasting were formally

explained about study design, requirements and were asked to sign a consent form. Further clinical evaluation included history, evaluation of hirsutism as per modified Ferriman-Gallwey scores [16], anthropometric measurements, vital signs measurements and a generalized clinical examination for any signs of chronic disease. They were questioned about duration of menstrual cycle for presence or absence of oligo/anovulation as per criteria utilized by Kollmann et al. [17]

Radiological and laboratory analysis: 10 ml (approx.) of blood was collected for fasting plasma glucose, ALT, HbA1c, total testosterone, Sex Hormone Binding Globulin (SHBG) and serum insulin and lipid profile. Following sample collection, females were requested to go for radiological examination for evaluation of reproductive tract examination for presence or absence of polycystic ovarian syndrome as per Rotterdam criteria [18]

Lab analysis and measurements: Fasting plasma glucose, total cholesterol and triglycerides were measured on Selctra-ProM (Clinical chemistry analyzer) by GPO-PAP, CHOD-PAP and GPO-PAP method. LDL-cholesterol and HDL-cholesterol were measured by direct enzymatic methods using accelerator selective detergent on Selectra-proM. ALT was measured by IFCC method at 370C. Total testosterone, SHBG, glycated hemoglobin were analyzed by using chemiluminescent microparticle Immunoassay (CMIA) on ARCHITECT (iSystem) developed by Abbot Diagnostics. Serum insulin was measured on Chemiluminescence method on Immulite® 1000 analyzer. Internal and National External Quality Assurance Program are in place to monitor inter and intra lab imprecision along with internal QC management for precision and accuracy by documented trouble shooting on instrument generated charts as per Westgards’s standard protocols.

Calculated parameters – Free Androgen Index (FAI) was measured as: FAI = (Total testosterone/SHBG) x 100. FAI > 5%was greater than 5% was termed as biochemical hyperandrogenism as per Al Kindi et al. [19] Homeostasis Model Assessment of Insulin resistance (HOMAIR) was measured using Mathew’s et al mathematical model. [20]

Data analysis – We used SPSS-version 24 for statistical analysis. Age was calculated as per mean and SD by descriptive statistics. Descriptive statistics for frequency of PCOS, hirsutism and fatty liver disease % were calculated for subjects with or without fatty liver disease. Inferential statistics involved calculation of Odds Ratio for presence of PCOS as per Rotterdam criteria in subjects with or without fatty liver disease. We utilized General linear models (GLM) where we evaluated sequentially FAI, mFG scores for hirsutism, abdominal volume index (AVI) and insulin resistance (HOMAIR) as dependent variables against presence or absence of PCOS and fatty liver disease as fixed factors.

Results

Mean age among subjects with Rotterdam defined PCOS was (26.71+ 6.99, n=168) and without PCOS was (29.07+ 8.11, n=163). Similarly subjects who had fatty liver had a mean age of (30.95+7.10, n=146) in comparison to females without fatty liver [25.45+7.17, n=185). 236 females in our data set were married, while 95 were non-married. Hirsutism was diagnosed in 157 females while 174 were having a modified FG score of less than 8. 88/185 (47.57%) of the cases without fatty liver disease were diagnosed with PCOS, while 80/146 (54.79%) of cases diagnosed to have fatty liver disease had PCOS indicating no statistically significant association between presence of PCOS and fatty liver disease in our regional data set. Odds ratio (OR) for having PCOS in subjects with fatty liver disease is 1.34 but not statistically significant. (Table-1)

Table 1. Odds ratio for presence of PCOS as per Rotterdam criteria in subjects with fatty liver disease (p=NS).

PCOS

Odds Ratio

(Rotterdam criteria)

(95 % CI)

NO

YES

Fatty liver diagnosed

Fatty liver not

97

88

185

on ultrasonography

diagnosed

1.34

Fatty liver

66

80

146

(0.868-2.065)

diagnosed

Total

163

168

331

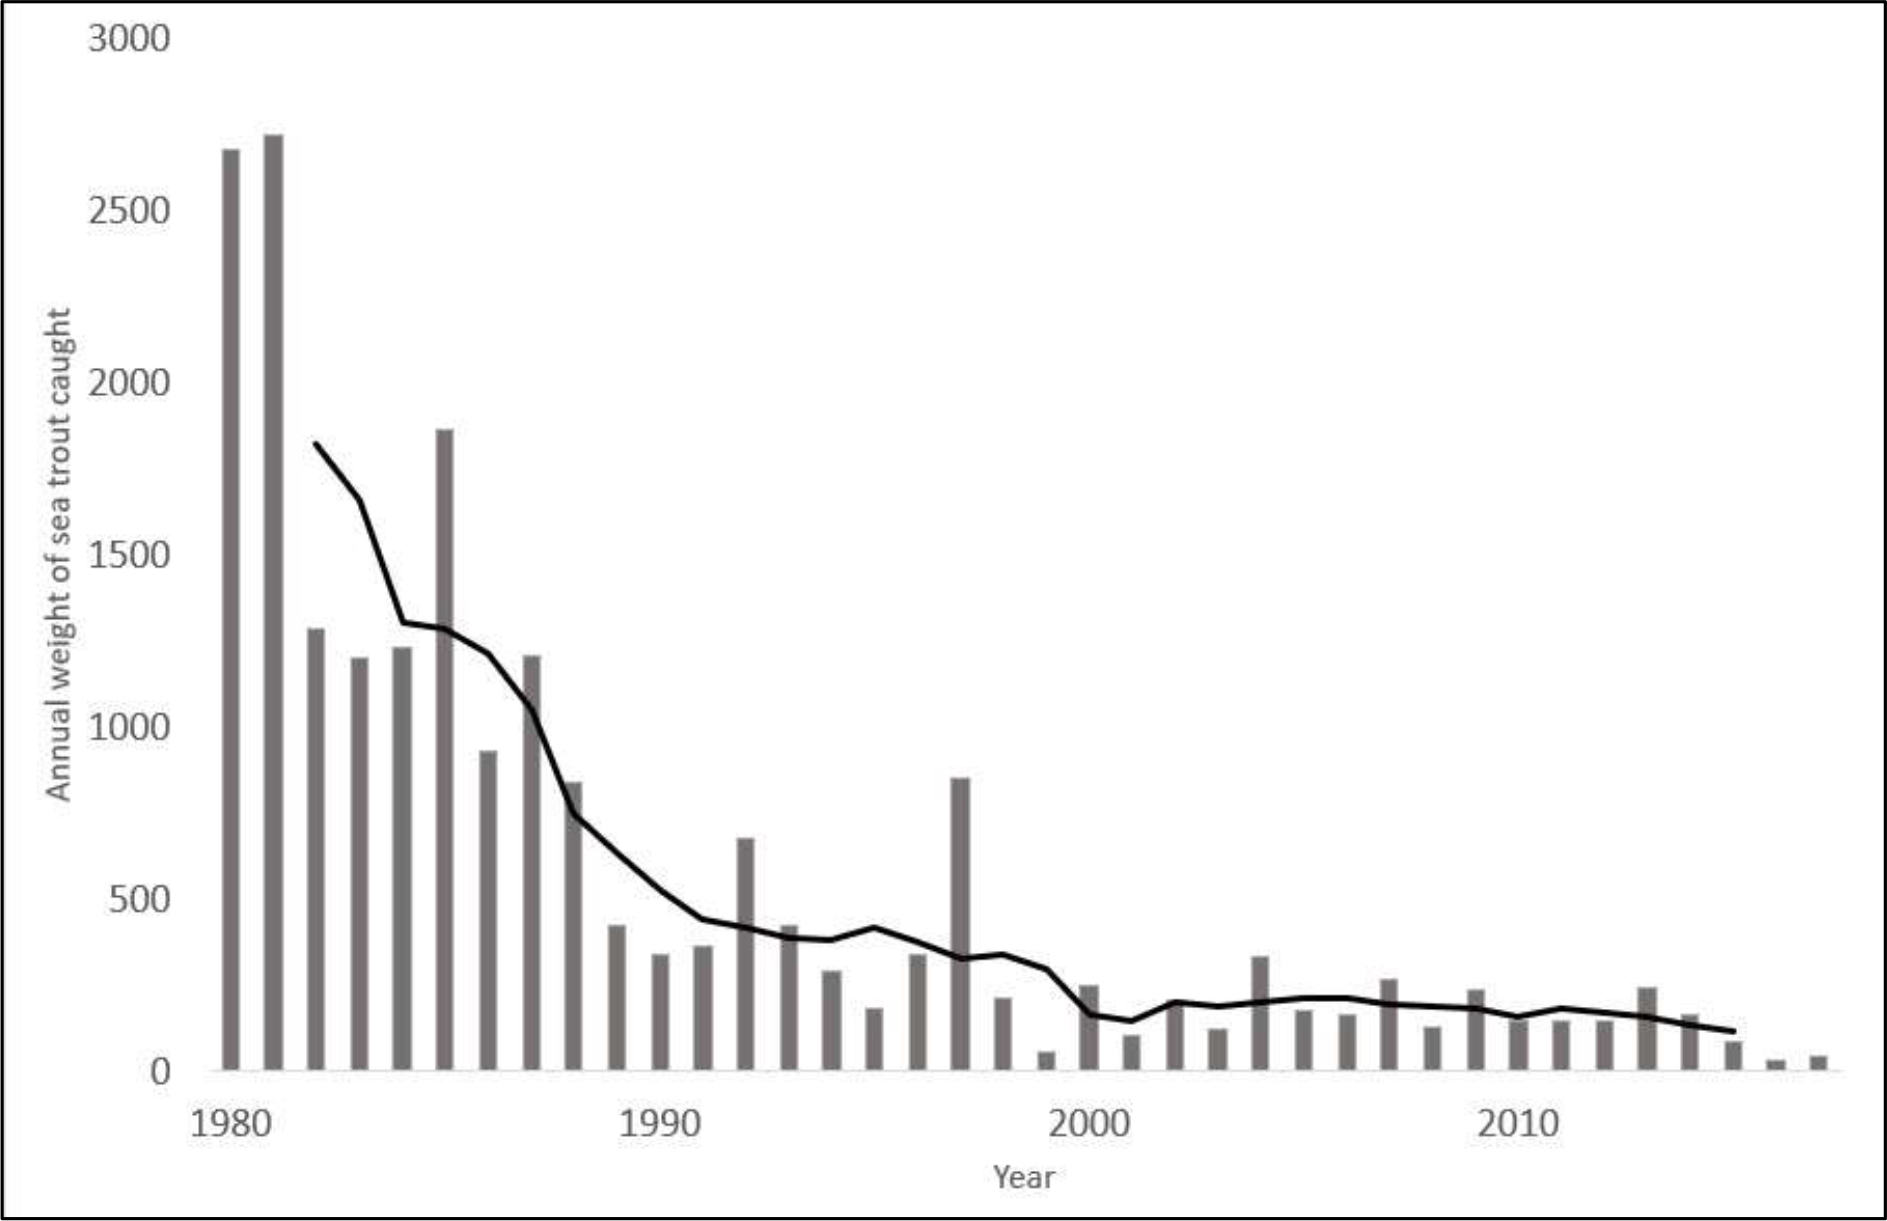
Keeping free androgen index (FAI) as dependent variable with PCOS and fatty liver disease as fixed variables indicates a definite increase in FAI due to presence of PCOS which get slightly worsened with the presence of fatty liver depicted as: Group-1: No Fatty liver + No PCOS= 2.37 (+ 1.30), n=97), Group-2: No PCOS + Fatty Liver = 3.35(+

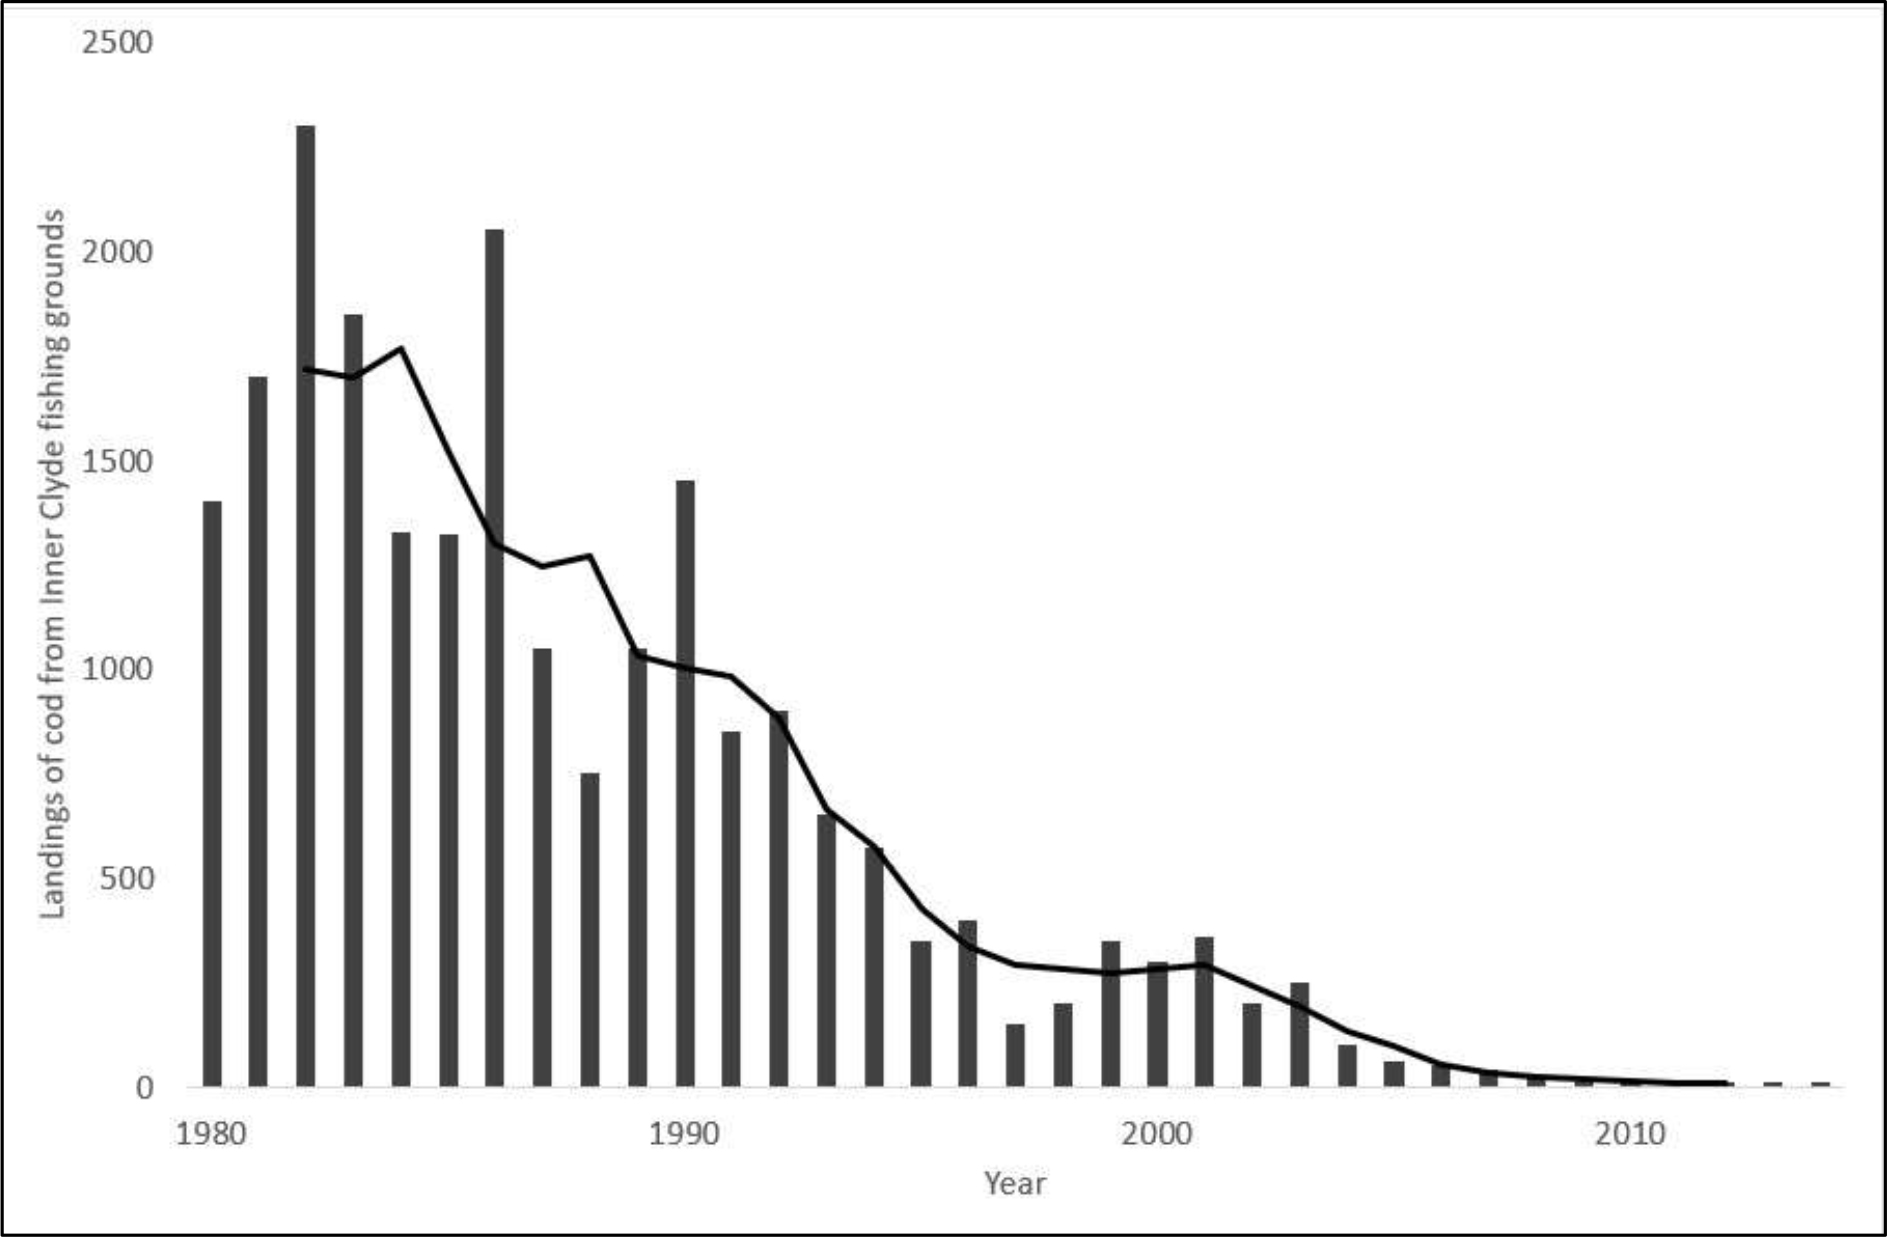
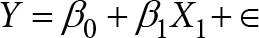
2.23), n=66), Group-3: PCOS + No Fatty Liver = 6.08 (+ 5.05), n=88), and Group-4: PCOS + Fatty Liver = 6.83 (+ 4.70), n=80). Figure-1 shows a General Linear Model (GLM) with FAI being a dependent variable is evaluated against independent variables i.e., presence or absence of PCOS (p<0.001) and fatty liver disease (p=0.035) demonstrating that PCOS presence is more associated with increase in biochemical hyperandrogenism than fatty liver disease. (Overall Model significance<0.001). Similarly, hirsutism as measured by mFG scores was not significantly related to fatty liver disease but was associated with presence of PCOS. [Figure-2] Abdominal Volume Index (AVI) as a measure of abdominal obesity was not associated with PCOS, but was significantly associated with fatty liver disease. [Figure-3] Furthermore, insulin resistance as a dependent variable was seen to rise more with the presence of fatty liver in comparison to PCOS. [Figure-4]

Sikandar EDMJ_f2

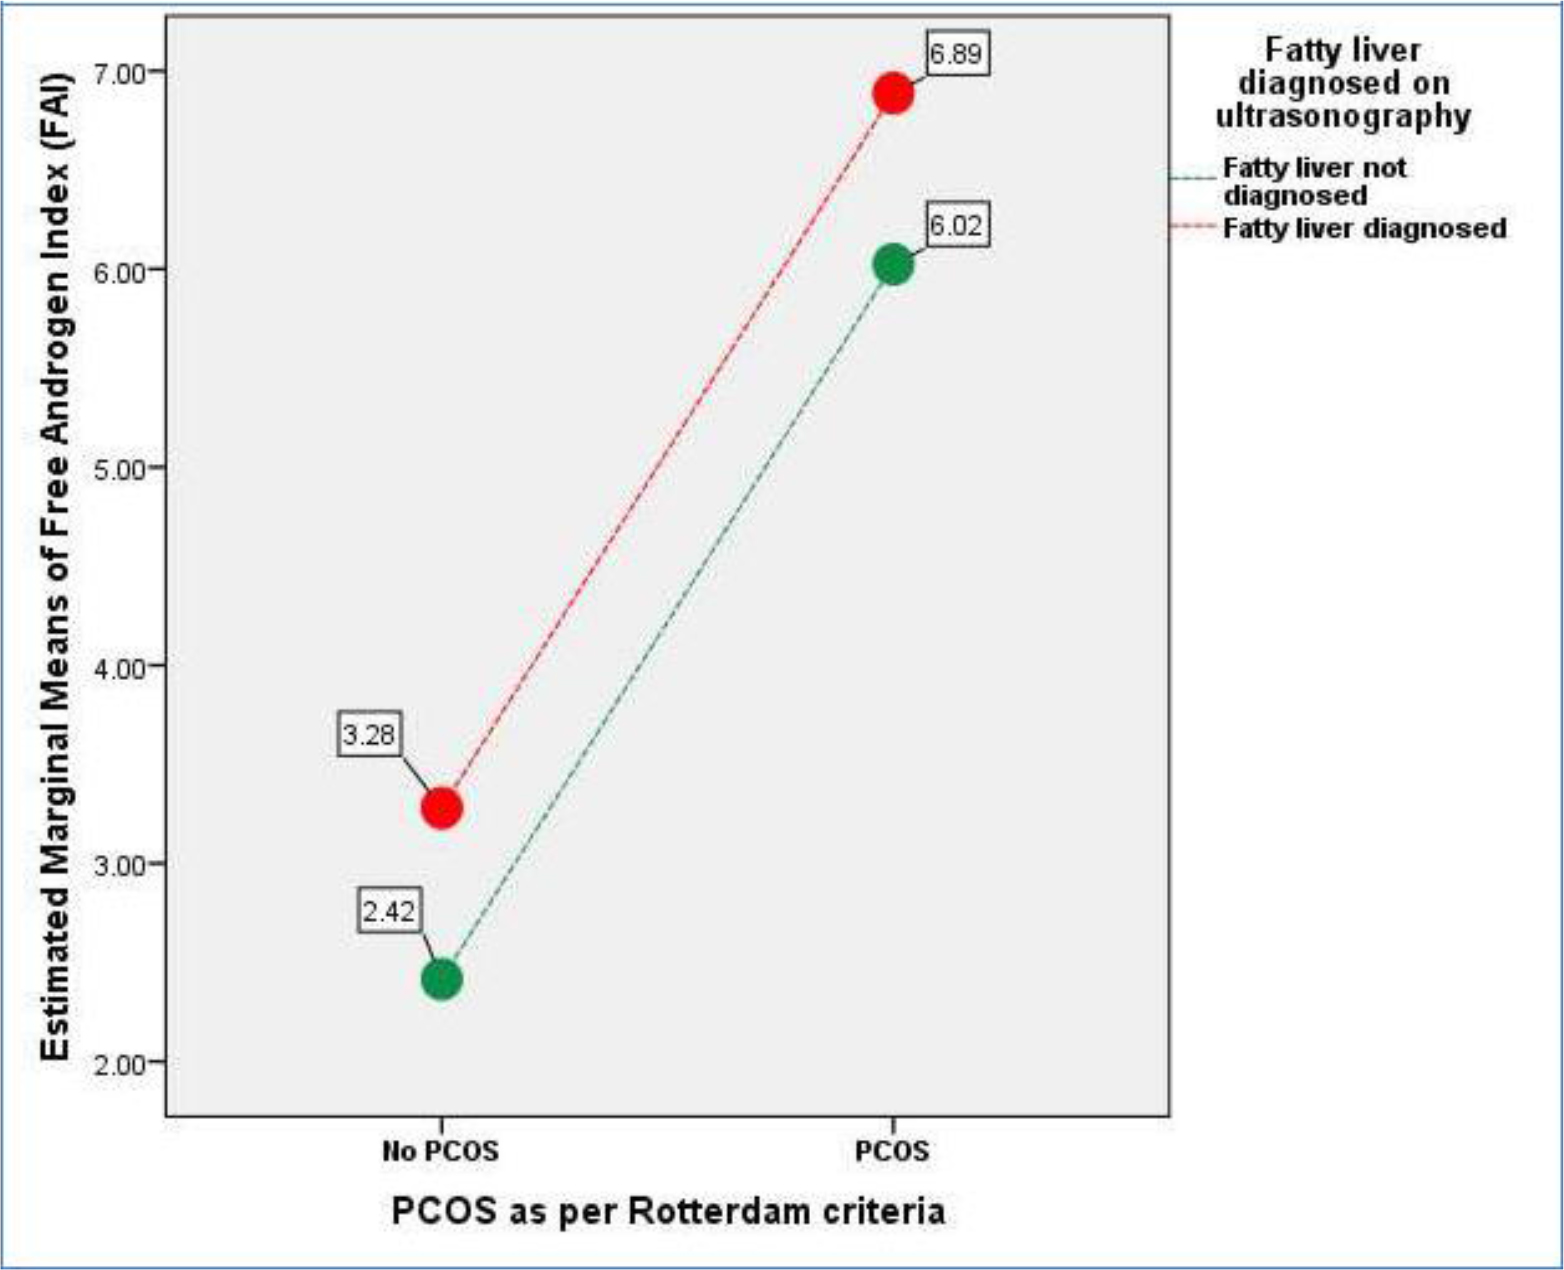
Figure 1. General Linear Model (GLM) where FAI being a dependent variable is evaluated against independent variables i.e., presence or absence of PCOS (p<0.001) and fatty liver disease (p=0.035). (Overall Model significance<0.001).

Sikandar EDMJ_f3

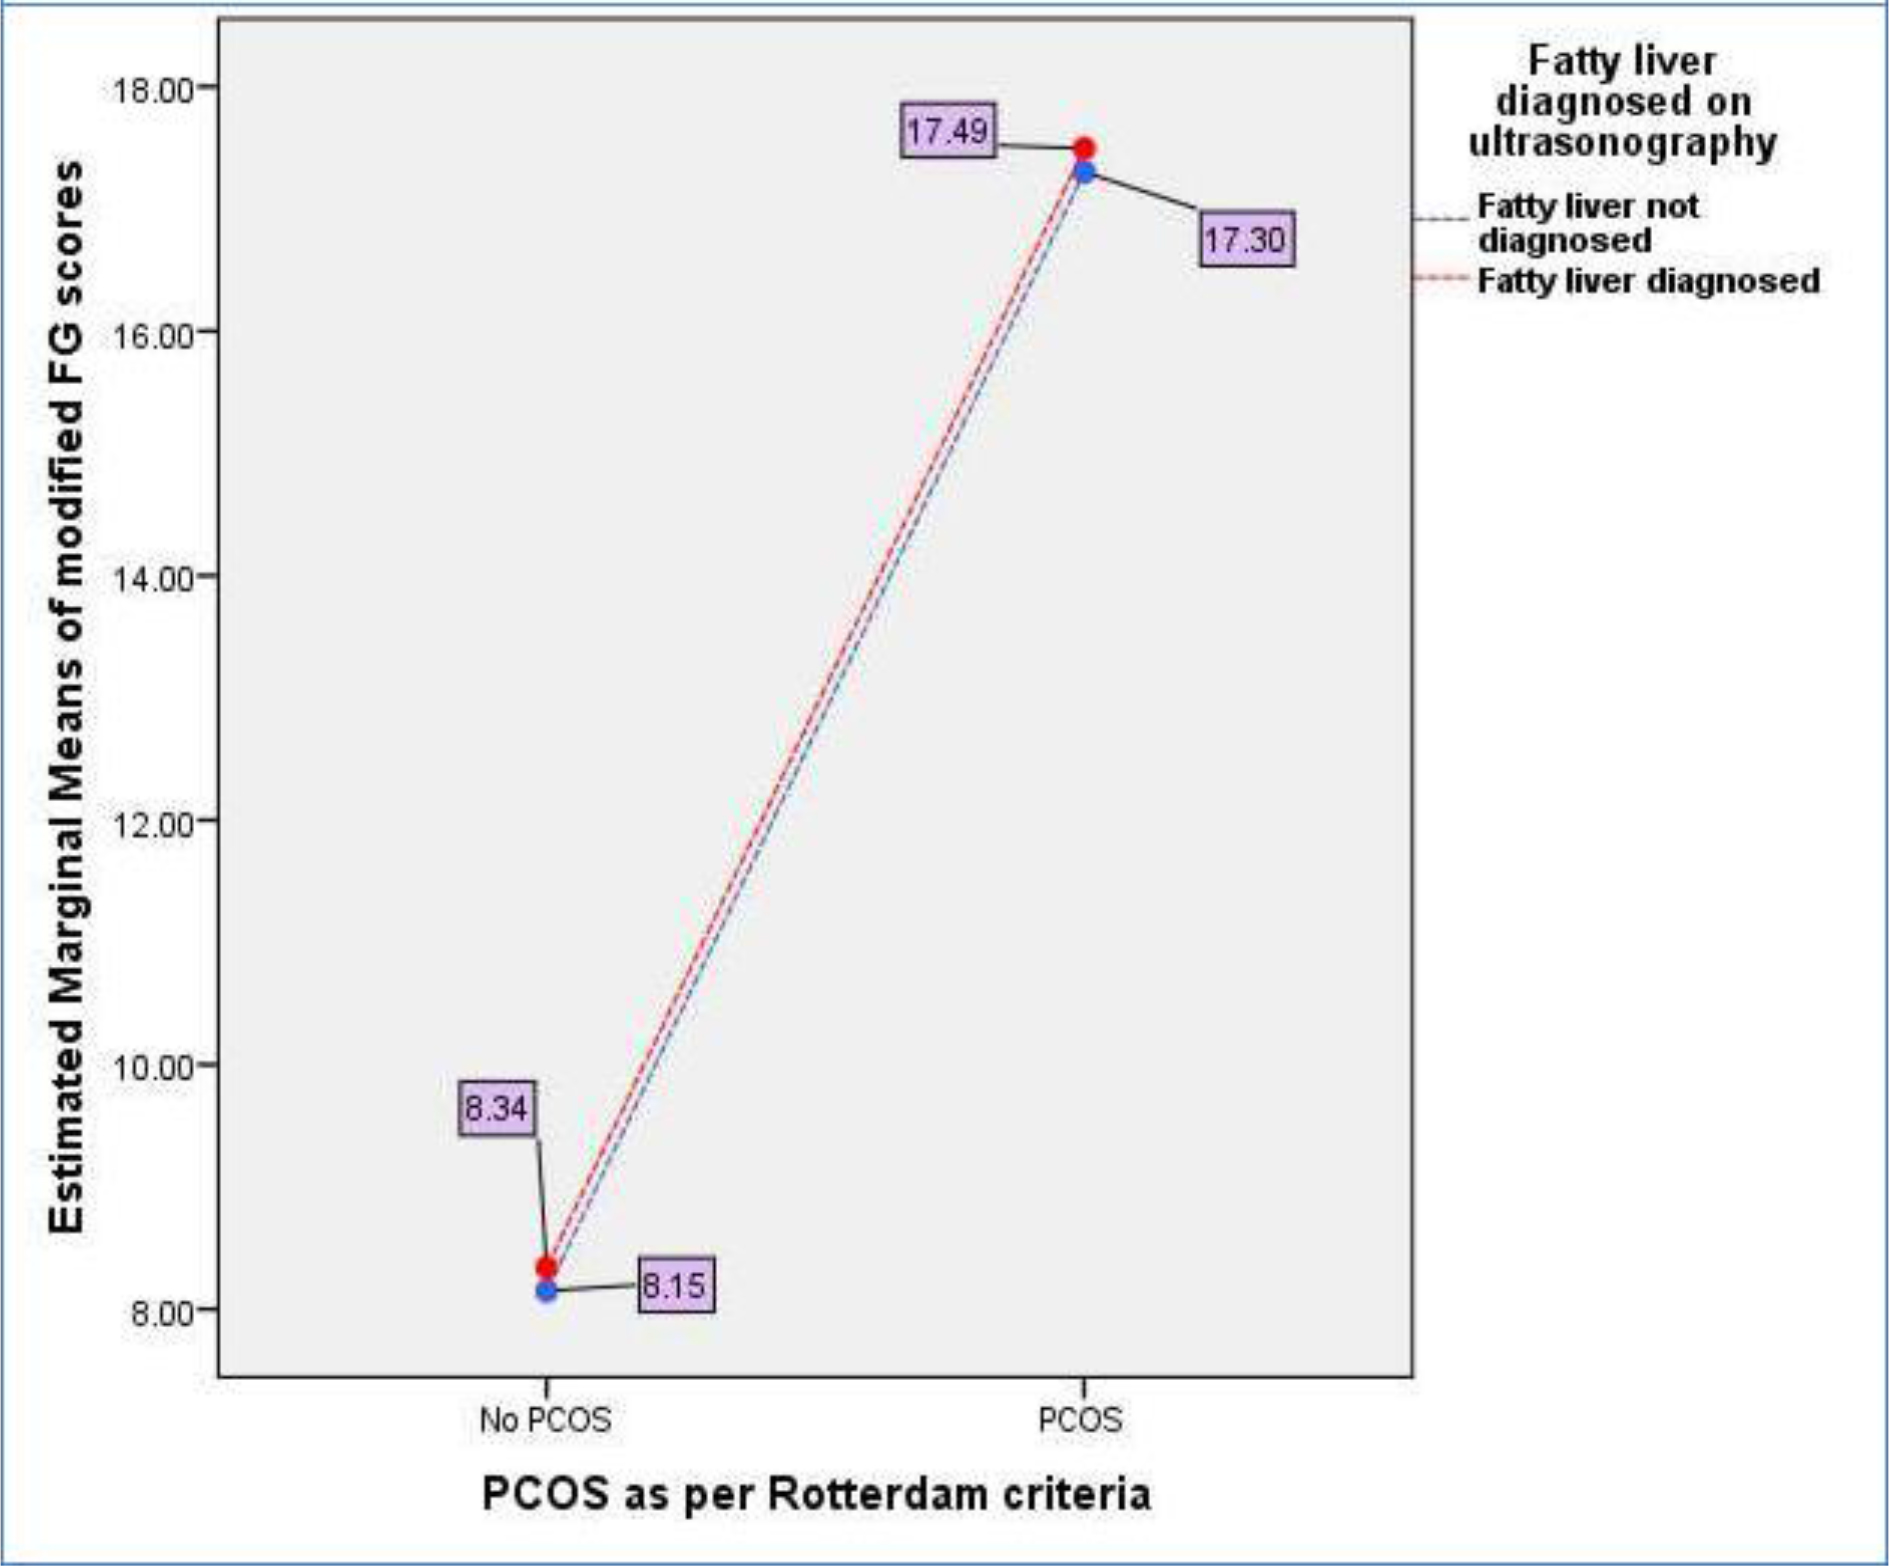
Figure 2. General Linear Model (GLM) where mFG score as surrogate markers for hirsutism being a dependent variable is evaluated against independent variables i.e., presence or absence of PCOS(p <0.001) and fatty liver disease(p=0.820). (Overall Model significance<0.001).

Sikandar EDMJ_f4

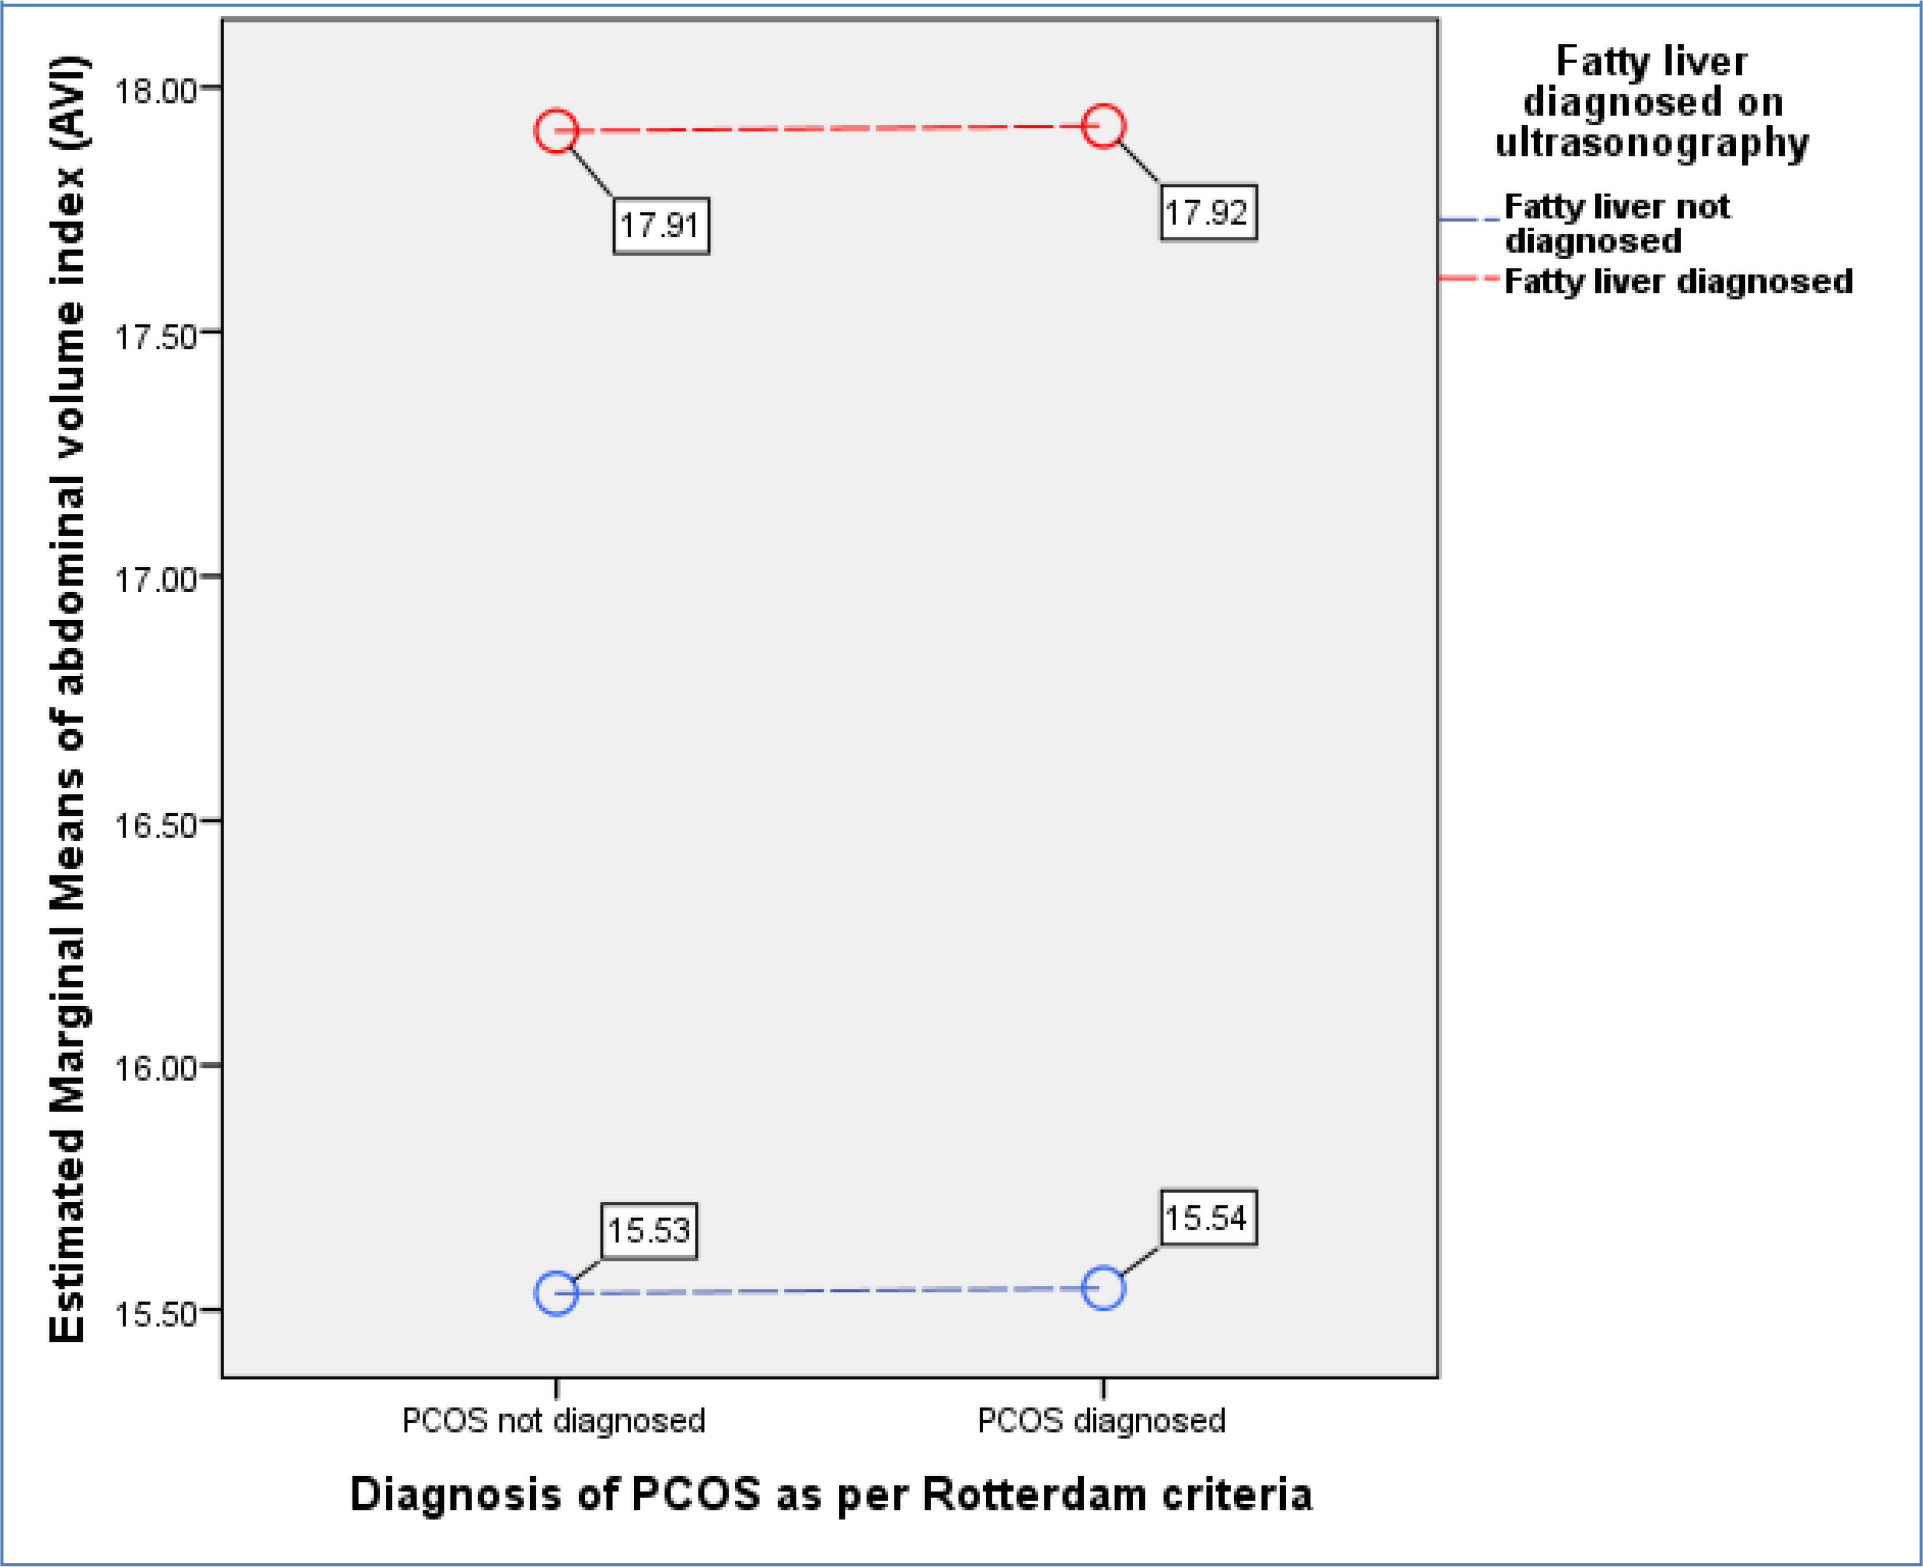
Figure 3. General Linear Model (GLM) where Abdominal Volume Index (AVI) as a marker for abdominal obesity being a dependent variable is evaluated against independent variables i.e., presence or absence of PCOS (p=0.980) and fatty liver disease (p<0.001). (Overall Model significance<0.001).

Sikandar EDMJ_f5

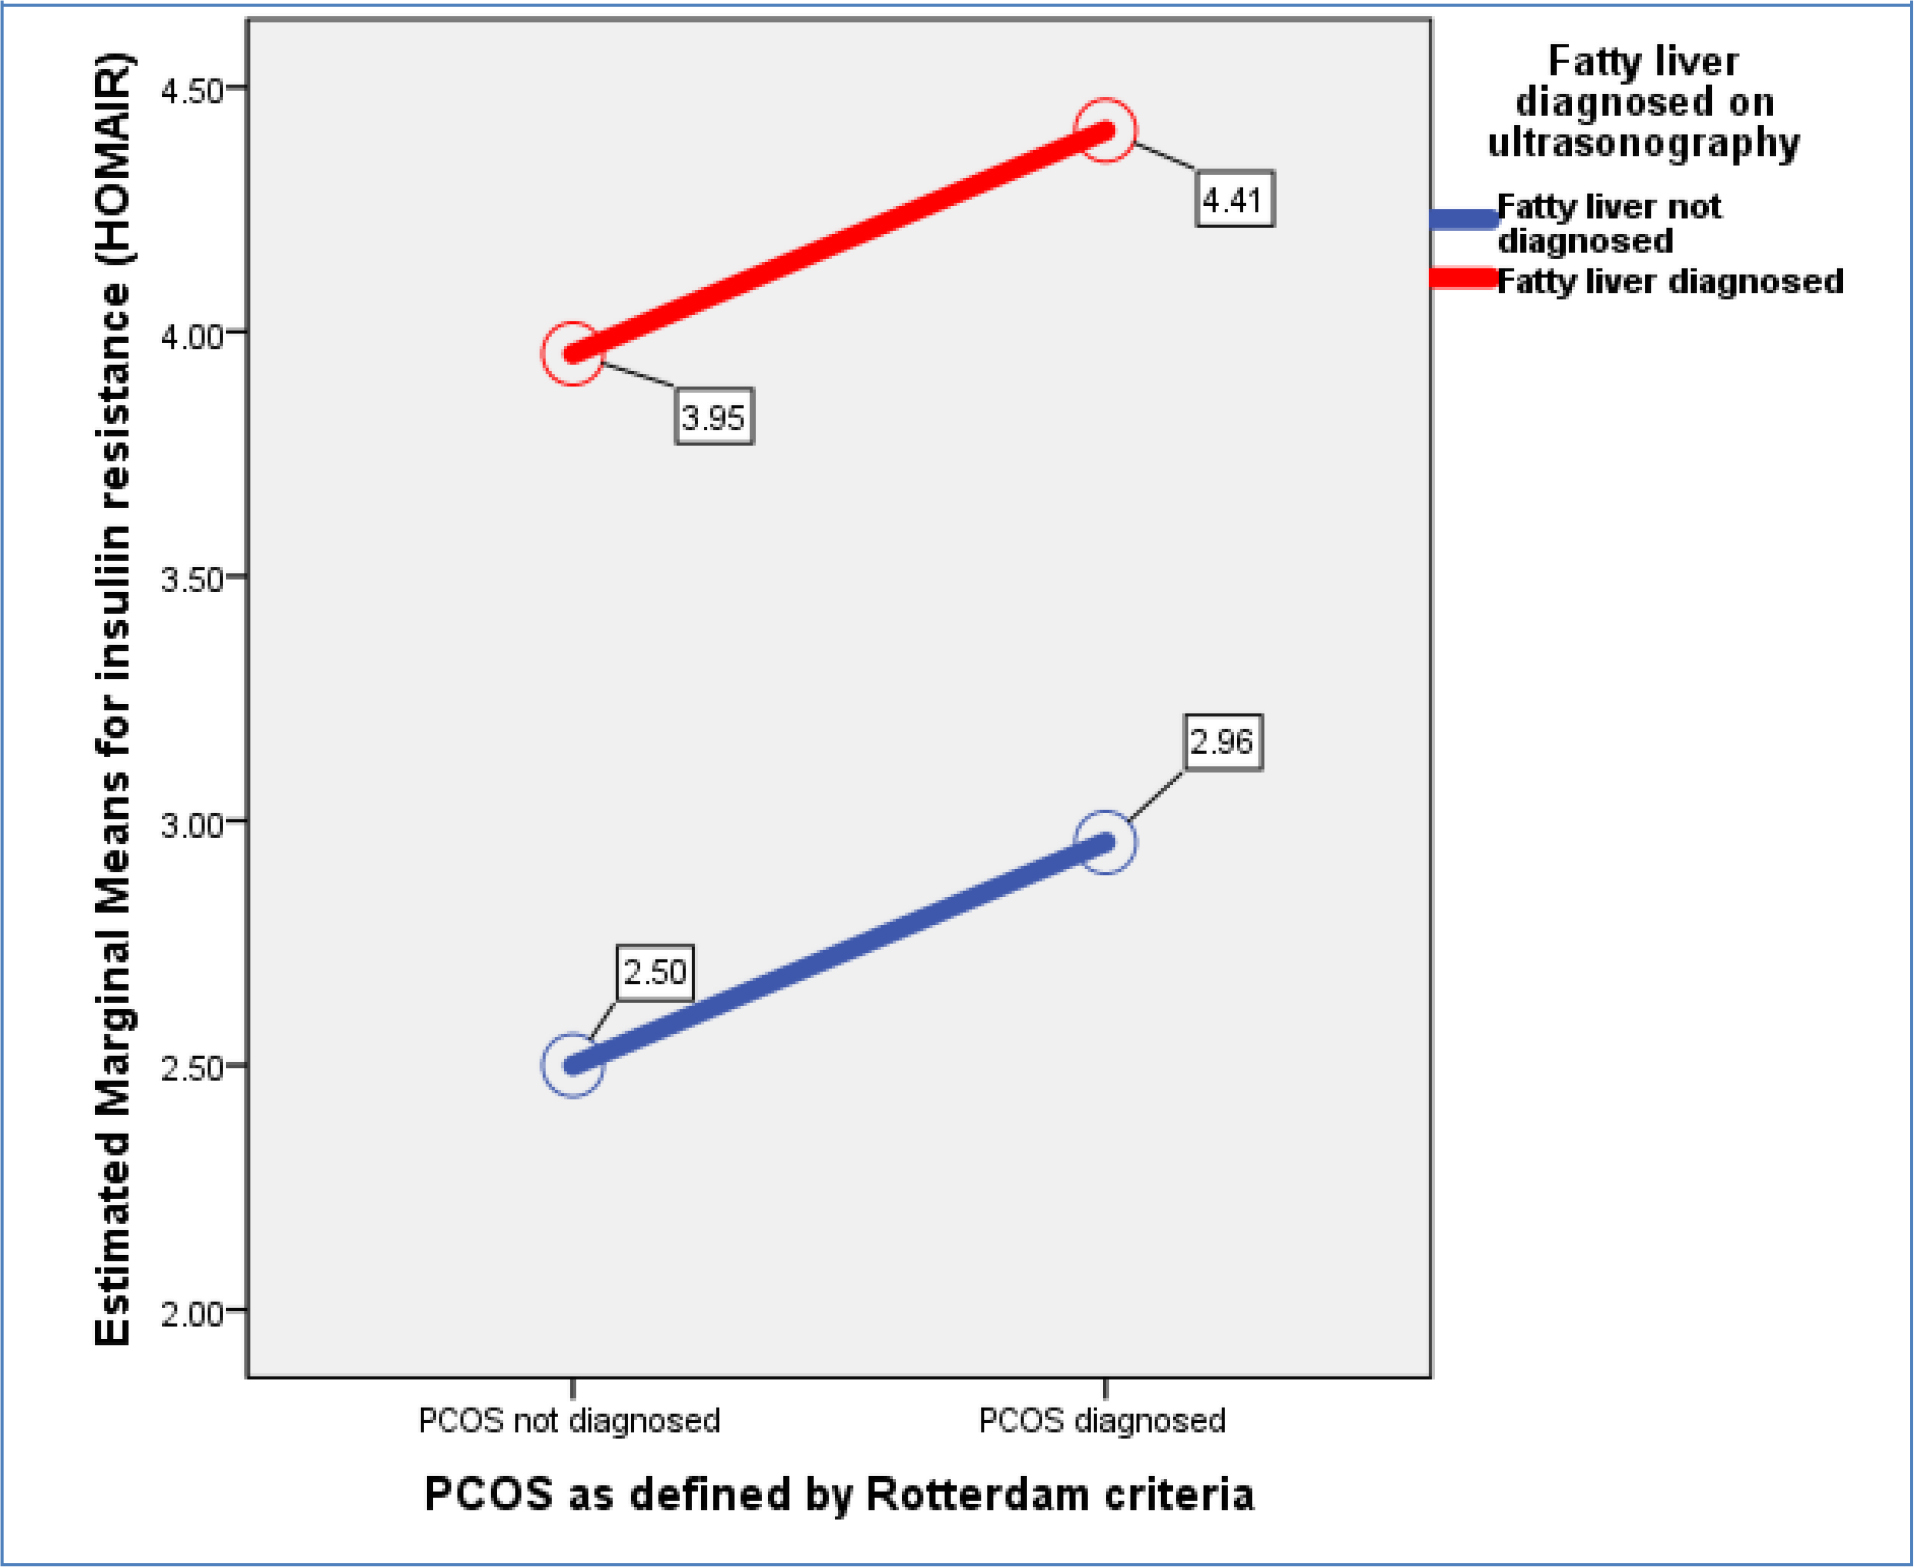
Figure 4. General Linear Model (GLM) with insulin resistance as dependent variable and presence or absence of PCOS (p=0.157) and fatty liver disease (p<0.001) as independent variables (Overall Model significance<0.001).

Discussion

Polycystic ovarian syndrome (PCOS) and fatty co-occurrence in study subjects was slightly higher than subjects with having one of the pathology, implying a very weak association between the two entities. Though the OR for presence of PCOS in subjects with fatty liver disease was above i.e., 1.34 but it was not statistically significant. Our data identified free androgen index and hirsutism to be more associated than fat deposition within liver as factors in contributing polycystic ovarian pathology. Furthermore we identified increase in AVI i.e., as a surrogate for abdominal fat deposition and insulin resistance to be more associated with presence of fatty liver disease than with PCOS. The trend, hence identified a strong link for insulin resistance in causation of fatty liver disease and hyperandrogenism for PCOS. Contrary to our findings the data from some studies have highlighted a stronger link between obesity an insulin resistance markers with as common culprits in associating fatty liver and PCOS. [7, 8, 10, 11].

Macut et al have also identified a much higher combination diagnosis of PCOS and fatty liver disease than presence of a single pathology in Serbian population. [21] Coming to our data in terms of finding a weaker link it is important to understand that lean PCOS types are well-recognized in sub-continental population. [22] More so as Pande et al evaluated obesity and insulin resistance indices in these lean category of PCOS and observe them to be dissimilar than obese PCOS subjects, where the latter group were found to have more metabolic derangements.

[23] Similar to that Chinese have results quite similar to ours, where BMI and NAFLD were minimally associated with PCOS females. [24] Even some European studies have found a higher percentage of up to 40% lean-PCOS in their studies. [25] However, if we study the western population a contrast appear where insulin resistance and higher trunk fat mass clearly supersedes the Asian PCOS phenotype. [26] Therefore regional differences and possible epigenetic triggers can be attributed to the differential or minimal relationship between fatty liver disease and insulin resistance in subjects with PCOS.

Possible understanding of authors on this minimally existent relationship between PCOS and fatty liver disease in our data subjects is being explained below: Firstly, we described in the introduction that adipocyte size variation between Asian and Caucasian population, so possibly smaller adipocyte among Asians with capacity to accumulate more fat led to lesser abdominal volume indices and fatty liver disease in our data of female subjects. [15, 24] The argument therefore can be made that these most often obese-PCOS phenotypes females had higher insulin resistance due to increase fat mass and least contributed by hyperandrogenism. [26] However, we as author feel more interventional trials can clarify the real causation of PCOS and in specific its relation with abdominal and hepatic steatosis. Secondly, what impact the weather, environment and lifestyle could lead to aforementioned variation of PCOS patterns? We highlighted earlier the findings of

Bruce et al who described the role of environment in causing variable PCOS phenotypes. [13] A Spanish study by Concha et al evaluated the epigenetic marks by analyzing miRNAs and histone methylation in various body fluids and tissues to conclude a very strong impact of environmental triggers in association

with development of PCOS. [27] Pursuant and related directly to epigenetic mechanisms Monniaux et al was able to demonstrate in ovine fetuses that over exposure of follicular and uterine tissues may lay the foundation stone for a possible PCOS phenotype. [28] Finally, dietary patterns may be a significant contributor to PCOS as studies on gut microbiome had a different phylogenetic type along with lower density than control female subjects. [29] Thus shifting diet patterns from traditional and more natural food consumption to refined and high caloric diets could be an add on, if not causative factor in leading to PCOS development. We, therefore believe with globalization and mixing of people and in specific adopting western style diets and life styles the disease pattern may change overtime tilting more in favor of obese-phenotype. [30]

Certain limitations regarding our cross-sectional analysis needs to be taken into account: Firstly, we did this study in hospital-setting and our findings must be extrapolated to an epidemiological level to understand PCOS and its phenotype prevalence within our community. Secondly, we feel certain cultural barriers persist in our community due to lack of basic medical education and history. Provided our questionnaire format was structured and no language barrier was there still we interpret and this aspect to cause some degree of bias.

This study has important clinical implication especially in backdrop of wide regional and racial variation PCOS phenotypes. Taken the study setting and cross-sectional design the study can be further replicated to validate phenotypes of PCOS prevailing at broader level. Thus more data should follow this study project. However, this article does provide a broader guideline in terms of interpreting and segregating PCOS phenotypes within our population, which can help treating physicians to specify their treatment options in a more personalized manner. On a national scale the data also highlights the need for local guidelines for our community using this data and evidence from surrounding regions.

Conclusion

Presence of fatty liver disease in females can lead to slightly higher frequency of PCOS. Biochemical and clinical hyperandrogenism were more associated with presence of PCOS than with fatty liver disease, while abdominal obesity and insulin resistance were more often than not associated with fatty liver disease in comparison to PCOS.

Declarations

  • The data sets and SPSS outputs used and/or analyzed during the current study are available from the corresponding author on formal request.
  • Ethical approval – The study “Relationship between polycystic ovarian syndrome (PCOS) and fatty liver disease” was approved by ethical committee of the hospital. All participants were volunteer and provided “written consent” for the study.
  • Author’s contributions – SHK: (Author for all Correspondence) Study plan, Involved in study plan, involved in sampling, methodology, lab analysis, data analysis, manuscript writing. SA: History collection, data analysis, and contributed towards discussion. RS: Radiological diagnosis of PCOS, Defining PCOS as per criteria, manuscript writing. RM: Initial patient history collection and examination, defining oligo/anovulation, data analysis, manuscript writing. RA: Patient examination, history writing, anthropometric measurements, manuscript writing. TC: Study plan, methodology, manuscript writing. Final manuscript was approved by all authors.
  • Consent for publication: Signed consent was sorted from all study participants.
  • Competing interests – There are no competing interests to declare.
  • Data funding – The study had no funding source to disclose.
  • Acknowledgements – The authors acknowledge the work of Miss Huma, and Lab technician Ibrahim and Iftikhar for the support.

Abbreviations

Fatty liver disease, Polycystic ovarian syndrome (PCOS), Free Androgen Index (FAI), Homeostasis Model Assessment for Insulin Resistance (HOMAIR), Modified Ferrimen Gellwey (mFG) score, Abdominal Volume Index (AVI).

References

  1. Tsouma I, Kouskouni E, Demeridou S, Boutsikou M, Hassiakos D and Chasiakou A. Lipid lipoprotein profile alterations in Greek infertile women with polycystic ovaries: influence of adipocytokines levels. In Vivo. 2014 Sep-Oct; 28(5): 935-9.
  2. Zhang X, Wang Y and Liu P. Omic studies reveal the pathogenic lipid droplet proteins in non-alcoholic fatty liver disease. Protein Cell. 2017 Jan; 8(1): 4-13. DOI: 10.1007/s13238-016-0327-9.
  3. Donati MB. The “common soil hypothesis”: evidence from population studies? Thromb Res. 2010 Apr; 125 Suppl 2: S92-5. DOI: 10.1016/S0049-3848(10)70023-2.
  4. Spritzer PM, Barone CR and Oliveira FB. Hirsutism in Polycystic Ovary Syndrome: Pathophysiology and Management. Curr Pharm Des. 2016; 22(36): 5603-5613.
  5. Margini C and Dufour JF. The story of HCC in NAFLD: from epidemiology, across pathogenesis, to prevention and treatment. Liver Int. 2016 Mar; 36(3): 317-24. DOI: 10.1111/liv.13031.
  6. Macut D, Bjekić-Macut J, Livadas S, Stanojlović O, Hrnčić D and Rašić-Marković A, Nonalcoholic Fatty Liver Disease in Patients with Polycystic Ovary Syndrome. Curr Pharm Des. 2018; 24(38): 4593-4597. DOI: 10.2174/1381612825666190117100751.
  7. Rocha ALL, Faria LC, Guimarães TCM, Moreira GV, Cândido AL, Couto CA and Reis FM. Non-alcoholic fatty liver disease in women with polycystic ovary syndrome: systematic review and meta-analysis. J Endocrinol Invest. 2017 Dec; 40(12): 1279-1288. DOI: 10.1007/s40618-017-0708-9.
  8. Vassilatou E. Nonalcoholic fatty liver disease and polycystic ovary syndrome. World J Gastroenterol. 2014 Jul 14; 20(26): 8351-63. DOI: 10.3748/wjg.v20.i26.8351.
  9. Kauffman RP, Baker TE, Baker V, Kauffman MM and Castracane VD. Endocrine factors associated with non-alcoholic fatty liver disease in women with polycystic ovary syndrome: do androgens play a role? Gynecol Endocrinol. 2010 Jan; 26(1): 39-46. DOI: 10.3109/09513590903184084.
  10. Baranova A, Tran TP, Birerdinc A and Younossi ZM. Systematic review: association of polycystic ovary syndrome with metabolic syndrome and non-alcoholic fatty liver disease. Aliment Pharmacol Ther. 2011 Apr; 33(7): 801-14. DOI: 10.1111/j.1365-2036.2011.04579.x.
  11. Kuliczkowska Plaksej J, Laczmanski L, Milewicz A, Lenarcik-Kabza A, Trzmiel-Bira A and Zaleska-Dorobisz U. Cannabinoid receptor 1 gene polymorphisms and nonalcoholic Fatty liver disease in women with polycystic ovary syndrome and in healthy controls. Int J Endocrinol. 2014; 2014: 232975. DOI: 10.1155/2014/232975.
  12. Jones H, Sprung VS, Pugh CJ, Daousi C, Irwin A and Aziz N. Polycystic ovary syndrome with hyperandrogenism is characterized by an increased risk of hepatic steatosis compared to nonhyperandrogenic PCOS phenotypes and healthy controls, independent of obesity and insulin resistance. J Clin Endocrinol Metab. 2012 Oct; 97(10): 3709-16. DOI: 10.1210/jc.2012-1382.
  13. Bruce KD and Cagampang FR. Epigenetic priming of the metabolic syndrome. Toxicol Mech Methods. 2011 May; 21(4): 353-61. DOI: 10.3109/15376516.2011.559370.
  14. Petäjä EM, Sevastianova K, Hakkarainen A, Orho-Melander M, Lundbom N and Yki-Järvinen H. Adipocyte size is associated with NAFLD independent of obesity, fat distribution, and PNPLA3 genotype. Obesity (Silver Spring). 2013 Jun; 21(6): 1174-9. DOI: 10.1002/oby.20114.
  15. Anand SS, Tarnopolsky MA, Rashid S, Schulze KM, Desai D and Mente A. Adipocyte hypertrophy, fatty liver and metabolic risk factors in South Asians: the Molecular Study of Health and Risk in Ethnic Groups (mol-SHARE). PLoS One. 2011; 6(7): e22112. DOI: 10.1371/journal.pone.0022112.
  16. Goodman N, Bledsoe M, Cobin R, Futterweit W, Goldzieher J, Petak S, Smith K and Steinberger E: “American Association of Clinical Endocrinologists Hyperandrogenism Guidelines”. Endocrine Practice 2001; 7(2): 120–13.
  17. Kollmann M, Klaritsch P, Martins WP, Guenther F, Schneider V and Herzog SA. Maternal and neonatal outcomes in pregnant women with PCOS: comparison of different diagnostic definitions. Hum Reprod. 2015 Oct; 30(10): 2396-403. DOI: 10.1093/humrep/dev187.
  18. Rotterdam ESHRE/ASRM-Sponsored PCOS Consensus Workshop Group 2004 Revised 2003 consensus on diagnostic criteria and long-term health risks related to polycystic ovary syndrome. Fertil Steril 81: 19–25.
  19. Al Kindi MK, Al Essry FS, Al Essry FS and Mula-Abed WA. Validity of serum testosterone, free androgen index, and calculated free testosterone in women with suspected hyperandrogenism. Oman Med J. 2012 Nov; 27(6): 471-4. DOI: 10.5001/omj.2012.112.
  20. Matthews DR, Hosker  JP,  Rudenski  AS,  Naylor  BA,  Treacher  DF and Turner  RC. Homeostasis model assessment: insulin resistance and beta-cell function from fasting plasma glucose and insulin concentrations in man. Diabetologia. 1985 Jul; 28(7): 412-9.
  21. Macut D, Tziomalos K, Božić-Antić I, Bjekić-Macut J, Katsikis I and Papadakis E. Non-alcoholic fatty liver disease is associated with insulin resistance and lipid accumulation product in women with polycystic ovary syndrome. Hum Reprod. 2016 Jun; 31(6): 1347-53. DOI: 10.1093/humrep/dew076.
  22. Goyal M and Dawood AS. Debates Regarding Lean Patients with Polycystic Ovary Syndrome: A Narrative Review. J Hum Reprod Sci. 2017 Jul-Sep; 10(3): 154-161. DOI: 10.4103/jhrs.JHRS_77_17.
  23. Pande AR, Guleria AK, Singh SD, Shukla M and Dabadghao P. β cell function and insulin resistance in lean cases with polycystic ovary syndrome. Gynecol Endocrinol. 2017 Nov; 33(11): 877-881. DOI: 10.1080/09513590.2017.1342165.
  24. Qu Z, Zhu Y, Jiang J, Shi Y and Chen Z. The clinical characteristics and etiological study of nonalcoholic fatty liver disease in Chinese women with PCOS. Iran J Reprod Med. 2013 Sep; 11(9): 725-32.
  25. Ciotta L, Pagano I, Stracquadanio M and Formuso C. Polycystic ovarian syndrome incidence in young women with non-alcoholic fatty liver disease. Minerva Ginecol. 2011 Oct; 63(5): 429-37.
  26. Glintborg D, Petersen MH, Ravn P, Hermann AP and Andersen M. Comparison of regional fat mass measurement by whole body DXA scans and anthropometric measures to predict insulin resistance in women with polycystic ovary syndrome and controls. Acta Obstet Gynecol Scand. 2016 Nov; 95(11): 1235-1243. DOI: 10.1111/aogs.12964.
  27. Concha C F, Sir P T, Recabarren SE and Pérez B F. Epigenetics of polycystic ovary syndrome. Rev Med Chil. 2017 Jul; 145(7): 907-915. DOI: 10.4067/s0034-98872017000700907.
  28. Monniaux D, Genêt C, Maillard V, Jarrier P, Adriaensen H and Hennequet-Antier C. Prenatal programming by testosterone of follicular theca cell functions in ovary. Cell Mol Life Sci. 2019 Jul 20. DOI: 10.1007/s00018-019-03230-1.
  29. Lindheim L, Bashir M, Münzker J, Trummer C, Zachhuber V and Leber B. Alterations in Gut Microbiome Composition and Barrier Function Are Associated with Reproductive and Metabolic Defects in Women with Polycystic Ovary Syndrome (PCOS): A Pilot Study. PLoS One. 2017 Jan 3; 12(1): e0168390. DOI: 10.1371/journal.pone.0168390. ECollection 2017.
  30. Rodgers RJ, Suturina L, Lizneva D, Davies MJ, Hummitzsch K, Irving-Rodgers HF and Robertson SA. Is polycystic ovary syndrome a 20th Century phenomenon? Med Hypotheses. 2019 Mar; 124: 31-34. DOI: 10.1016/j.mehy.2019.01.019.

Effect of Glucose Oxidase on the Cytokine Profile and Cholesterol of Monocytes in Liver Cancer

Abstract

Introduction: Cancer has an extremely important human and socio-economic impact. It is due to several cellular disturbances causing uncontrollable proliferation, which stimulate immune system elements including monocytes that can play a dual role either in the elimination or progression of cancer cells [1], these disturbances affect a variety of functions such as glucose metabolism [2].

Keywords

Liver cancer, Monocyte, GOx, Cytokines. Cholesterol

Objectives

This work hopes to investigate the effect of glucose oxidase at the level of the monocyte on the tumor growth thus determining its impact on the glycolysis activity and on the mitochondrial metabolism.

Aim: The aim of this study is to show the role of GOx in the polarization of monocytes in contact with tumor cells.

Materials and methods

Monocytes isolated from the blood of the cancer patient were co- cultured with the tumor epithelial cells isolated from a biopsy of the liver cancer, in a culture medium supplemented or not with GOx.

Results

GOx induced an increase in the INF-γ and decrease of IL-10 as well as in NO and Arginase in the presence of Glucose oxidase compared to thus without GOx, the Cholesterol in microenvironment was decreased in presence of GOx.

Conclusion

In conclusion, our results showed an pro-inflammatory effect was reported in monocytes in contact with liver tumor epithelial cells.

References

  1. Elliott LA, Doherty GA, Sheahan K, Ryan EJ (2017) Human Tumor-Infiltrating Myeloid Cells: Phenotypic and Functional Diversity. Front Immunol 8. [Crossref]
  2. Annibaldi A, Widmann C (2010) Glucose metabolism in cancer cells. Curr Opin Clin Nutr Metab Care 13: 466-470. [Crossref]

Biomarkers of Oxidative with Colorectal Cancer

Abstract

The number of   colorectal cancer increases regularly every year in Algeria and precisely in Tlemcen. It is a disease involving several genetic, hormonal, professional, environmental, but also behavioral factors, namely nutrition, the objective is to evaluate the nutritional and lipid profile on the one hand and some oxidative parameters of And to determine the relationship that may exist between nutritional factors and oxidative stress in patients with this type of cancer.

Keywords

Oxidative Stress, Colorectal Cancer

Materials and Methods

Thirty-three patients with newly diagnosed colorectal cancer were recruited from the Department of Gastroenterology, C.H.U. (CL, HDL-LC, LDL-CL, TG) and the oxidative status (ORAC, Catalase, Vitamin C, MDA) of Tlemcen and thirty-five healthy controls.

Results

A very significant difference was observed for patients with liver cancer compared to ORAC controls (1, 143 ± 0.121) (0, 4197 ± 0.0456) p <0.000; MDA (0, 2400 ± 0.0492) (0, 083 ± 0.0275) P <0.008; Catalase (1.385 ± 0.162) (0, 588 ± 0.219) p <0.008; LDL-CHOL (0.4300 ± 0.0239) (1. 0692 ± 0.0627 p <0.000, on the other hand no difference was observed for Vitamin C (0.221 ± 0.0465) (0, 1947 ± 0.0889) p <0.615 HDL-CHOL (0.4300 ± 0.0322) (0.466 ± 0.031) p <0.355.

The balance of the oxidizing / antioxidant status is a primary factor in oncology. The free radicals can lead to the appearance of mutations and, conversely.

References

  1. Golbidi S, Laher I (2010) Antioxidant therapy in human endocrine disorders. Med Sci Monit 16: 9–24.
  2. Jaeschke H (2011) Reactive oxygen and mechanisms of inflammatory liver injury: Present concepts. J Gastroenterol Hepatol 1: 173–179. [Crossref]

Concurrent Collapses of Demersal Fish and Sea Trout (Salmo trutta) on Scotland’s West Coast Following the Removal of the “Three-Mile Fishing Limit”

Abstract

The collapse of the sea trout (Salmo trutta) fishery in Loch Maree on Scotland’s north west coast occurred during the late 1980s.  Stocks of west coast demersal marine fish, especially around the Clyde Estuary have also declined over a similar time span. The decline of these marine fish stocks can be attributed to the removal of the “three-mile fishing limit” in 1984 by UK Government legislation. Sea trout inhabit the same inshore waters as targeted demersal fish and can be caught as unrecorded by-catch. Comparisons of the decline of demersal species and the sea trout the west coast show a high degree of correlation.

Keywords

fisheries, demersal fish, sea trout, stock collapse, three-mile fishing limit

Introduction

Catches of sea trout (Salmo trutta) using rod and line from rivers along Scotland’s north west coast have been in decline since the UK Government’s Scottish Office first began to collect records in 1952. Many different factors have been implicated in the decline including forestry, land use changes, acid rain, global and local climate change and overexploitation. However, attribution to any one factor is mostly anecdotal Picken [1].

Butler & Walker [2] detailed the collapse of the world-renowned Loch Maree sea trout fishery during the late 1980s. They found that prior to 1987, annual catches of sea trout ranged between 546 and 1575 whilst from 1988 to 2001, catches fluctuated between 35 and 342, the lowest number being recorded in 2001. Butler & Walker blame the collapse on the establishment of a salmon farm in the adjacent sea loch, Loch Ewe in 1987, but do not provide any evidence to support their claim. They state that there is no other explanation for the collapse.

In 1984, the Inshore Fishing (Scotland) Act, implemented by the Scottish Office, repealed a ban on fishing within three nautical miles of the low water mark. This “three-mile limit” had been introduced in 1889 in the interest of protecting fish stocks against overexploitation Thurstan & Roberts [3]. The opening of inshore waters in 1984 meant that fishing vessels were able to trawl for fish along the north-west coast and within the confines of many sea lochs. This paper considers whether the removal of the “three-mile limit” may have been a significant contributory factor in the collapse of sea trout stocks in the Loch Maree fishery and elsewhere along Scotland’s north-west coast.

Materials & Methods

Examination of pre-existing data- Sea trout and the Ewe catchment including Loch Maree

Loch Maree is a 20km long freshwater loch located in north-west Scotland. It is connected to Loch Ewe, a 16km long sea loch by the 4km long River Ewe. Loch Maree had a reputation of world renown for its sea trout angling. Records of fish catches, both numbers and weights, are collected by the holders of fishing rights and submitted to Scottish government scientists for analysis. The catch records for sea trout from 1980 onwards for the whole Ewe System are shown in Figure 1.

AFS_2020-Martin Jaffa_F1

Figure 1. Annual weight of sea trout caught from the Loch Ewe catchment including Loch Maree. The bars represent the annual catch in kg. The line represents the moving five-year average.

The bars represent the annual catch in kg. The line represents the moving five-year average.

The decline in the number of sea trout is apparent from both the annual weight of sea trout caught and the moving five-year average.

Examination of Pre-Existing Data – Demersal Fish Catches and the “Three-Mile Limit”

Thurstan & Roberts [3]. examined the decline of catches of marine fish such as cod (Gadus morhua), whiting (Merlangius merlangus) and saithe (Pollachius virens) from the Inner Clyde fishing grounds around Scotland’s west coast. Figure 2.  

AFS_2020-Martin Jaffa_F2

Figure 2. Comparison of cod catches from the Inner Clyde fishing grounds. The bars represent the annual catch in tonnes. The line represents the moving five-year average. The decline of cod landings from the Inner Clyde is apparent from the annual record and the five-year average.

Collection of Data

The Scottish Government publish catch data for sea trout and landings of demersal fish annually on the statistics section of their website. Catch data for sea trout was collated from all fishery districts from Ullapool to the Clyde and landings for cod, whiting and saithe for all west coast fishing ports except Kinlochbervie, which is promoted as a drop off port for distant water fishing vessels. The various data sets were analysed to ascertain the likelihood that the decline of sea trout stocks during the late 1980s including the collapse of the Loch Maree fishery might be one consequence of changes to marine fishing legislation, specifically the removal of the “three-mile limit”.   

Statistical Analysis

Regression Analyses

One complication in analysing such data is the different ways in which information for the different species are expressed in different locations. Some data was recorded as numbers of fish, whilst other data was based around weight of fish. Given the varying numbers for different species/locations, the approach taken in the analysis was to examine the relative change in fish numbers/weight over time using simple linear regression.

AFS_2020-Martin Jaffa_eq1

Where β0 is the intercept, β1 represents the beta (β) coefficient (parameter estimate), X1 is the values of the variable in the regression model and  is the error term (residuals).

Comparison of regression slopes

For comparison of the slopes, a methodology using Z-statistic has been applied.

AFS_2020-Martin Jaffa_eq2

Where b1 is the slope of line 1, b2 is the slope of line 2, SEb1 is the standard error of slope 1 and  SEb2 is the standard error of the slope of line 2. The resulting Z-value was compared to the normal distribution to identify the statistical significance.

Graphical Presentation

All the sets of data were converted to a centred moving average and subsequently standardised to the same scale. The use of standardisation focuses on the pattern of catches rather than the actual volume.

The transformation of each variable was achieved using the formula

AFS_2020-Martin Jaffa_eq3

Where x is the volume of each fish species in a single year, AFS_2020-Martin Jaffa_eq4 is the mean average volume of each fish species over all years and σ is the standard deviation of volume of each fish species over all years. This will result in a variable with a mean of zero and a standard deviation of 1.

Results

Demersal Fish and the Lifting of the “Three-Mile Limit”

In 1984, the government removed the “three-mile limit” allowing fishing boats to trawl in inshore waters around Scotland Thurstan & Roberts [3] demonstrated that this resulted in a reduction of catches of marine demersal fish in the Inner Clyde. This is the most intensively studied area of inshore waters in Scotland, but the impacts are likely to be similar elsewhere around the Scottish coast.

West Coast

The Inner Clyde fishing grounds are located at the most southerly point of the north-west Highland region. Other fishing grounds are located along the length of the west coast with fish landed at several small fishing ports including Oban, Mallaig and Ullapool. The landings for cod, whiting and saithe are recorded by the Scottish Government and are subsequently published on the Scottish Government website.

The decline in demersal fish landed at west coast ports follows a similar pattern to the decline identified by Thurstan & Roberts [3] from within the Inner Clyde. Opening the “three-mile limit” to inshore fishing appear to have negatively impacted the tonnage of fish caught along the whole of the Scottish west coast.

Figure 3. combines the data for the four species using a five-point centred moving average on a standardised scale of the weight of fish landed. This clearly shows the similarities between the decline of marine species and sea trout.

AFS_2020-Martin Jaffa_F3

Figure 3. Five-point centred moving weight average on a standardised scale for west coast landings of cod (dashed line), whiting (dashed and dotted line), saithe (dotted line) and sea trout (solid line).

The data was analysed to determine the correlation between species. Sea trout is strongly correlated with cod (r = 0.83, p < 0.0001), whiting (r = 0.88, p < 0.0001) and saithe (r = 0.83, p < 0.0001).

Comparison of the rate of decline between species using regression slopes found that sea trout declined at a similar rate to cod (Z = -1.30, p = 0.1933) and whiting (Z = -0.34, p = 0.7322) but faster than saithe (Z = -6.90, p < 0.0001). This difference may be due to variability of different stocks in the west coast fishing grounds.

The west coast data covers the whole of the west coast excluding the furthest north. Landings of demersal can be identified from specific ports. Mallaig is an important fishing port half way up the west coast.  Figure 4 shows the landings at Mallaig compared to sea trout catches as a five-point centred moving average on a standardised scale for the weight of fish landed.

AFS_2020-Martin Jaffa_F4

Figure 4. Five-point centred moving weight average on a standardised scale for Mallaig catches of cod (dashed line), whiting (dashed and dotted line), saithe (dotted line) and sea trout (solid line).

The correlation between sea trout and the demersal species is less strong than for the west coast. This is not unexpected as marine fish stocks will vary along the coast due to the nature of the coastline. Sea trout is most correlated with cod (r = 0.68, p < 0.0001) but less correlated with whiting (r = 0.56, p = 0.0005) and saithe (r = 0.59, p = 0.0002). The comparison of the rate of decline using regression lines suggests that sea trout declined at a faster rate than demersal fish around Mallaig. However, the regression line for sea trout is likely to have bene influenced by the outlying points of high numbers in 1980 and 1981. Had the data started from 1982, the rate of decline would have been less steep. The data suggests that sea trout have declined faster than cod (Z = -4.01, p < 0.0001), whiting (Z = -2.17, p = 0.0300) and saithe (Z = -7.15, p < 0.0001).

Nephrops Fishery

Thurstan & Roberts [3] chart changes to in-shore fishing catches and noted that following the collapse of demersal fish stocks in in-shore waters, fishing boats have targeted Nephrops prawns. This crustacean has almost replaced demersal fish has the main catch in the Inner Clyde. Prawns are also targeted from ports around the whole Scottish coast. In 2016, Nephrops represented the second largest value of seafood landed at Scottish ports at £79 million with 21,000 tonnes which is greater than both cod and haddock together at £65 million. McIntyre et al. [4] highlight that the North East Atlantic Nephrops trawling fishery has been ranked as having the fifth highest discard rate in the world.  In the Inner Clyde, this is estimated to be between 66% and 80%. These are species that are not specifically targeted by the fishing boat and are subsequently discarded. It is not recorded whether these discards include sea trout.

Discussion

Collapse of Stocks of Demersal Fish

Thurstan & Roberts [3] report that prior to the removal of the “three-mile limit” in 1984, catches had increased during the 1960s and 1970s because key fishing grounds around the Clyde had been opened to more efficient pair-trawling. However, these higher catches were not maintained which led to fishermen demanding help from the Government. As a result, the UK Government introduced the Inshore Fishing (Scotland) Act in 1984 which repealed a ban on trawling in inshore waters. The new legislation removed the restriction on fishing within the “three-mile limit” expanding fishing opportunities as fishermen struggled to catch enough fish to sustain their livelihoods. The Firth of Clyde, as well as other west coast inshore fishing grounds, were opened to trawling allowing exploitation of species such as cod, whiting and saithe. Yet, the reopening of the “three-mile limit” did not bring an increase in landings as between 1984 and 2009, landings decreased by 99% Hislop [5]. In addition to cod, saithe and whiting, stocks of haddock, hake, herring, flounder and plaice all showed a similar downward trajectory (Thurstan & Roberts; McIntyre et al.) [3,4].

Sea trout stocks

There are 109 fishery districts across all of Scotland. Each is very different in nature and the number of fish caught annually. Most sea trout stocks from west coast fishery districts have shown a decline over many years. It is unclear why these stocks have declined, and several different factors have been proposed, but none are likely to be the sole reason. Instead, it is likely that there are a combination of factors bringing about these declines or else there is no obvious explaination. Sea trout catches in the Clayburn fishery district in the Outer Hebrides collapsed in 1976 and have never recovered. There has been no scientific investigation into this collapse, and the cause remains unknown

Relationship Between Sea Trout and Demersal Stock Collapses

The decline of sea trout catches from Scotland’s west coast strongly correlates with declines of landings of marine demersal fish at west coast fish ports with similar declines of saithe, cod and whiting. Whilst correlation does not equate to causation, the loss of marine fish can be attributed to the removal of the “three-mile limit” in 1984 which allowed fishing boats to trawl in inshore waters including sea lochs. Although sea trout stocks were already in decline, the removal of the “three-mile fishing limit” provides a plausible explanation as to cause of the collapse of the Loch Maree sea trout fishery Walker AF [6].

Significance Statement

Sea trout catches by rod and line have been in decline along the Scottish west coast since records began in 1952. No specific reason has been identified for the decline.  During the 1980s, the world-renowned sea trout fishery in Loch Maree collapsed. The cause of this collapse also remains unexplained.  This research has identified similarities between the collapse of demersal fish stocks and sea trout following the removal of the three-mile limit in 1984.

References

  1. Picken MJ (1990) The Sea Trout in Scotland. Symposium Proceedings. Scottish Marine Biological Association: 53–59.
  2. Butler JRA, Walker AF (2006) Characteristics of the Sea Trout (Salmo trutta) Stock  Collapse in the River Ewe (Wester Ross Scotland), in 1988–2001. In Sea Trout: Biology, Conservation and Management. Edited by Harris, G. & Milner, N. Blackwell Publishing Page: 45–59.
  3. Thurstan RH, Roberts CM (2010) Ecological meltdown in the Firth of Clyde, Scotland, Two centuries of change in a coastal marine ecosystem. PLos ONE 5.
  4. McIntyre F, Fernandes PG, Turrell WR (2012) Clyde Ecosystem Review. Scottish Marine and Freshwater Science: 3
  5. Hislop JRG (1986) The demersal fishery in the Clyde sea area. Proc. Roy. Soc.  90: 423–437.
  6. Walker AF (2006) The rapid establishment of a resident brown trout population from sea trout progeny in a fishless stream. In: Sea Trout Biology, Conservation & Management (Harris, G.S. & Milner N.J. eds). Proceedings of the First International Sea Trout Symposium. July 2004. Cardiff, Wales. Blackwell Publishing Oxford: 389–400.

Augmentation of Extraction Sockets – A Requisite for Future Rehabilitation

Abstract

Purpose: In this prospective study, bone formation in human extraction sockets is augmented with bovine- cancellous bone (Bio-Oss) and compared to bone formation in unaugmented extraction sockets.

Methods: Twenty patients with bilateral extraction sockets were included in this study. After all 40 extractions, one socket was augmented using cancellous bovine bone and another socket left to heal naturally. Bone density was measured by means of histogram, after 1 week, 1 month & 3 months following extractions.

Results: Extraction sites with graft by the means of histogram showed significant difference in the bone density. They were significantly augmented as compared to the sockets without graft.

Conclusion: The results of the present study suggests that the use of bone xenograft as graft material for alveolar ridge preservation after extraction. This aids in future rehabilitation with implant placement or fixed prosthesis.

Keywords

alveolar bone augmentation, extraction socket, socket preservation, bone density

Introduction

Tooth extraction is one of widely the performed procedures in dentistry and it has been historically well documented that this procedure may induce significant dimensional changes of alveolar ridge. The dilemma that clinician face today is how to manage tooth extraction to provide a good ridge for the future placement of a dental implant or to maximize ridge dimension for the fabrication of fixed or removal prosthesis. If performed inadequately the resulting deformity can be considerable obstacle to the aesthetic, phonetic, and functional results; that both our patients and we clinician expect at this current time [1].

Bone resorption occurs in the first three months following extraction. The condition appears to be progressive and irreversible, resulting in a host of prosthodontics, aesthetic, and functional problems. Post extraction bone loss is accelerated in the first 6 month, followed by a gradual modelling and remodelling of the remaining bone, with as much as 40% of the alveolar height and 60% of alveolar width lost in the first 6 months [2].

Jaw deformities from tooth removal can be prevented and repaired by a procedure called socket preservation. The procedure begins with atraumatic tooth extraction. Every attempt is made to preserve the surrounding bone and soft tissue, with an example on being careful not to fracture delicate buccal plate. After the extraction, a bone graft material is placed into the socket and covered with a resorbable or non-resorbable membrane and sutured. Most importantly, socket preservation helps to maintain the alveolar architecture and significantly reduces the loss of ridge width and height following tooth removal[3].

Various materials are used in modern dental and maxillofacial surgery for bone tissue substitution and reconstruction. All osteoplastic materials can be divided into four groups by origin: autogenic, allogeneic, xenogeneic, and synthetic.

Increasing the height and width of bone helps ensure the success and longevity of dental implants. Surgeons can utilize a variety of surgical procedure in ridge augmentation. The surgical procedure will depend on amount of available bone, the amount of augmentation necessary and patient related factors.

In this prospective clinical study, after multiple extractions, one socket is filled with xenograft graft and other socket left to heal naturally and then evaluated by means of bone density test, post-operatively.

Materials and Methods

After procuring the ethical approval from the ethical committee, 20 patients who reported to the Department of Oral and Maxillofacial Surgery, who required extractions of bilateral teeth either from maxilla or mandible. Out of these 40 extractions; all left sided sockets were preserved with bovine-cancellous bone (Bio-Oss) and were grouped as Group A; and all right sided extractions were left to heal naturally and were grouped as Group B.

To keep the study unbiased in regards of surgical expertise, only one surgeon performed all the cases in the present study.

The study protocol was explained to the patient in detail and their consent was obtained.

Inclusion Criteria: –

  • Systemically healthy patients.
  • Patients requiring bilateral extractions.
  • Tooth which were un-restorable by endodontic treatment and free from acute infections.
  • Patients who required intra-alveolar extractions.
  • Patients within 18–55 years of age group.
  • Patients who are willing to sign the informed consent.

Exclusion Criteria:-

  • Pregnancy or lactation
  • Systemically ill patients.
  • Chronic generalised/localized aggressive periodontitis patients or patients having severe bone loss more than 80%.
  • Bone disease or the use of medications that interfered with bone metabolism

Materials

  1. Deproteinized cancellous bovine bone supplied by Geistlich biomaterial, Inc. It has a granules size of 0.25mm-1mm. It is marketed in a sterile airtight pack, sterilized by gamma irradiation (Geistlich Bio-Oss).
  2. Vicryl suture material.

Methodology

The surgical procedure was carried out in an operating room under strict aseptic conditions. The surgeries were performed under local anaesthesia (lignocaine 2% with epinephrine 1:80,000). Furthermore, patients were given an antibiotic prophylaxis a day before surgery. The surgical procedure was performed with standard instruments set used for minor oral surgical procedures.

Multiple tooth extraction was done carefully & atraumatically, while preserving the alveolar bone plates around the teeth. The socket was then gently flushed with normal saline.

In all left sockets, bone graft was placed. Sutures were used to approximate the grafted sockets and in all right sided ungrafted sockets were compressed digitally and allowed to heal naturally.

All patients were given postoperative instructions following extractions. Antibiotics and Analgesics were prescribed postoperatively.

Assessment of patients was done at the end of 1st week, 1st and 3rd months postoperatively, based on the following parameters:

  • Pain Visual Analogue Scale (VAS) (Figure 1)
  • Infection – present/absent
  • Inflammation – present/absent
  • Swelling – present/absent
  • Graft – accepted/rejected
  • Bone density by means of histogram. Changes in alveolar bone level were measured by means of histogram (adobe photoshop) pixels ranging between 15000–16000.

JDMR 2020-301_Savina Gupta_f1

Figure 1. Visual Analogue Scale (VAS).

Results

20 patients (10 males and 10 females) with mean age of 25 participated in this prospective study. Regarding the parameters of pain, swelling, infection & inflammation in both the groups there was no significant difference. Table I represents those cases who reported with such complications. Thus, we did not procure a graphical representation of it.

Table 1. Prospective observations of parameters in volunteer participants Count (%).

Graft

 Parameter

 Indication 

Time of Observation

Preop

Week 1

Month 1

Month 3

Group A
(n=20)

Swelling

Absent

17(85%)

20(100%)

20(100%)

20(100%)

Present

3(15%)

0(0%)

0(0%)

0(0%)

Pain VAS Scale

Absent

11(55%)

20(100%)

20(100%)

20(100%)

Present

9(45%)

0(0%)

0(0%)

0(0%)

Infection

Absent

17(85%)

20(100%)

20(100%)

20(100%)

Present

3(15%)

0(0%)

0(0%)

0(0%)

Inflammation

Absent

17(85%)

20(100%)

20(100%)

20(100%)

Present

3(15%)

0(0%)

0(0%)

0(0%)

Graft


With Graft All were accepted

Group B
(n=20)

Swelling

Absent

15(75%)

20(100%)

20(100%)

20(100%)

Present

5(25%)

0(0%)

0(0%)

0(0%)

Pain VAS Scale

Absent

15(75%)

20(100%)

20(100%)

20(100%)

Present

5(25%)

0(0%)

0(0%)

0(0%)

Infection

Absent

15(75%)

20(100%)

20(100%)

20(100%)

Present

5(25%)

0(0%)

0(0%)

0(0%)

Inflammation

Absent

15(75%)

20(100%)

20(100%)

20(100%)

Present

5(25%)

0(0%)

0(0%)

0(0%)

For the grafts assessment in group A, clinical observation shows that all 20 patients indicated quicker healing with graft acceptance without any Necrosis (Figure 2).

JDMR 2020-301_Savina Gupta_f2

Figure 2. Placement of Bio Oss® Bone Graft & Post-operative healing of the socket.

On every follow up, bone density in both the groups were calculated with the help of histogram (Figure 3).

JDMR 2020-301_Savina Gupta_f3

Figure 3. Mean Bone Density Measurement by Abode Photoshop® Histogram.
Range: 15000 To 16000 Pixels.

The histogram displayed on overlay plot of different stages with increase or decrease of bone density at different times, for both the groups (Figure IV). The mean range of bone densities in group A on completion of 1st week it was 80.41±16.13 after 1 month it was 109.52±22.25 & after 3 months it was 124.84±23.17. In group B the mean range on 1st week it was 71.67±15.17 after 1 month 81.24±16.26 & after 3 months it was 89.21±15.34 (Table 2). The bone density presented in table 2 shows higher density in group A at the end of 3 months followed by 1month.

JDMR 2020-301_Savina Gupta_f4

Figure 4. Overlay Plot showing increase or decrease of bone density at different interval of times for both the groups.

Table 2. Prospective Bone Density (LS Mean ± SD).

Effect

Pre Op

Week 1

Month 1

Month 3

Group A

93.26±16.80 BC

80.41±16.13 CD

109.52±22.25 AB

124.84±23.17A

Group B

93.26±16.79 BC

71.67±15.17 D

81.24±16.26 CD

89.21±15.34 C

Superscript indicated connecting letters by Tukey HSD. Letters not similar are significantly different, (P<.001).

The ANOVA revealed significant interaction of grafting and time (P<.001) (Table 3 & Figure 5).

Table 3. Pearson Correlation of Bone Density between jaws within participants.

Group A

Group B

Bone Density Correlation

Pre Op

Pre Op

1.000**

Week 1

Week 1

0.932**

Month 1

Month 1

0.627**

Month 3

Month 3

0.740**

**Significant at P (<.001).

JDMR 2020-301_Savina Gupta_f5

Figure 5. Bone density correlation.

Discussion

In order to preserve the gift of nature, man is presently trying to be positively constructive and conservative, and thus from forest to fuel, all form of energy is being judiciously utilized [4]. The survival rate of human life has itself increased and hence maxillofacial structures, including natural teeth, are being preserved in an attempt toward this goal [5]. It is crucial to preserve the dimensions of the alveolar ridge after tooth extraction to achieve a predictable aesthetic and functional prosthetic restoration.

Alveolar preservation or Reconstruction is necessary for support, esthetics and function of any prosthodontic rehabilitation. M. M. Devan suggested that preservation of the alveolar ridge was an easier task than to reconstruct it, once it was lost [6].

The idea of directing host bone into a particular defect is not a new one [7]. The principle of sealing off an anatomical site for improved healing of a certain tissue type and directing regeneration by some type of mechanical barrier or by various resorbable bone grafts has been used in experimental osseous facial reconstruction since the mid-1950s [7].

Alveolar ridge resorption following tooth removal is physiologically undesirable and possibly unavoidable phenomenon. Significant knowledge exists of the healing process of extraction wounds, including contour changes caused by bone resorption and the cascade of histologic events in both animals and humans. It is common to see approximately 50% of the alveolar width and height resorbed within the first three months [8–10]. This can lead to ridge deformation and many other complications.

The use of bovine cancellous xenograft for bone regeneration has enhanced the surgeon’s ability to reconstruct deficient alveolus. Graft used in our study, is deproteinized cancellous (spongiosa) bovine bone supplied by Geistlich biomaterial, Inc. The graft particles are incorporated over time within living bone which provides long-term volume preservation [11–14]. The bio functionality of this graft is characterized by its topographic structure, hydrophilic properties and the biologic interaction that supports reliable bone formation [15].

In our study, the dimensions of the grafted alveolar ridge were largely preserved both horizontally and vertically after 3 months of extraction. Moreover, the bone density in the extraction socket was significantly greater 1month after extraction than in the naturally healed sockets. The slow resorption and long-term stability of xenograft appears to be an advantage for preserving alveolar ridge structures. Similar finding were demonstrated by Nevins et al showed that there is a good amount of ridge preservation after extraction of teeth in anterior region [16]. While Artzi et al observed minimal higher rates of bone in human extraction sockets filled with bovine bone mineral investigated after a healing period of 3 months than after a 6-week healing period [17].

These data demonstrates that bone resorption cannot be completely prevented even with effective socket preservation, but the dimensions of the alveolar ridge and keratinized soft tissue can be preserved to a major extent by socket preservation with Bio-Oss so that an optimal future implant site can be created predictably.

Conclusion

Alveolar ridge resorption has long been considered an unavoidable consequence of tooth extraction. With today’s increasing appearance consciousness, the days of just extracting a tooth and replacing it later is unacceptable to many patients. It is vital to preserve and maintain the edentulous ridge and gingival architecture.

In our study we discovered that bone regeneration using bovine cancellous seems promising. Clinical as well as stastical analysis of our study demonstrate an advantage of grafting after extraction for future rehabilitation with implant placement or fixed prosthesis, over the ungrafted socket. More long term studies are needed to confirm the success rate of implants placed in regenerated bone.

Compliance with ethical standards

  • Funding: no funding received
  • Conflict of interest:
  • Author 1 declares that she has no conflict of interest
  • Author 2 declares that she has no conflict of interest
  • Author 3 declares that he has no conflict of interest
  • Author 4 declares that she has no conflict of interest
  • Author 5 declares that he has no conflict of interest
  • Ethical approval: All procedures performed in studies involving human participants were in accordance with the ethical standards of the institutional and/or national research committee and with the 1964 Helsinki declaration and its later amendments or comparable ethical standards
  • Informed consent: “Informed consent was obtained from all individual participants included in this study”.

References

  1. Robert Horowitz, Danny Holtzclaw, Paul S Rosen (2012) A review on alveolar ridge preservation following tooth extraction. J Evid Dent base pract S1: 149–160. [Crossref]
  2. Barry K Bartee (2001) Extraction site reconstruction for alveolar ridge preservation.Part1: Rationale and materials selection. Journal of oral Implantology 17: 187–193. [Crossref]
  3. Cena Dimova (2014) Socket preservation procedure after tooth extraction. Key engineering materials Trans Tech Publication 587: 325–330.
  4. Rohit Madan, Vivek Gupta, Vivek K Bains, Sudhir S Patil, G P Singh, et al. (2011) Socket preservation vis-à-vis natural healing: Literature review. Asian Journal of Oral Health & Allied Sciences 1:195–201.
  5. Chandra R, Bains R, Loomba K, Pal US, Ram H, et al. (2010) Endosseous dental implant vis-à-vis conservative management: is it dilemma? Natl j maxillofac Surg 1: 26–29.
  6. M. Devan (2005) Basic principles in impression making. J Prosthet Dent 95: 503–508. [Crossref]
  7. Tasso Irinakis (2006) Rationale for socket preservation after extraction of a single -rooted tooth when planning for future Implant placement. J Can Dent Assoc 72: 917.
  8. Dietmar Weng, Vera Stock, Henning Schliephake (2011) Are socket and ridge preservation techniques at the day of tooth extraction efficient in maintaining the tissues of the alveolar ridge? Systemic review. Eur J Implantol 4: 59–66.
  9.  Jung RE, Philipp A, Annen BM, Signorelli L, Thoma DS, et al. (2013) Radiographic evaluation of different techniques for ridge preservation after tooth extraction: a randomized controlled clinical trial. J Clinical Periodontol 40: 90–98. [Crossref]
  10.  Lars Schropp, Ann Wenzel, Lambros Kostopoulos, Thorkild Karring (2003) Bone healing and soft tissue contour changes following single-tooth extraction: A clinical and radiographic 12-month prospective study. Int J Periodontics Restorative Dent 23: 313–323. [Crossref]
  11. Carlo Maiorana, Mario Beretta, Giovanni Battista Grossi, Franco Santoro, Alna Scott Herford, et al. (2011) Histomorphometric evaluation of anorganic bovine bone coverage to reduce autogenous grafts resorption: Preliminary result. Int J Periodontics Restorative Dent 5: 71–78. [Crossref]
  12. Traini Traini, Pascal Valentini, Giovanna Lezzi, Adirano Piattelli (2007) A histologic and histomorphometric evaluation of anorganic bovine bone retrieved 9 years after a sinus augmentation procedure. J Periodontol 78: 955–961. [Crossref]
  13. Arne Mordenfeld, Tomas Albrektsson Mats Hallman (2014) A 10 year Clinical and radiographic study of implants placed after maxillary sinus floor augmentation with an 80:20 mixture of deprotinized bovine bone and autogenous bone. Clinical Implant Dentistry and Related Research 16: 435–436. [Crossref]
  14. Galindo-Moreno P, Pedro Hernandez-cortes, Francisco Mesa, Nelson Carranza, Gintaras Juodzbalys, et al. (2012) Slow resorption of anorganic bovine bone by osteoclasts in maxillary sinus augmentation. Clinical Implant Dentistry and Related Research 15: 858–866. [Crossref]
  15. Mueedul Islam, Mohammed Imran, Harikeerthy Panthala, Azhar Khan, Shoaib N Parkar, et al. (2017) Processed Bovine Dentine and Bone Xenograft (BIO OSS) For Bone Regeneration and Repair-A Comparative Animal Study. Saudi J. Oral. Dent. Res 2: 303.
  16. Myron Nevins, Marcelo Camelo, Sergio De Paoli, Bernard Friedland, Robert K Schenk, et al. (2006) A study of the fate of the buccal wall of extraction sockets of teeth with prominent roots. Int J Periodontics & Restorative Dentistry 26: 19–29. [Crossref]
  17. Zvi Artzi and Carlos E. Nemcovsky (1998) The application of deproteinized bovine bone mineral for ridge preservation prior to implantation. Clinical and histological observations in a case report. J Periodontol 69: 1062–1067. [Crossref]