Monthly Archives: May 2019

Fracture Liaison Service and the Prospect of Fragility Refracture in Osteoporotic Patients

Osteoporosis is a silent disease, but one who’s impact is not silent. Over 9 million Americans have been diagnosed with osteoporosis, and more than 2 million osteoporotic fractures occur per year. This means that one in every two women aged 50 and above will have an osteoporotic fracture in her lifetime. Osteoporosis is characterized by decreased bone strength, reduced bone quantity and a decrease in the bone quality. These three factors lead to an increased susceptibility to fractures.

Postmenopausal women incur a high incidence of osteoporosis and subsequently fragility fractures A (defined as a fracture with minimal or no trauma, that occurs to the spine, ribs, pelvis or extremity bones), with a 50% refracture rate within two years. Men are not immune from this as 30% of men over 50 will have it on average. The burden on society and cost are high (around 21 million dollars in 2006) and will only grow as the aging population increases worldwide. Measures to prevent and reduce refracture rates and thus readmission have been worked out.

One of these ideas is a Fracture Liaison Service (FLS). The FLS program was established by the National Osteoporosis Foundation in 1996. It is a coordinated preventative care model that is operated under the supervision of a bone health specialist, who also collaborates with the patient’s primary care physician.

The Fracture Liaison Service project follows patients after a fragility fracture occurs. These patients are examined in a clinic, undergoing multiple tests including serum calcium, vitamin D levels as well as a dual-energy X-ray absorptiometry (DEXA scan). Their fracture risk is assessed following multiple visits at regular intervals to evaluate any progression of disease and to determine the refracture rate.

At our hospital, we established a Fragility Liaison Service program which remains solely the responsibility of the treating surgeon. The clinic since its inception in 2015 has seen around 300 patients and significantly reduced refracture rates. We focused primarily on patients with fractures of the spine and were able to reduce refracture rates by 1/3 in all patients with refractures (56% without FLS vs 37% post FLS, p=0.01).

However, our clinic can only see a certain number of patients with vertebral fractures, thus the remaining patients with rib fractures, pelvic fractures and extremity fractures need to be addressed. This can only happen when third-party payers pay attention to the FLS program as it has proven beneficial.

A Literature Review of the Treatment of Black Triangles

Abstract

Black triangles are a result of periodontal disease and can also be a response to treatment and return of health. They can also be a result of orthodontic treatment and tooth and root shape and position. They are perceived as unaesthetic and there is an increase in the demand for treatment. This paper will look at some of the treatment options that are available to treat black triangles. The treatment is often multidisciplinary and can involve orthodontics, surgery and restorative. As aim of this thesis is to aid the prediction of black triangles, as a solution to them needs to be sought. This paper explores the treatment of black triangles to help the clinician give the patients the options if it is predicted a black triangle may be present.

Method: An OVID MEDLINE search was undertaken using the term Black triangle AND treatment. This yielded 32 papers and of these 14 were related to dental black triangles. These 14 papers were the hand searched for their cited references and this yielded an additional 17 papers.

Conclusion: The treatment for black triangles can be difficult and in the case of surgical management very unpredictable. More research into simple predictable management needs to take place.

Key words

Black Triangles, Embrasure Space, Gingival Veneers, Periodontal Surgery

Introduction

Black triangles are both unaesthetic and can be an area where food can get trapped, which can lead to a worsening of gingival health and speech problems 1, 2]. The balance between the gingiva and the teeth should be as natural as possible to improve the aesthetics [3, 4]. Before any treatment, such as periodontal and orthodontics, the possibility of black triangles should be discussed [5]. If the black triangle is to be treated then it is important to know the aetiology of it. A black triangle is present if the interdental papilla is not filling the space cervical to the interdental contact point.

Black triangles are associated with periodontal disease both treated and untreated, orthodontics and orthognathic surgery. They therefore become more common as patients get older and are more prevalent in adults [5, 6]. It has been shown that patients older than 20 are more likely to have a black triangle than patients who are younger than 20 years old [7]. Patients who suffer from osteoporosis are also at an increased risk of developing gingival recession [8]. The tooth and the root morphology play a role in the presence of a black triangle. If the crown of the tooth is of a triangular shape then the patient is more likely to have a black triangle as the embrasure space will be larger. The embrasure space also plays a role in the aetiology of the black triangle [7]. The major aetiological factor for the presence of a black triangle is the contact point to the crest of bone distance. In periodontal disease there is loss of the interdental bone and this will therefore increase this distance between the contact point and the crest of the bone. Tarnow described the presence of a black triangle to be related to this distance and suggested that should a distance of 5mm or less exist between the contact point and the crestal bone then a black triangle can be avoided. If the distance is greater than 6mm then a 44% chance of a black triangle exists and if this is 7mm or greater then in 73% of cases a triangle will be formed [9].

The more posterior area in the mouth, the larger the embrasure space is, and the smallest space is that between the central incisors [10, 11]. The contact point is in fact a contact area and in the central incisor it is approximately 2mm x 2mm [11]. There is a classification of loss of papilla height developed by Nordland and Tarnow [12]. They used three landmarks to classify the papilla loss: the contact point interdentally, the labial apical position of the Cemento-Enamel Junction (CEJ), and the interproximal coronal position of the cemento-enamel junction.

The classes were divided in to four groups (Figure 9.1).

  • Normal – The papilla fills the space to the contact point.
  • Class I – The papilla lies between the contact point and the most coronal position of the CEJ interproximally (the interproximal CEJ not visible).
  • Class II – The papilla tip lies at or below the interproximal CEJ but coronal to the labial CEJ.
  • Class III – The papilla tip lies at or above the labial CEJ.

JDMR-19-116-Ali Rizvi_UK_F1

Figure 9.1. Classification of papilla loss.

Black triangles are perceived as unattractive by both patients and professionals. The evidence that patients do not like black triangles comes from a study by Cunliffe and Pretty where patients were asked to rank black triangles against other dental problems and they found that patients ranked black triangles after caries and missing teeth [13]. Kokich demonstrated orthodontists identified a black triangle of 2mm was unattractive whereas, general dental practitioners as well as the general public were unable to detect an open embrasure unless it was 3mm in length [14]. Patients are more aware of dental aesthetics with the increase in media coverage and the rise of celebrity culture [15]. In the UK’s 2009 Dental Health Survey 16% of dentate adults had difficulty in smiling or showing their teeth [16].

Treatment for black triangles

The aetiology of black triangles is multifactorial; therefore it is best that each patient is assessed thoroughly in order to formulate the treatment which will best suit them [17]. The treatment may be a single modality but more often it is a multidisciplinary with orthodontic, surgical and restorative management.

Orthodontic management

Teeth of triangular morphology are liable to black triangle disease and can be treated with Inter-Proximal Reduction (IRP) and space closure. The IRP and space closure changes the contact to a more broad area therefore reducing the contact point distance resulting in a reduced embrasure space. IRP is performed with diamond strips or fine burs to remove the interproximal enamel and change the mesial contour of the teeth. Usually, only 0.5mm-0.75mm of enamel is removed to achieve the desired result [18]. Another factor to considerer is the root divergence as this increases the likelihood of black triangles. The normal angle between the roots of patients with normal inter-dental papilla was 3.65° and if this increases by 1° then there is an increase in the probability of a black triangle from 14%-21% [1]. Orthodontists must take care with the placement of brackets to reduce the risk of divergent roots. Therefore in adults with attrition, the brackets need to be placed perpendicular to the long axis of the tooth and not parallel to the incisal edge. In addition it is also useful to know the angulation of the roots before treatment and a periapical radiograph is advised [19]. As the roots become more parallel the contact point becomes more apical and lengthens. The result is the crowns become closer and the trans-septal fibres fill the space and relax, therefore reducing or eliminating the open space [18].

The amount of crowding that the anterior teeth have has little influence on black triangles after orthodontic treatment. In patients with less than 4mm crowding and 4mm to 8mm crowding there was similar number of patients who had black triangles post treatment [5]. When the crowding was over 8mm, the percentage of black triangles went up by 7%. As patients get older there is a decrease in the width/length ratio as the crown of the tooth wears and becomes shorter. This changes the position and proportion of the contact point [20]. When a patient with previously treated periodontal disease is treated with orthodontics, care must be taken to explain that there may be marked interproximal recession that may need restorative management post orthodontics [21]. The other orthodontic management procedure is to take advantage of the fact that as a tooth is extruded the gingiva comes with it, and this may restore the interdental papilla with assistance of surgery [22].

Periodontal condition

It is important to make sure that the periodontal tissues are healthy and stable. If they are not there will be continued bone loss, which means that the tissues will further recede. The loss of the bone leads to an increase in the distance between the contact point to the crest of bone and an increased risk of a black triangle. It has been shown in several studies that when the distance between the contact point to the crest of the bone increases over 5mm, the percentage chance of having a black triangle increases [9, 19, 23]. Other periodontal considerations such as gingival inflammation, interproximal cleaning and gingival biotype need to be taken into account when assessing the risk of black triangles [13].

Tooth brushing trauma can also lead to black triangles and this includes overzealous use of interdental products. If this is suspected then interproximal cleaning should be stopped to see if the papilla recovers [24]. Patients who have thin gingival biotypes have a restricted blood supply at the papilla which results in altered healing [6]. Thin tissue is susceptible to trauma therefore it is best to educate the patient on atraumatic interdental cleaning [25].

Surgical procedures

The tissue interproximally is very fragile and the blood supply to this area is poor. Surgery works best on patients with thick tissue type, but it is patients with thin tissue who are more susceptible to recession. The thick tissue type has a better blood supply and rebound than the thin, whereas the thin tissue type tends to have permanent recession. This is why it is less predictable to use surgical procedures to correct interdental black triangles. There is also limited space to perform the procedures and it is difficult to place grafts due to limited access. If the papilla is damaged surgically then there is a risk the situation could be made worse. There was a study in 1965 when two papilla of 16 dental students were surgically removed and 69% failed to return to their original dimensions [26]. There have been micro surgical procedures undertaken to generate interdental soft tissue. They are very technique sensitive and their success will depend very much on the clinician’s skill and experience. There have been some promising case studies that have shown some success [27, 28]. Recently there has been a pilot study on the use of micronised acellular dermal matrix allograft technique which found it promising as there was significant increase in the papilla index [29]. This study was undertaken on 12 patients with 38 papilla defects and involved the use of powdered dermal matrix mixed with saline. It was then injected into a pouch that was formed by releasing the gingival papillary complex to move it coronally.

In implant treatment it is harder to produce a papilla as there is no interdental crest between two implants. It has a flat plate of bone that does not support the papilla as well. Tarnow looked at the presence of the papilla from the crest of the bone to contact point distance and found that only an average of 3.4mm of gingival height could be achieved between two adjacent implants [30]. This group suggested that if two teeth need to be replaced in the aesthetic zone then it is better to place one and cantilever the other tooth from the implant. The edentulous area can be surgically enhanced with a connective tissue graft and an ovate pontic to develop an appearance of a papilla. When the area is enhanced with more soft tissue in the form of connective tissue grafts the amount of soft tissue above the bone can increase up to 9mm [31]. The ovate pontic was developed in the 1980s [32] and it has a convex surface. This design allowed the illusion of an emergence profile. There is a larger area of contact between the pontic and the soft tissue and there is a degree of light pressure [33]. To use an ovate pontic there needs to enough width of the ridge. In the case of a thin narrow ridge, if an ovate pontic is to be used, then there will need to be surgical ridge augmentation.

The classification for ridge defects was developed by Seibert [34].

  1. Class I – Loss of width of the ridge but the height remains the same.
  2. Class II – Loss of the height but the width remains the same.
  3. Class III – Loss of the width and the height.

The techniques to augment the ridge are:

  • Socket preservation. Bone graft material is placed in the fresh extraction socket to reduce the collapse of the socket [35].
  • A full thickness soft tissue graft. Free gingival graft is used as an onlay to correct the defect [34].
  • Pouch flap. Involves the use of connective tissue being placed in a pouch to increase the width of the ridge. It was described by Garber and Rosenberg where the connective tissue was taken from the tuberosity [33]. This was a development from a previously described technique [36].
  • Hydroxyapatite implant where hydroxtapatite particles or a block is placed sub gingival [37, 38].
  • Connective tissue graft and partial thickness flap — These grafts are placed under the mucosa to increase the thickness of the tissue [39].
  • Provisional restoration. The temporary restoration is fitted after the extraction of a tooth and goes into the socket slightly to prevent the collapse of the socket [40].

The modified ovate pontic moves the apex from the centre to a more labial aspect (Figure 9.2)

JDMR-19-116-Ali Rizvi_UK_F2

Figure 9.2. Pontic designs.

1a. Ridgelap, 1b. Modified ridgelap, 1c. Ovate pontic, 1d. Modified ovate pontic.

The modified ovate pontic is easier to clean and needs less width which therefore reduces the need to augment the edentulous ridge. The height of the apex is 1mm-1.5mm apical to the tissue height and from the labial surface. There have been reports of inflammation and swelling with the use of these ovate pontics [41–43]. If oral hygiene is maintained, however, it was found that in the premolar and molar regions ovate pontics were not associated with clinically obvious inflammation. When the tissue was looked at histologically the keratin layer was thinner and there was a change in the subepithelial connective tissue [44]. Other studies have also found that if oral hygiene is good, and the pontic is cleaned with floss or superfloss, the tissue will be clinically healthy [45,46]. When the ovate pontic exerted pressure on the tissue there is a thinning of the tissue but no histological changes [47].

Another suggestion to aid the papilla adjacent to implants is to place a temporary restoration on the implant after the second stage surgery which can be used to guide the tissues before the definitive restoration is made [48]. The subgingival tissue in the interproximal area of the temporary restoration will guide the tissue to the desired position [49]. The position of the implant in the bucco-lingual is also important to the aesthetics. If a line is drawn from the facial aspects of the adjacent teeth the centre of the implant should be at least 4mm from this imaginary line [50]. This position reduces the risk of labial bone being lost which could lead to recession. The space that is needed mesio-distal is also important as there needs to be a minimum of 1.5mm from the edge of the implant to the adjacent tooth. This will allow oral hygiene and the development of a papilla. So with a 4mm implant there needs to be a 7mm space to place it [48]. Some authors have developed flaps to create papilla at the exposure stage, one of which was a palatal flap rotated and split into two parts: one for the mesial and one for the distal [51]. There have also been techniques described to make it appear there is a papilla [52, 53].

Restorative management

Restorative management can be the sole treatment for the management of black triangles or it may be used in combination with orthodontics. There is the interproximal striping as described above to change the shape of a triangular tooth in order to change the length and position of the contact point. There has also been the use of indirect crowns and/or veneers [54] to increase the length of the contact point to mask the interproximal space. The problem with these treatments is that they need temporisation which can have a detrimental effect on the health of the gingiva. In addition, if the definitive restoration impinges on the gingiva, it may have a detrimental effect on the gingival health [55, 56]. These have been also used with the pink porcelain where there is also labial recession but the problem with that is getting an exact colour match with the gingiva.

Over the years there have been improvements in bonding to enamel and dentine. There has also been much development in the aesthetics of composite resins and their wear and staining resistance. There has been an increase in the use of direct composite restoration to mask the embrasure space. This method is economically viable, quick and non-invasive. Bichacho suggested that there is no logical reason for macro mechanical preparation to close black spaces and achieve the desired contour [57]. It has also been shown to produce predictable results [58, 59]. The composite is placed slightly into the gingival sulcus which helps guide the shape of the interdental papilla [57, 60]. This technique using composite in the sulcus is described by Clark [61] who uses a matrix interproximally with an aggressive cervical contour and staged wedging.

For this technique to be successful the patient needs excellent oral hygiene otherwise the control over the gingiva will be lost, as the tissues will become inflamed due to the presence of plaque [47]. If the area that contacts the gingival is polished and smooth there will be no adverse effects if the patient has good oral hygiene [62]. These direct restorations to fill in the interdental space relies on the cervical contour [62] and the contact point position [9]. To allow the formation of the interdental papilla there needs to be 3mm-5mm of soft tissue present [63]. With this minimal thickness the tissue can compress and reshape.

Hyaluronic acid

The hyaluronic acid is derived from a streptococcus species of bacteria of a high degree of purity [64], and then cross linked up to 1% [65, 66] This product has been used to correct facial creases and bulk tissue in the face [67]. The commercial product used in the UK is RestylaneTM* and this is registered with the Medicines and Healthcare Products Regulatory Agency (MHRA) for adverse effects reporting. An adverse effects form has been made to record any reactions to the product (Appendix 5).

The product was first evaluated in Sweden and Italy [66, 68]. Both these studies showed good and sustained results at 6–8 months later. The adverse effects of the treatment were evaluated and it was found that in 1999 only one in every 650 (0.15%) of patients treated with Restylane had redness, local granulomatous reaction, swelling, acneiform or bacterial infection [69]. Since then the product has been purified even more and by 2000 this dropped to 0.06% [69]. As the purification process has improved and hypersensitivity reactions are as low as 0.02%, no skin testing is needed [70]. Hyaluronic acid is very hydrophilic, and can form a gel at low concentrations and has a large volume to mass [71]. This property makes it ideal to produce volume in the tissue. Becker et al carried out a self-funded study where 14 black spaces were treated with Hyaluronic acid (4 teeth and 10 implants). Each site was evaluated for the percentage change between the initial and final applications. 3 sites had 100% improvements whereas 8 sites had 88 to 97% improvement. All the patients thought the treatment was painless and 6 thought there was significant improvement [72].

Conclusion

Black triangles come about as a result of tooth shape, root angulation, orthodontic treatment and most often bone loss due to periodontal disease. The treatment can be multidisciplinary but before it is undertaken the aetiology of the recession needs to be explored because it may have a bearing on the treatment that is being done. Therefore treatment planning to reduce the formation of black triangles during treatment and careful work up is needed. Before any restorative treatment is undertaken it is important to do a diagnostic wax up the see the width/height ratio of the teeth after the restorations. It is advisable to not exceed the width of an anterior tooth by more than 80% of its length [73]. There may also be an imbalance in the proportions such as the ‘golden proportions’ [74]. As the treatment of black triangle can be unpredictable more research is needed to find simple, less invasive and more predictable methods.

References

  1. Kurth JR, Kokich VG (2001). Open gingival embrasures after orthodontic treatment in adults: prevalence and etiology. Am J Orthod Dentofacial Orthop 120:116–123. [crossref]
  2. Takei HH (1980) The interdental space. Dent Clin North Am 24: 169–176. [crossref]
  3. Moskowitz ME, Nayyar A (1995) Determinants of dental esthetics: a rational for smile analysis and treatment. Compend Contin Educ Dent 16: 1164. [crossref]
  4. Singh VP, Uppoor AS, Nayak DG, Shah D (2013) Black triangle dilemma and its management in esthetic dentistry. Dental research journal 10: 296–301. [crossref]
  5. Ko-Kimura N, Kimura-Hayashi M, Yamaguchi M, Ikeda T, Meguro D, et al. (2003) Some factors associated with open gingival embrasures following orthodontic treatment. Australian Orthodontic Journal 19: 19–24. [crossref]
  6. Chow YC, Eber RM, TsaoY, Shotwell JL, Wang H (2010) Factors associated with the appearance of gingival papillae. Journal of Clinical Periodontology 37: 719–727. [crossref]
  7. Chang L (2007) The association between the embrasure morphology and and central papilla recession: a noninvasive method of assessment. Chang Gung Med J 30: 445–452. [crossref]
  8. Shum I, Leung P, Kwok A, Corbet EF, Orwoll ES, et al. (2010) Periodontal Conditions in Elderly Men With and Without Osteoporosis or Osteopenia. Journal of Periodontology 81: 1396–1402. [crossref]
  9. Tarnow DP, Magner AW, Fletcher P (1992) The effect of the distance from the contact point to the crest of bone on the presence or absence of the interproximal dental papilla. J Periodontol 63: 995–996. [crossref]
  10. Blitz N (1997) Criteria for success in creating beautiful smiles. Oral Health 87: 38–42. [crossref]
  11. Morley J, Eubank J (2001) Macroesthetic elements of smile design. J Am Dent Assoc 132: 39–45. [crossref]
  12. Nordland WP, Tarnow DP (1998) A classification system for loss of papillary height. J Periodontol 69: 1124–1126. [crossref]
  13. Cunliffe J, Pretty I (2009) Patients’ ranking of interdental “black triangles” against other common aesthetic problems. European Journal of Prosthodontics & Restorative Dentistry 17: 177–181. [crossref]
  14. Kokich VO Jr, Kinzer GA (2005) Managing congenitally missing lateral incisors. Part I: Canine substitution. J Esthet Restor Dent 17: 5–10. [crossref]
  15. Ahmad I (2010) Risk management in clinical practice. Part 5. Ethical considerations for dental enhancement procedures. British Dental Journal 209: 207–214.
  16. Steele S, O’ Sullivan I (2011) Adult Dental Health Survey 2009 N. statistics, The Health and Social Care Information Centre.
  17. AlAhmari F (2018) Reconstruction of Lost Interdental Papilla: A Review of Nonsurgical Approaches. Journal of Dental and Medical Sciences 17: 59–65.
  18. Kokich VG (1996) Esthetics: the orthodontic-periodontic restorative connection. Semin Orthod 2: 21–30. [crossref]
  19. Wu YJ, Tu YK, Huang S, Chan C (2003) The influence of the distance from the contact point to the crest of bone on the presence of the interproximal dental papilla. Chang Gung Med J 26: 822–828. [crossref]
  20. Kokich VG, Spear FM (1997) Guidelines for managing the orthodontic-restorative patient. Semin Orthod 3: 3–20. [crossref]
  21. Zachrisson B (2005) Orthodontics and periodontics. Clinicail periodontology and Implant dentistry – Jan Lindhe.
  22. Carnio J (2004) Surgical reconstruction of interdental papilla using an interposed subepithelial connective tissue graft: a case report. Int J Periodontics Restorative Dent 24: 31–37. [crossref]
  23. Chang LC (2008) Assessment of parameters affecting the presence of the central papilla using a non-invasive radiographic method. J Periodontol 79: 603–609. [crossref]
  24. Tanaka OM, Furquim BD, Pascotto RC, Ribeiro GL, Bósio JA, et al. (2008) The dilemma of the open gingival embrasure between maxillary central incisors. J Contemp Dent Pract 9: 92–98. [crossref]
  25. Kandasamy S, Goonewardene M, Tennant M (2007) Changes in interdental papillae heights following alignment of anterior teeth. Aust Orthod J 23: 16–23. [crossref]
  26. Holmes CH (1965) Morphology of the interdental papillae. J Periodontol 36: 455–460. [crossref]
  27. Nemcovsky CE (2001) Interproximal papilla augmentation procedure: a novel surgical approach and clinical evaluation of 10 consecutive procedures. Int J Periodontics Restorative Dent 21: 553–559. [crossref]
  28. Checchi L, Montevecchi M, Checchi V, Bonetti GA (2009) A modified papilla preservation technique, 22 years later. Quintessence Int 40: 303–311. [crossref]
  29. Geurs NC, Romanos AH, Vassilopoulos PJ, Reddy MS (2012) Efficacy of micronized acellular dermal graft for use in interproximal papillae regeneration. International Journal of Periodontics & Restorative Dentistry 32: 49–58. [crossref]
  30. Tarnow D, Elian N, Fletcher P, Froum S, Magner A, et al. (2003) Vertical distance from the crest of bone to the height of the interproximal papilla between adjacent implants. Journal of Periodontology 74: 1785–1788. [crossref]
  31. Elian N, Jalbout ZN, Cho SC, Froum S, Tarnow DP (2003) Realities and limitations in the management of the interdental papilla between implants: three case reports. Pract Proced Aesthet Dent 15: 737–744. [crossref]
  32. Abrams L (1980) Augmentation of the deformed residual edentulous ridge for fixed prosthesis. Compend Contin Educ Gen Dent 1: 205–213. [crossref]
  33. Garber DA, Rosenberg ES (1981) The edentulous ridge in fixed prosthodontics. Compend Contin Educ Dent 2: 212–223. [crossref]
  34. Seibert JS (1983) Reconstruction of deformed, partially edentulous ridges, using full thickness onlay grafts. Part I. Technique and wound healing. Compend Contin Educ Dent 4: 437–453. [crossref]
  35. Greenstein G, Jaffin RA, Hilsen KL, Berman CL (1985) Repair of anterior gingival deformity with durapatite. A case report. J Periodontol 56: 200–203. [crossref]
  36. Langer B, Calagna L (1980) The subepithelial connective tissue graft. Journal of Prosthetic Dentistry 44: 363–367. [crossref]
  37. Kaldahl WB, Tussing GJ, Wentz FM, Walker JA (1982) Achieving an esthetic appearance with a fixed prosthesis by submucosal grafts. J Am Dent Assoc 104: 449–452. [crossref]
  38. Allen EP, Gainza CS, Farthing GG, Newbold DA (1985) Improved technique for localized ridge augmentation. A report of 21 cases. J Periodontol 56: 195–199. [crossref]
  39. Langer B, Calagna LJ (1982) The subepithelial connective tissue graft. A new approach to the enhancement of anterior cosmetics. Int J Periodontics Restorative Dent 2: 22–33. [crossref]
  40. Spear FM (1999) Maintenance of the interdental papilla following anterior tooth removal. Pract Periodontics Aesthet Dent 11: 21–28. [crossref]
  41. Henry PJ, Johnston JF, Mitchell DF (1966) Tissue changes beneath fixed partial dentures. Journal of Prosthetic Dentistry 16: 937–947. [crossref]
  42. Cavazos EJr (1968) Tissue response to fixed partial denture pontics. Journal of Prosthetic Dentistry 20: 143–153. [crossref]
  43. Schield HW (1968) The influence of bridge pontics on oral health. J Mich State Dent Assoc 50: 143–147. [crossref]
  44. Zitzmann NU, Marinello CP, Berglundh T (2002) The ovate pontic design: a histologic observation in humans. Journal of Prosthetic Dentistry 88: 375–380. [crossref]
  45. Silness J, Gustavsen F, Mangersnes K (1982) The relationship between pontic hygiene and mucosal inflammation in fixed bridge recipients. J Periodontal Res 17: 434–439. [crossref]
  46. Tolboe H, Isidor F, Budtz-Jörgensen E, Kaaber S (1987) Influence of oral hygiene on the mucosal conditions beneath bridge pontics. Scand J Dent Res 95: 475–482. [crossref]
  47. Tripodakis AP, Constandtinides A (1990) Tissue response under hyperpressure from Convex pontics. Int J Periodontics Restorative Dent 10: 408–414. [crossref]
  48. Zuccati G (1993) Implant therapy in cases of agenesis. J Clin Orthod 27: 369–373. [crossref]
  49. Senty EL (1976) The maxillary cuspid and missing lateral incisors: esthetics and occlusion. Angle Orthod 46: 365–371. [crossref]
  50. Adell R, Eriksson B, Lekholm U, Brånemark PI, Jemt T (1990) Long-term follow-up study of osseointegrated implants in the treatment of totally edentulous jaws. Int J Oral Maxillofac Implants 5: 347–359. [crossref]
  51. Nemcovsky CE, Artzi Z, Moses O (2000) Rotated palatal flap in immediate implant procedures. Clinical evaluation of 26 consecutive cases. Clin Oral Implants Res 11: 83–90. [crossref]
  52. Becker W, Becker BE (1996) Flap designs for minimization of recession adjacent to maxillary anterior implant sites: a clinical study. Int J Oral Maxillofac Implants 11: 46–54. [crossref]
  53. Palacci P, Nowzari H (2008) Soft tissue enhancement around dental implants. Periodontol 2000 47: 113–132. [crossref]
  54. de Araujo, E. M., Jr., L. N. Baratieri, et al. (2003) Direct adhesive restoration of anterior teeth: Part 2. Clinical protocol. Pract Proced Aesthet Dent 15: 351–357. [crossref]
  55. Sorensen SE, Larsen IB, Jörgensen KD (1986) Gingival and alveolar bone reaction to marginal fit of subgingival crown margins. Scand J Dent Res 94: 109–114. [crossref]
  56. Sorensen JA (1989) A rationale for comparison of plaque-retaining properties of crown systems. J Prosthet Dent 62: 264–269. [crossref]
  57. Bichacho N (1998) Papilla regeneration by noninvasive prosthodontic treatment: segmental proximal restorations. Pract Periodontics Aesthet Dent 10: 75, 77–78. [crossref]
  58. Portalier L (1996) Diagnostic use of composite in anterior aesthetics. Pract Periodontics Aesthet Dent 8: 643–652. [crossref]
  59. De Araujo EM Jr, Fortkamp S, Baratieri LN (2009) Closure of Diastema and Gingival Recontouring Using Direct Adhesive Restorations: A Case Report. J Esthet Restor Dent 21: 229–241. [crossref]
  60. Bichacho N, Landsberg CJ (1997) Single implant restorations: prosthetically induced soft tissue topography. Pract Periodontics Aesthet Dent 9: 745–752. [crossref]
  61. Clark D (2008) “Restoratively driven papilla regeneration: correcting the dreaded ‘black triangle”. Tex Dent J 125: 1112–1115. [crossref]
  62. Bichacho N (1996) Cervical contouring concepts: enhancing the dentogingival complex. Pract Periodontics Aesthet Dent 8: 241–254. [crossref]
  63. Jacques LB, Coelho AB, Hollweg H, Conti PC (1999) Tissue sculpturing: an alternative method for improving esthetics of anterior fixed prosthodontics. Journal of Prosthetic Dentistry 81: 630–633. [crossref]
  64. Baumann L (2004) Replacing dermal constituents lost through aging with dermal fillers. Seminars in cutaneous medicine and surgery 23: 160–166. [crossref]
  65. Malson T, Lindqvist BL (1987) Gel of crosslinked hyaluronic acid for use as a vitreous humor substitute, Google Patents.
  66. Duranti F, Salti G, Bovani B, Calandra M, Rosati ML (1998) Injectable hyaluronic acid gel for soft tissue augmentation. Dermatologic surgery 24: 1317–1325. [crossref]
  67. Rohrich RJ, Ghavami A, Crosby MA (2007) The role of hyaluronic acid fillers (Restylane) in facial cosmetic surgery: review and technical considerations. Plast Reconstr Surg 120: 41–54. [crossref]
  68. Olenius M (1998) The first clinical study using a new biodegradable implant for the treatment of lips, wrinkles, and folds. Aesthetic plastic surgery 22: 97–101. [crossref]
  69. Friedman PM, Mafong EA, Kauvar AN, Geronemus RG (2002) Safety data of injectable nonanimal stabilized hyaluronic acid gel for soft tissue augmentation. Dermatologic surgery 28: 491–494. [crossref]
  70. Medicis Aesthetics, I. Restylane injectable gel (nonanimal stabalized hyaluronic acid; NASHA) package insert, Scottsdale Ariz.: Medicis Aesthetics.
  71. Alberts B, Johnson A, Lewis J, Raff M, Roberts K, et al. (2002) The molecular Biology of the Cell. New York, Garland Science 45.
  72. Becker W, Gabitov I, Stepanov M, Kois J, Smidt A, et al. (2010) Minimally invasive treatment for papillae deficiencies in the aesthetic zone: a pilot study. Clin Implant Dent Relat Res 12: 1–8. [crossref]
  73. de Araujo EM Jr, B. L., Monteiro S. Jr, et al. (2003) Direct adhesive restoration of anterior teeth: part 3: procedural considerations. Pract Proced Aesthet Dent 15: 433–437. [crossref]
  74. Magne P, Belser U (2003) Bonded porcelain restorations in the anterior dentition: a biomimetic approach. Chicago (IL), Quintessence Books.

Long-Term Effect of a Short Sucrose/Xylitol Exposure on Survival of Permanent Teeth: A Practice-Based Study

SUMMARY

Background: In the original trial preschool children were randomly divided into two groups: 8,4g xylitol or sucrose chewing gum for two months, to investigate xylitol’s effect on acute titis media (AOM). Salivary mutans streptococci (sm) levels were taken before and after trial. Sm levels ≥105 CFU/1ml were considered high and those <105 CFU/1ml low. Eighteen months after the exposure, oral health of the participants was investigated from patient records of the City of Oulu, Finland. If not available, the individuals were invited for check-up. Two months sucrose exposure caused a significant caries risk in primary dentition in high sm group.

Aim: Aim of this study was to examine the effect of sucrose/xylitol intervention of preschool children on their caries experience in following 10 years. Design Oral health data of the participants in AOM-trial were collected for analyses covering the period 2003–2008/2009 from the City of Oulu, Finland patient records with their permission. Kaplan-Meyer survival curves were drawn for each tooth. Statistical significance of difference in survival between groups was analysed by Wilcoxon test.

Results: There was no statistifically significant difference between xylitol and sucrose groups in the survival of any permanent teeth caries free. Low sm levels seemed to be a protective factor against caries. Caries history in pre-school age was the best predictor of caries experience in teenage.

Conclusions: Short sucrose exposure at preschool age does not increase the risk for permanent tooth decaying. Two months regular exposure to xylitol is too short for preventing caries in long run.

INTRODUCTION

The evidence of the role of sucrose in the manifestation and progression of dental caries is inevitable [1,2]. Widely used as a substitute for sucrose, xylitol has been reported to reduce caries incidence and have even anticariogenic potential [3]. Caries reduction based on xylitol’s ability to decrease the number of mutans streptococci in saliva and to inhibit plaque formation [4]. is reported to be at greatest during the first year of the eruption of teeth [5]. Additionally to numerous caries prevention research, the impact of xylitol on prevention of acute otitis media (AOM) has been investigated [6,7].

The present study is based on a randomized clinical trial conducted in 1995 [8], which investigated the impact of two-month regular use of xylitol chewing gum on prevention of AOM among children in a Finnish municipal day care center. Children in the intervention group got xylitol chewing gum whereas the control group got sucrose-sweetened chewing gum. Additionally, the growth inhibiting effect of xylitol against Streptococcus pneumoniae in pharynx of the children was examined. As an outcome, the two-month frequent xylitol exposure had a preventive effect against AOM but the carriage rate of S. pneumoniae between the xylitol and sucrose groups was not discovered. The use of sucrose chewing gum among the control group raised a question about the ethics of the study [9]. The rationale for the permission given by Finnish ethics committee for this AOM study was that the participants had regular dental check-ups in the Finnish municipal dental health care system [10]. Teeth of the children were not investigated prior or after the study, but salivary mutans streptococci levels before and after the trial were recorded [11]. All children were also customers of the municipal oral health care of the City of Oulu. At that time all children were examined at regular basis.

Findings of a study on the short-term effects of the original AOM trial did not indicate an increased risk of dental caries in the sucrose group of the original study population per se [11]. However, two months’ regular sucrose exposure for preschool aged children with high mutans streptococci levels at baseline caused a significant caries risk in primary dentition [11]. Analyses were carried out about two years after the original AOM trial.

The aim of the present study was to examine if a two-month daily sucrose/xylitol exposure had effects on caries prevalence 10 years later considering mutans streptococci levels at baseline. The hypothesis was that short sucrose/xylitol exposure at preschool age does not indicate permanent tooth decay 10 years later regardless of salivary mutans streptococci levels at baseline.

MATERIAL AND METHODS

Subjects

Original double-blinded, randomized, clinical intervention trial (AOM trial) was conducted in April-May 1995 in the city of Oulu, Finland [8]. Altogether 306 children in 11 day care centers were recruited and were randomly divided to those getting either sucrose or xylitol chewing gum for two months. The intervention group (n=157, mean age 5.0 ±1.4) received 8.4g xylitol a day (two pieces of chewing gum five times a day). Similar amount and number of pieces of sucrose gum were distributed for the sucrose group (n=149, mean age 4.9 ±1.5). Children in both groups attended municipal dental health care according to the normal schedule and individual need, including dental examinations, and necessary non-invasive and invasive treatments. No extra examinations nor preventive dental care were planned for the participants the trial. For the short-term analyses [11], data on oral health of 286 children was available for collection in the patient files of the municipal health care centre of the city of Oulu. Those with no data in the records after 1995, were clinically examined 18 months after the baseline trial [11].The xylitol group comprised 70 girls and 76 boys and, when the respective numbers in sucrose group were 76 and  64 (Table 1).

Table 1. Frequencies and distributions according to gender, intervention group and mutans streptococci (ms) level at baseline, ms level values of 19 children are missing.

Group

Gender n (%)

Boy

Girl

Total

Sucrose

64 (45.7)

76 (54.3)

140

Xylitol

76 (52.1)

70 (47.9)

146

140 (49.0)

146 (51.0)

286

ms +

42 (58.3)

30 (41.7)

72

ms –

89 (45.6)

106 (54.4)

195

131(49.1)

136 (50.9)

267*

*19 missing

Data

In 2008–2009, oral health data during the period 2003–2008 of participants in AOM trial, were collected from the electronic patient files for analyses of the present study (Figure 1). A gap of 6 years (1997–2003) was caused by the fact that electronic system was not yet in use in Oulu. From patient files number of dental visits and examinations, caries lesions and restorations in permanent teeth were recorded by one author (IH). Observations on caries lesion were considered dentine caries or deeper, demanding restorative or endodontic treatment or extraction.

JCRM 2019-106 - Anttonen Finland_F1

Figure 1. Flow chart of the study protocol.

Salivary mutans streptocci samples of the participants were taken before (baseline, n=257) and after the AOM trial in 1995 (n=245) from the oral mucosa with a swab by an oral hygienists of the municipal health center of the city of Oulu. The samples were cultivated following the manufacturer’s protocol (Dentocult SM®, Orion Diagnostica: Espoo, Finland). The participants were divided into two groups according to their mutans streptococci levels at baseline: ≥105 mutans streptococci CFU in one ml saliva was considered high level (ms+), and <105 low level (ms-)2.

Statistical analyses

Frequencies and distributions according to gender, intervention group and ms level at baseline and after the intervention were calculated using cross-tabulation. Statistical significance was studied by chi-squared test. Mean DMF values according to age and original mutans streptococci levels (ms+/ms-) were calculated for the years 2005–2008 when the participants were 13–20 years old. The number/proportion of participants with healthy dentitions (dmf + DMF = 0) were determined in 1997 and 2007. For studying the change in mutans streptococci levels after sucrose/xylitol intervention cross-tabulation and a 2-sample test for equality of proportions were used.

The time from the birth of the child to the onset of dental caries lesion needing a restoration was recorded during the follow-up period separately for each permanent tooth. Non-parametric Kaplan-Meyer survival curves were drawn for each tooth to examine the survival of all permanent teeth caries free during the follow-up period. In the analysis, right censoring was used if there was no caries leading to restoration placed during the follow-up period. Wilcoxon test was used to investigate the statistical significance of difference of survival in sucrose and xylitol groups and also dividing the participants into sub groups according to their ms levels. To avoid pseudo replication, each tooth on one side of both jaws (maxilla and mandible) was chosen for the statistical analyses; for the pictures, however, data from both contralateral teeth were combined.

The association of caries status at baseline with the caries status 13 years after the intervention  was analysed using a linear regression model; dmf+DMF at baseline as independent variable and DMF 13 years after intervention representing the outcome measure. An equation of the association was achieved.

The data were analyzed using SPSS (version 20.0, SPSS, Inc., Chicago, Il, USA), and R (version 2.11.1 Patched): a language and environment for statistical computing (R Foundation for Statistical Computing, Vienna, Austria, URL http://www.R-project.org), and SAS (version 9.2, SAS Institute Inc., Cary, NC, USA) software. Statistically significant difference between the groups was determined with p-values < 0.05.

Ethics

Ethical Committee of the City of Oulu had approved the original AOM trial and approval for this study was not necessary. Approval for collecting data from the dental records was received from the Chief of the Municipal Health Services of the City of Oulu. All participants were included in the study if their parents gave approval for it. Data in analyses did not include any personal identifications.

RESULTS

In 2008–2009, more than 10 years after the original sucrose/xylitol intervention trial, patient records of 239 participants were available for analyses, drop-out rate from the original AOM study8 being 22% and from the short-term dental health study in 1997 [11] 16%, respectively (Figure 1). On average 5.2 dental examinations per individual were performed during the entire follow-up period; 5.0 dental examinations in the sucrose group and 5.4 in the xylitol group (n.s.). Combinig both groups, the mean interval between dental examinations was 442 days before 1997 and 722 days during the period 2003–2008.

Mean DMF values between 2005 and 2008 varied between 0.25–9.25, with higher variation in ms+ than ms- group (Table 2). 1n 1997 the proportion of those with dmf/DMF=0 in the sm+ group was lower than in the sm- group (51% vs. 77%). Ten years later the proportions were lower but the difference remained (17% vs. 35%) n.s. (Table 3).

Table 2. Mean DMF during the years 2005–2008 according to the age and mutans streptococci (ms) levels.

Mean DMF

ms –

            ms +

Year

Age

n

DMF

n

DMF

2005

13

9

2.89

4

0.25

16

10

1.80

5

3.00

17

11

4.09

4

9.25

2006

14

8

2.88

1

1.00

17

11

3.91

1

1.00

18

11

3.55

5

7.80

2007

15

5

2.40

3

1.00

18

4

2.25

4

3.00

19

1

2.00

4

5.75

2008

16

8

5.75

2

1.00

19

2

4.00

0

20

2

1.50

0

Total

92

33

Table 3. Number of healthy dentitions (dmf / DMF = 0) after two months’ sucrose/xylitol intervention (1997) and ten years later (2007) according to age and mutans streptococci (ms) levels.

dmf / DMF = 0

Year 1997

Year 2007

sm –

sm +

sm –

sm +

Age

n

%

N

%

Age

n

%

n

%

4

6

67

1

100

14

1

0

0

5

21

86

7

43

15

5

20

3

67

6

26

85

8

38

16

11

36

2

0

7

37

78

15

53

17

4

25

4

0

8

19

79

8

38

18

4

25

4

0

9

21

62

9

0

19

1

0

4

0

10

0

1

9

Mutans streptococci levels were recorded at baseline and after the trial for 122 children in sucrose group and 123 children in xylitol group. Levels remained either unchanged or changed only slightly among majority of the children during the trial despite the intervention group. In the xylitol group, ms levels decreased more and increased less than in the sucrose group, but the differences between the groups were not statistically significant (Table 4).

Table 4. Distribution of individuals in sucrose (A) and xylitol (B) groups according to salivary mutans streptococci (ms) levels at baseline and after two months’ sucrose/xylitol intervention. A group missing values for 10 individuals and B group missing values for 19 individuals.

A

After the trial

Sucrose group

ms 0

ms 1

ms 2

ms 3

Total n (%)

At baseline

ms 0

82.7 %

7.7 %

7.7 %

1.9 %

52 (42.6)

ms 1

63.9 %

19.4 %

0 %

16.7 %

36 (29.5)

ms 2

38.9 %

33.3 %

11.1 %

16.7 %

18 (14.8)

ms 3

25.0 %

12.5 %

6.3 %

56.3 %

16 (13.1)

Total n (%)

77 (63.1)

19 (15.6)

7 (5.7)

19 (15.6)

122 (100.0)

B

After the trial

Xylitol group

ms 0

ms 1

ms 2

ms 3

Total n (%)

At baseline

ms 0

85.7 %

8.9 %

3.6 %

1.8 %

56 (45.5)

ms 1

80.0 %

14.3 %

5.7 %

0 %

35 (28.5)

ms 2

87.5 %

0 %

12.5 %

0 %

16 (13.0)

ms 3

37.5 %

6.3 %

0 %

56.3 %

16 (13.0)

Total n (%)

96 (78.1)

11 (8.9)

6 (4.9)

10 (8.1)

123 (100.0)

No significant difference between the intervention group was found in survival of any permanent tooth caries free. As an example, Kaplan-Meier curves of maxillary incisors and first and second permanent molars were drawn (Figures 2 and 3). There was a tendency that the first molars became decayed sooner in the sucrose than in the xylitol group but not for them nor for any other molars the differences between the groups were statistically significant (Figure 3). During the 10-year-follow-up period, survival time of permanent teeth of individuals with high ms levels and having been in sucrose group was not significantly different from those in other subgroups. However, participants with high ms levels at baseline tended to have more caries lesions in the first molars than those with low ms levels. This was seen more undoubtedly in the first than in the second molars (Figure  4).

PowerPoint Presentation

Figure 2. Kaplan-Meier survival functions of permanent maxillary incisors. In the upper figure according to sucrose/xylitol group and in the lower figure according to sucrose/xylitol group and mutans streptococci levels (ms+/ms-).

PowerPoint Presentation

Figure 3. Kaplan-Meier survival functions of maxillary (upper) and mandibular (lower) first and second permanent molars according to xylitol and sucrose groups.

PowerPoint Presentation

Figure 4. Kaplan-Meier survival functions of first and second permanent molars in maxilla (upper) and mandible (lower) according to sucrose/xylitol groups and salivary mutans streptococci levels (ms+/ms-).

Median age for the placement of the first restoration in the first permanent molars was lower for individuals with ms+ in the xylitol group than in other subgroups; the difference between the groups was statistically significant for the first left lower molar, d. 36 (p =0.017), but not for any other teeth (Figures 3 and 4). To describe the influence of caries status in childhood to that in the teenage a regression equation DMFT = 2.55 + 0.65 * (dmf + DMF) was achieved with 95% CI regression coefficient for (dmf + DMFT) being (0.42, 0.88).

DISCUSSION

Findings of the present study are in concordance with our hypothesis that a short sucrose/xylitol exposure at preschool age does not indicate decaying of permanent dentition during a10 year-follow-up period regardless of the ms level at baseline. However, high ms level in preschool age does have some impact, it is somewhat associated with future decay in the first molars. The exposure was – luckily – too short for long-term effects of sucrose on permanent teeth even if there was a tendency that the first molars became decayed sooner in the sucrose than xylitol group. Same exposure for primary teeth was long enough to induce dental caries for children in the sucrose group when mutans streptococci levels were high [11].

Sucrose has been shown to be associated with dental caries prevalence since Vipeholm studies in 1954[12]. Regularly used polyol-based chewing gum, on the other hand, has been shown to prevent decaying among children and adolescents. In a 40-month double-blinded cohort study in Belize, South America, xylitol chewing gum was the most effective factor in reducing caries incidence compared with no-gum, sucrose gum, xylitol-sorbitol gum and sorbitol gum. In the Belize study sucrose gum use somewhat increased caries incidence. In the same study it was discussed, if simultaneous increased salivary secretion due to activation of masticatory system caused the positive outcome by xylitol [13].  In the previous short-term study [11], two months’ sucrose exposure was sufficient to cause decaying among those with high ms levels, but positive effect of xylitol in preventing caries was not seen. However, during the exposure there was a tendency that mutans streptococci levels of the participants changed towards better more often in the xylitol than in the sucrose group. In a recent study 5 weeks’ exposure to xylitol reduced ms counts, but had no affect on oral microbiome [14]. After 6 months regular xylitol use (11.6 g a day) salivary ms consertration has been shown to be lower in a xylitol group than in a control (non-sucrose) group among school-children [15]. If the sucrose exposure had continued longer in the present study, the effect could have been detectable even in permanent teeth due to changes in the microbiota towards acidogenic and aciduric. Most likely the participants did not keep up sufficient xylitol consumption after the intervention. Indeed, during the follow-up time 17% of Finnish boys in secondary school reported never using xylitol chewing gum [16].

Participants were randomly divided into the sucrose and xylitol groups. Children with poor oral hygiene and high ms consentration could fall into either group. Unfortunately, there is no information about oral health-related habits and preventive dental care during the follow-up period. However, the original AOM research was justified by the fact that at that time all children were quaranteed regular check-ups [10].

During the 13 year follow-up period after the intervention, children with high ms levels at baseline had lower dental attendance rates than their ms negative counterparts. Irregular dental care of any risk patient may increase caries risk. One or more missed dental appointments has been shown to cause a significant risk dental caries [17]. It can be speculated that a peak in caries prevalence and consequently dental treatments among those in the sucrose group with high ms levels during the intervention may have caused dental fear and avoidance of dental visits. This was seen as higher prevalence of caries lesions in the first molars.

Most likely the participants continued normal lifestyle after the exposure and for example use of sugar among sucrose group participants returned to the normal level. Long-term harmful effects of a short-term exposure to any one risk factor like sucrose cannot cause the disease. Also long-term effects of sugar exposure can be modulated by regular daily fluoride [18]. This may be true for those, who are hospitalized for some time and good oral hygiene cannot be practiced. Never the less, everything must be done to keep good standard oral health care even during hospitalization.

Kaplan Meier curves and Wilcoxon test were used to describe and analyze the survival time of permanent teeth. This method offers a demonstrative instrument to monitore teeth surviving caries free and restorations not needing replacement in cohorts as a function of time [19–21]. There were no differences between maxillary or mandibular and first or second permanent molars when considering only xylitol and sucrose groups. Our findings concerning the association of ms colonization and dental decay are in line with previous long-term study [22]. When considering also ms level, the difference between molars are seen here even 13 years after the intervention. First molars in the xylitol ms+ groups deacyed sooner than second molars. The lower first permanent molars are the first ones to erupt, which may have influenced the outcome here. It seems that the only thing affecting the difference between the teeth is the ms level.

Linear regression model showed a statistically significant, linear association with the caries status in pre-school and in teenage. Thus, this retrospective study supports earlierfindings of caries history prediciting future caries experience [23].

Even though the research group was not monitored by the research team after primary sucrose/xylitol trial, Finnish health care system allows achieving valid data from patient records. As all children until 18 years of age are entitled to free dental care, practically all those at that age group are treated in public, municipaly organized oral health care. This is a huge benefit for a practice-based follow-up study like this.

It can be concluded that the short sucrose exposure in childhood did not increase the risk for dental decay in permanent teeth. In the long run the only factor that seemed to effect survival of permanent teeth caries free were low mutans streptococci levels. However, the effect was significant only for one lower first molar.

CONFLICT OF INTEREST: The authors declare no conflict of interes

AUTHOR CONTRIBUTIONS: VA and IH conceived the ideas and designed the study; IH collected the data; JP, VA and HH analysed the data; HH and IH drafted the manuscript; VA and M-LL finalized the writing of the manuscript.

REFERENCES

  1. Li Y. (2011) Controlling sugar consumption still has a role to play in the prevention of dental caries. J Evid Based Dent Pract. 11: 24–26. [Crossref]
  2. Moynihan PJ, Kelly SA. (2014) Effect on caries of restricting sugars intake: systematic review to inform WHO guidelines. J Dent Res. 93: 8–18. [Crossref]
  3. Tanzer JM. (1995) Xylitol chewing gum and dental caries. Int Dent J. 45(1 Suppl 1): 65–76. [Crossref]
  4. Trahan L. (1995) Xylitol: a review of its action on mutans streptococci and dental plaque–its clinical significance. Int Dent J. 45(1 Suppl 1): 77–92. [Crossref]
  5. Isokangas P, Tiekso J, Alanen P et al. (1989) Long-term effect of xylitol chewing gum on dental caries. Community Dent Oral Epidemiol. 17: 200–203. [Crossref]
  6. Azarpazhooh A, Lawrence HP, Shah PS. (2016) Xylitol for preventing acute otitis media in children up to 12 years of age. Cochrane Database Syst Rev. 8: CD007095. doi: 10.1002/14651858.CD007095.pub3. [Crossref]
  7. Uhari M, Kontiokari T, Niemelä M. (1998) A novel use of xylitol sugar in preventing acute otitis media. Pediatrics. 102 :879–84. [Crossref]
  8. Uhari M, Kontiokari T, Koskela M et al. (1996) Xylitol chewing gum in prevention of acute otitis media: double blind randomised trial. BMJ. 313: 1180–1184. [Crossref]
  9. White G. (1996) Commentary: what about the ethics? Comment on: BMJ 313: 1180–1184. [Crossref]
  10. Anttonen V, Larmas M, Raitio M. (1999) Children were guaranteed regular check ups in dental study. BMJ. 319: 432.
  11. Anttonen V, Halunen I, Päkkilä J et al. (2012) A practise-based study on the effect of a short sucrose/xylitol exposure on survival of primary teeth caries free. International Journal of Paediatric Dentistry. 22: 356–362. [Crossref]
  12. Gustafsson BE, Quensel CE, Lanke LS et al. (1954) The Vipeholm dental caries study; the effect of different levels of carbohydrate intake on caries activity in 436 individuals observed for five years. Acta Odontol Scand. 11: 232–264. [Crossref]
  13. Mäkinen KK, Bennett CA, Hujoel PP et al. (1995) Xylitol chewing gums and caries rates: a 40-month cohort study. J Dent Res. 74: 1904–1913. [Crossref]
  14. Söderling E, El Salhy M, Honkala E, Fontana M, Flannagan S, Eckert G, Kokaras A, Paster B, Tolvanen M, Honkala S. Effects of short-term xylitol gum chewing on the oral microbiome. Clin Oral Investig. 2015; 19: 237–44.
  15. Campus G, Cagetti MG, Sacco G et al. (2009) Six months of daily high-dose xylitol in high risk schoolchildren: a randomized clinical trial on plaque pH and salivary mutans streptococci. Caries Res. 43: 455–461. [Crossref]
  16. Lukkari E, Myöhänen J, Anttonen V et al. (2008) Dietary and oral hygiene habits: Room for improvement among schoolchildren. Finn Dent J 15:22–27. (Finnish, English abstract)
  17. Wigen TI, Skaret E, Wang NJ. (2009) Dental avoidance behaviour in parent and child as risk indicators for caries in 5-year-old children. Int J Paediatr Dent.19: 431–437. [Crossref]
  18. Bernabe E, Vehkalahti M, Sheiham A, Lundquist A, suominen AL. (2016) The shape of the dose response relationship between sugars and caries in adults. J Dent Res. 95(2): 167–72.
  19. Laitala ML, Alanen P, Isokangas P et al. (2013) Long-term effects of maternal prevention on children’s dental decay and need for restorative treatment. Community Dent Oral Epidemiol. 41: 534–540. [Crossref]
  20. Käkilehto T, Siiskonen J, Vähänikkilä H et al. (2013) Caries experience in primary teeth of four birth cohorts – a practice-based study. Eur Arch Paediatr Dent. 14: 59–64. [Crossref]
  21. Vähänikkilä H, Käkilehto T, Pihlaja J et al. (2014) A data-based study on survival of permanent molar restorations in adolescents. Acta Odontol Scand. 72: 380–385. [Crossref]
  22. Laitala M, Alanen P, Isokangas P et al. (2012) A cohort study on the association of early mutans streptococci colonisation and dental decay. Caries Res. 46: 228–233. [Crossref]
  23. Kassawara AB, Tagliaferro EP, Cortelazzi KL et al. (2010) Epidemiological assessment of predictors of caries increment in 7–10-year-olds: a 2-year cohort study. J Appl Oral Sci. 18(2): 116–20 [Crossref]

Risk of Foot Ulcer Development in Diabetic Patients – Relation to Isokinetic Muscle Strength, Sensory Function, and Clinical Findings

Abstract

Aim: To investigate whether reduced muscle strength in the lower extremities in diabetic patients is associated to the development of Diabetic Foot Ulcer (DFU).

Methods: We conducted a retrospective cohort study on 95 diabetic patients who participated in studies on Diabetic Polyneuropathy (DPN) and motor function 12–16 years earlier. Isokinetic muscle strength at the ankle and knee, Neurological Impairment Scores (NIS), vibration perception thresholds (VPT), and demographic data were obtained from the initial studies. Patient files were systematically reviewed, and information on DFU occurrence and Macrovascular Disease (MVD) acquired.

Results: Twenty-six patients developed DFU. A temporal relationship was found for development of DFU among patients with reduced strength at both the ankle and knee (all P<0.05). Univariate analyses showed a relationship between DFU and reduced strength for ankle dorsal flexion (P<0.001), ankle plantar flexion (P<0.005), knee extension (P<0.001), and knee flexion (P<0.005). DFU was related to NIS (P<0.001) and MVD (P<0.05) in both univariate and multivariate regression analyses. After adjustment for MVD, all strength measures were related to DFU. When adjusting for NIS, a trend was only found for ankle dorsal flexion (P=0.08).

Conclusions: In DPN, muscle weakness at the ankle and knee contributes to development of foot ulcers.

Keywords

Type 1 diabetes mellitus, type 2 diabetes mellitus, polyneuropathy, muscle strength, foot ulcer, follow-up.

Introduction

Diabetic Foot Ulcers (DFU) lead to reduced quality of life in affected patients and impose considerable health care costs 1,2]. Several risk factors have been linked to the occurrence of ulceration in both type 1 and type 2 diabetic patients, including impaired glycaemic control, peripheral arterial disease, and Diabetic Polyneuropathy (DPN) [3–6]. Reduced sensation due to DPN allows minor trauma to evolve undetected, thereby contributing to the initial stages of foot ulceration [7]. In recent years also motor dysfunction as a result of DPN, has been implicated in the pathology underlying DFU. DPN leads to muscle atrophy and loss of muscle strength in the foot and in more advanced cases also in the lower legs [8–11]. In addition, patients with DPN develop foot deformities such as bony prominences and metatarsophalangeal joint deformities, which contribute to abnormalities of pressure distribution and ulcer formation [5, 12–14].  Exposure of pathologically altered bony structures due to atrophy of overlying tissue, concomitant with increased forefoot slap during gait cycle deceleration as a result of reduced muscle strength for ankle dorsal flexion, is believed to cause increased plantar pressure during gait, which is associated to foot ulceration [15–17]. Weakness of dorsal flexion at the ankle and great toe combined with reflex testing, have been identified as risk factors for development of DFU [18]. However, as muscle strength was assessed by manual testing, the degree of muscle weakness was likely underestimated which may have weakened the association to DFU development [19]. Isokinetic dynamometry provides a more accurate quantification of muscle strength in neuropathic patients which could strengthen the proposed relationship between loss of muscle strength in the lower extremities due to DPN and foot ulcer formation [20].

In the present retrospective study, we have evaluated the temporal relationship between reduced muscle strength at both the knee and ankle determined by isokinetic dynamometry and the occurrence of DFU. We included diabetic patients evaluated using isokinetic dynamometry 12–16 years previously. The patients were followed up by obtaining data collected from patient files with focus on the occurrence of DFU.

Materials and Methods

Study design

We conducted a retrospective cohort-study on 95 diabetic patients (65 type 1 and 30 type 2) who were recruited for cross-sectional studies on diabetic polyneuropathy and muscle strength at our laboratory 12–16 years prior to the present study [9,21]. Baseline data on isokinetic muscle strength at the ankle and knee, age, height, weight, Neuropathy Impairment Score (NIS), and Vibratory Perception Threshold (VPT) were acquired from the initial study protocol. Patient hospital files were then systematically reviewed for the period since participation in the initial studies until 31st of December 2009, and information on foot ulcer occurrence and Macrovascular Disease (MVD) (defined as claudication, acute myocardial infarction, transient ischemic attack, or stroke) were recorded. A DFU was defined as an ulcer that required specialized treatment at the Diabetic Foot Centre located at the Department of Endocrinology, Aarhus University Hospital.

The study was approved by the Danish Data Protection Agency (Journal No. 2010-41-4811).

Measurements performed in initial cross-sectional studies

In the initial studies by Andersen et al. isokinetic dynamometry (Lido Active Multijoint; Loredan Biomedical, West Sacramento, CA) was applied to measure maximal muscle strength for extension and flexion of the knee and dorsal and plantar flexion of the ankle [9,21]. Maximal strength was measured as peak torque at slow movement velocities with subjects in a sitting position. Straps were applied proximally and distally to the respective joints. For ankle measurements, the foot was secured to a footplate. Standardized verbal feedback was given during the procedures.

NIS is a score obtained by performing a standardized clinical evaluation of muscle strength, activity of tendon reflexes, and sensation at the great toe and index finger. In the present study, all points due to muscle weakness have been omitted to avoid correlation bias.

VPT was evaluated at the dominant index finger pulp and non-dominant dorsum of the great toe, as described by Dyck et al [21].

Study population

Baseline data were obtained for 115 patients. Twenty patients were excluded as eleven patient files could not be located from the outpatient clinic archives, two patients had moved out of the geographical area, and five patients were lost to follow-up as they did not attend scheduled appointments at the outpatient clinic. Finally, foot ulceration following penetrating trauma complicated by infection occurred in one patient, and one patient had received chemotherapy for non-Hodgkin lymphoma known to cause polyneuropathy as a possible side effect. Thus, 95 patients were included in the present follow-up study.

In the initial studies, inclusion criteria for type 1 diabetic patients were duration of diabetes ≥ 20 years and age < 65 years, and for type 2 diabetic patients diabetes duration ≥ 5 years and age < 70 years. In short the exclusion criteria applied, secured that no participant had reduced levels of activity due to cardiac or lung disease, musculoskeletal disorders, suffered any neurological disorder or other endocrine disorder than diabetes mellitus, or was subject to symptomatic macroangiopathy. The criteria are stated in detail in the initial studies by Andersen et al [9,21].

Statistical analysis

Absolute values for muscle strength were converted to percentage of expected strength based on calculations adjusting for age, body mass, height, and gender as described earlier [21].

The two-sample t-test and Pearson’s Chi2 test were applied to compare demographic data in the group of patients that developed DFU with the group without DFU.

Logistic regression analysis was applied to evaluate the relationship between ulcer occurrence and degree of muscle weakness. Multiple logistic regression analysis was applied when adjusting for MVD and NIS, and to evaluate the influence of the strength measurements combined. As a minimum of ten outcome events are needed per predictor variable when performing multivariate analysis, only two variables were included in each multivariate analysis model [23].

For each strength measurement, patients were divided in groups according to percent of expected muscle strength; group 1: 0–74%, group 2: 75–99% and group 3: ≥100%. The groups were then compared using the log-rank test in order to evaluate the temporal relationship between muscle strength and DFU.

Results

The follow-up period was 13.9 (0.2–15.9) [median (range)] years, during which 26 patients developed DFU. No difference was found for diabetes type (65% type 1 vs. 70% type 1), age [54 [(26–69) years vs. 47 (26–69) years], duration of diabetes [26 (8–48) years vs. 23 (1–41) years], BMI [25 (19–37) vs. 25 (17–40)], or gender composition (19% female vs. 36% female) between patients who developed DFU and those without DFU, respectively (all P > 0.05). More patients with DFU were diagnosed with MVD during follow-up, as compared to patients that did not develop DFU (54% vs. 19%, P < 0.005).

Muscle strength, expressed as percent of expected strength, was lower at baseline for patients that developed DFU during follow-up than for patients that did not develop DFU for both ankle dorsal [68 (25–104)% vs. 92 (49–126)%, P < 0.0001] and plantar [73 (40–100)% vs. 85 (42–145)%, P < 0.01] flexion, as well as knee flexion [76 (50–103)% vs. 90 (56–129)%, P < 0.01] and extension [74 (55–106)% vs. 89 (59–133)%, P < 0.0001]. Further, NIS [24 (3–38) vs. 6 (0–31), P <0.0001] and VPT [99 (11–99) vs. 95 (32–99), P <0.01] scores were higher for patients who developed DFU.

Univariate analysis established a correlation between reduced muscle strength for both dorsal and plantar flexion at the ankle and flexion and extension at the knee, and the occurrence of DFU (Table 1). The odds ratios express the risk of developing DFU if muscle strength is reduced by one percent. Also, a high NIS and the occurrence of MVD were associated to foot ulceration. VPT, however, showed no relationship to DFU development.

Results of the multivariate regression analyses are shown in table 2. Reduced muscle strength for ankle dorsal flexion, ankle plantar flexion, knee extension, and knee flexion were all related to DFU occurrence when adjusting for MVD as shown in model 1, a-d. In model 2, muscle strength for flexion and extension at the ankle and knee were combined with NIS. All analyses found NIS to be an independent risk factor for DFU development, whereas a tendency was found for dorsal flexion, only. For movements at the ankle and knee, only ankle dorsal flexion and knee extension were related to DFU development (model 3, a+b). When combining ankle dorsal flexion and knee extension, only ankle dorsal flexion showed a relationship to DFU formation (model 3, c). NIS and the occurrence of MVD are included in model 4, and both were independently correlated to foot ulceration.

Figure 1, a-d, illustrates the association between lower extremity muscle strength and DFU development for patients grouped according to percentage of expected muscle strength at inclusion. For all movements measured, patients with expected strength of less than 75 % had higher probabilities of developing DFU during follow-up. Patient groups did not differ with regard to distribution of diabetes type.

EDMJ 2019-114 - Christer Zøylner Swan Denmark_F1

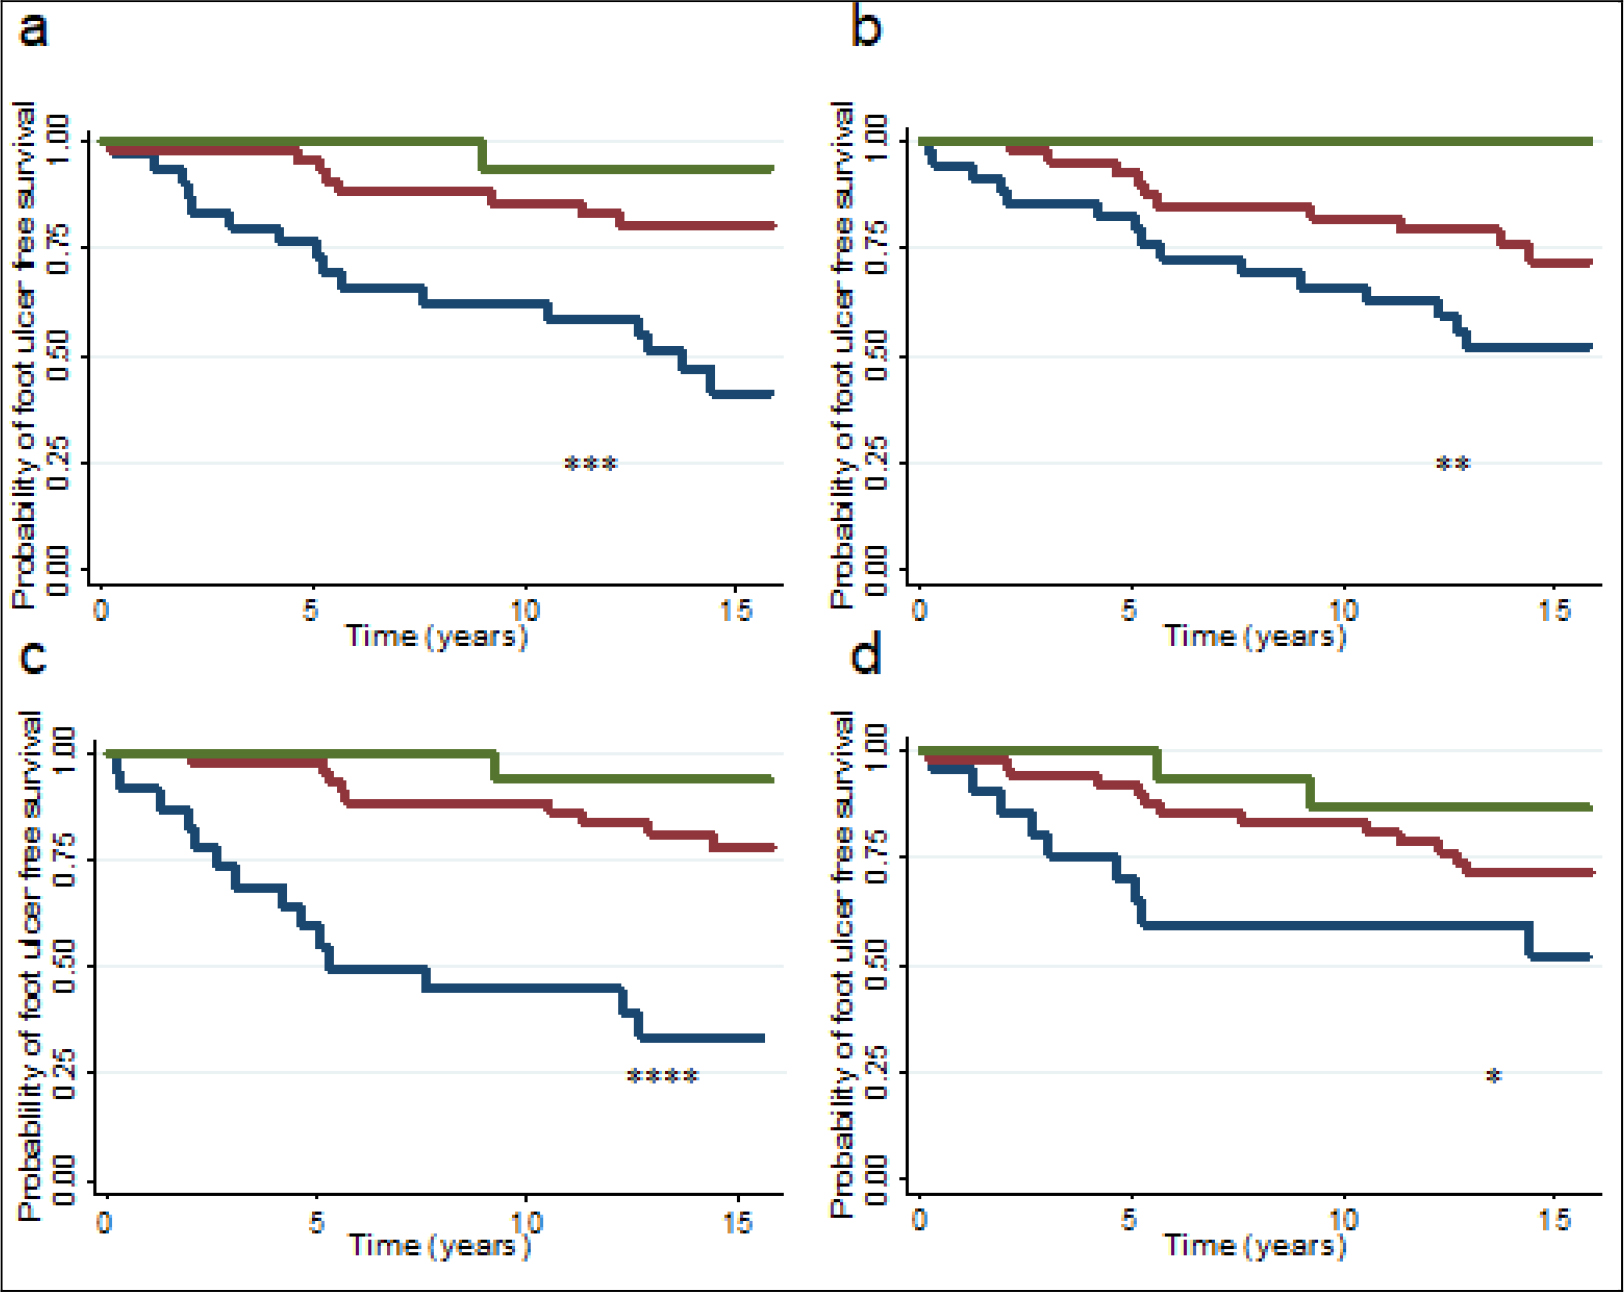
Figure 1. Kaplan Meier plot illustrating the probability of not developing foot ulcer in diabetic patients (65 type 1 and 30 type 2) according to percentage of expected strength for dorsal (a) and plantar (b) flexion at the ankle, and extension (c) and flexion (d) at the knee. Green line; patients with >/= 100% of expected strength for movement, red line; patients with 75–99 % of expected strength for movement, and blue line; patients with ≤ 74 % of expected strength for movement. *P < 0.05, **P < 0.005, ***P < 0.0005, and ****P < 0.0001.

Discussion

In this retrospective cohort study, we investigated the relationship between muscle strength in the lower extremities and the risk of developing DFU in 95 diabetic patients. We found that reduced muscle strength in the lower extremities is a risk factor for ulceration of the foot in diabetes. Reduced strength for ankle dorsiflexion and knee extension proved to be the strongest risk factors for the development of DFU. The odds ratios calculated for the models shown in tables 1 and 2, express the risk of developing a foot ulcer during a 14-year period if muscle strength is reduced by 1 %. When applied on the results presented in Table 1, the finding is exemplified by the 10 fold increased risk of developing a foot ulcer found for a patient with an expected muscle strength for ankle dorsal flexion of 60 % compared to that of a patient with normal muscle strength for this movement (60% vs 100% ; 1.0640 = 10.3).

Table 1. Odds ratios (OR) for univariate analysis expressing the risk of developing diabetic foot ulcers (DFU) in diabetic patients (65 type 1 and 30 type 2) in relation to muscle strength for movements at the ankle and knee, Neuropathy Impairment Score (NIS), and Vibratory Perception Threshold (VPT) at baseline, and macrovascular disease (MVD) developed during 13.9 (0.2–15.9) [median (range)] years follow-up. ORs for ankle and knee movements express the increased risk of developing DFU following a 1% reduction in muscle strength. All data are shown as OR and 95% confidence intervals (95% CI). NS = non-significant.

OR (95% CI)

P

Baseline

Ankle dorsal flexion

1.06 (1.02–1.09)

< 0.001

Ankle plantar flexion

1.04 (1.01–1.07)

< 0.005

Knee extension

1.09 (1.04–1.14)

< 0.001

Knee flexion

1.05 (1.02–1.09)

< 0.005

NIS

1.15 (1.09–1.22)

< 0.001

VPT

1.03 (0.98–1.08)

NS

Consecutively recorded data

MVD

5.03 (1.89–13.4)

< 0.005

Table 2. Multivariate analyses in which two predictor variables are applied in each analysis in relation to diabetic foot ulcer occurrence during 13.9 (0.2–15.9) [median (range)] years follow-up. In model 1, muscle strength for flexion and extension at the ankle and knee and macro vascular disease (MVD) are included. In model 2, muscle strength for flexion and extension at the ankle and knee and Neuropathy Impairment Score (NIS) are included. In model 3, muscle strength measurements at the ankle and knee are combined. In model 4, NIS and MVD are combined. All data are shown as odds ratios (OR) and 95% confidence intervals (CI 95%).

OR (95% CI)

P

Model 1

a) Ankle dorsal flexion
MVD

1.06 (1.02–1.09)
4.15(1.40–12.27)

< 0.005
< 0.05

b) Ankle plantar flexion
MVD

1.04 (1.01–1.07)
4.96 (1.74–14.18)

< 0.05
< 0.05

c) Knee extension
MVD

1.09 (1.03–1.15)
5.21 (1.61–16.91)

< 0.001
< 0.05

d) Knee flexion
MVD

1.06 (1.02–1.10)
8.03 (2.43–26.55)

< 0.005
< 0.005

Model 2

a) Ankle dorsal flexion
NIS

1.03 (0.99–1.07)
1.12 (1.05–1.19)

0.08
< 0.001

b) Ankle plantar flexion
NIS

1.02 (0.98–1.05)
1.13 (1.07–1.21)

0.4
< 0.001

c) Knee extension
NIS

1.04 (0.98–1.09)
1.12 (1.05–1.20)

0.18
< 0.005

d) Knee flexion
NIS

1.03 (0.99–1.07)
1.14 (1.07–1.21)

0.17
< 0.001

Model 3

a) Ankle dorsal flexion
Ankle plantar flexion

1.05 (1.02–1.08)
1.02 (0.99–1.06)

< 0.005
0.13

b) Knee extension
Knee flexion

1.08 (1.02–1.15)
1.02 (0.96–1.05)

< 0.05
0.77

c) Ankle dorsal flexion
Knee extension

1.06 (1.02–1.1)
1.05 (1.0–1.11

< 0.01
0.06

Model 4

NIS
MVD

1.14 (1.08–1.21)
3.47 (1.07–11.30)

< 0.001
< 0.05

Further, we have illustrated the effect of muscle weakness on DFU development over time, strengthening the hypothesis of an association between alterations in gait due to loss of muscle strength and foot ulcer formation, possibly as a result of increased plantar pressure.

An association to DFU development was also found for MVD and NIS in both uni- and multivariate analysis, lending support to the multifactorial pathology presumed to underlie the development of foot ulcers in diabetes.

Several studies have described gait alterations in diabetic patients with DPN. Late firing of the anterior tibial muscle has been found to result in forefoot slap and, resultantly, increased plantar pressure, which contributes to development of DFU [15, 24]. In our study, reduced muscle strength for dorsal flexion at the ankle showed a close correlation to foot ulceration, thus our results support these findings as the anterior tibial muscle contributes to ankle dorsiflexion. A correlation between DFU and muscle strength for ankle dorsal flexion, toe extension, and finger abduction has been reported, however, muscle strength was evaluated manually [18]. As our muscle strength measurements were acquired using a standardized quantitative technique with a low coefficient of variation, and included ankle extension and muscle strength at the knee in addition to ankle dorsal flexion, the results bring substantial support to the association between muscle weakness in DPN and DFU occurrence. Patients with DPN experience atrophy of foot muscles, and a relationship between prior DFU and weakness of intrinsic as well as extrinsic foot muscles calculated by a semi quantitative scoring system has been reported [25]. As DPN is distributed in a length-dependent manner, an evaluation of the relationship between foot muscle weakness and DFU would have added valuable information, however these data were not obtained in the initial studies as dynamometric strength measurements of small foot muscles are not easily performed. Due to the retrospective nature of our study, important risk factors for foot ulceration associated to increased plantar pressure such as foot deformities and callus formation could not be adequately acquired.

The severity of DPN is a well-known risk factor for diabetic foot ulceration, a finding also supported in our study. When adjusting for the severity of DPN, expressed as NIS, in the multivariate analysis, strength of the ankle dorsal flexors no longer showed an association to foot ulceration. However, a trend towards a relationship between the variable and DFU development remained. This observation is not surprising since reduced muscle strength is caused by motor neuropathy, which occurs concomitantly with sensory neuropathy in DPN [26].

MVD was strongly associated to foot ulceration, a finding supported by other groups [3,5,27]. However, the influence of the association found in our study is most probably overestimated, as data on MVD were recorded consecutively throughout the follow-up period, and are therefore, unlike all strength measurements, NIS, and VPT, not baseline data.

VPT showed no relationship to DFU development when applying univariate analysis, although sensory neuropathy is a well-known risk factor for the development of DFU and increased thresholds for vibration occur in early stages of DPN [18]. In our analyses many patients presented with VPT exceeding the arbitrary unit 25 JND (Just Noticeable Difference), thus the lack of correlation may be due to a ceiling effect.

Increased physical activity has been suggested to play a role in DFU development due to repetitive mechanical stress of the plantar region of the foot. However, no increase in foot ulcer occurrence was observed among neuropathic diabetic patients enrolled in a twelve-month muscle-strengthening program, and further, another study suggested an overall lower activity in diabetic patients who developed DFU compared to those without this complication [28,29]. Thus, there are no convincing data to suggest that physical activity increases the risk of foot ulcer formation. It has been reported that specific training of the lower extremities in diabetic patients diagnosed with sensory neuropathy improve gait speed, balance, muscle strength and joint mobility [30]. As reduced muscle strength seems to be implicated in foot ulceration in diabetes, strengthening of lower extremity muscles may contribute to preservation of normal gait, and thereby reduce the risk of developing foot ulcers. Also, a randomized controlled trial evaluating the effect of leg muscle strengthening and gait exercises in neuropathic diabetic patients, reported a more expedient distribution of plantar pressure and gait execution [31]. However, as intention-to-treat analyses showed improvement and the intervention only administered for twelve weeks, exercises directed at enhancing lower extremity function may still play a role in DFU prevention. Based on the aforementioned study and our findings, a study evaluating the effect of strengthening of lower extremity muscles on DFU formation is highly relevant, however both the intervention and follow-up period must be of sufficient length as the mechanisms leading to DFU exert their detrimental impact over years.

In conclusion, we found a temporal relationship between reduced muscle strength at the knee and ankle and diabetic foot ulcer development. Notably reduced muscle strength for dorsal flexion at the ankle seemed to have a close relationship to foot ulceration, lending support to previous findings evaluating gait biomechanics in DPN and the proposed relationship between increased plantar pressure and DFU development. As motor dysfunction in DPN is a contributing factor in the multifactorial pathway involved in foot ulceration, it would be relevant to include quantitative strength measurements and gait analyses in large scaled prospective studies investigating the aetiology behind this feared complication to diabetes mellitus.

Authorship: A.B.P wrote the manuscript, took part in designing the study, and collected and analysed data. L.H. contributed to study design, data collection and analyses, and reviewed the manuscript. H.A. contributed to study conception and design, analyses, and reviewed/edited the manuscript. N.E. contributed to design, data collection, discussion, and reviewed the manuscript. C.S.A. contributed to study conception and design, researched data, conducted statistical analyses, and reviewed and edited the manuscript. All authors approved the final version of the manuscript. A.B.P. is guarantor of this work.

Acknowledgment

Results of the study were presented in a shortened form at the 21st Annual Meeting of the Diabetic Neuropathy Study Group of the EASD, held in Porto, Portugal, 8–11 September 2011.

References

  1. American Diabetes Association (2008) Economic costs of diabetes in the U.S. In 2007. Diabetes Care 31: 596–615. [crossref]
  2. Vileikyte L (2001) Diabetic foot ulcers: a quality of life issue. Diabetes/metabolism research and reviews 17: 246–249.
  3. Abbott CA, Carrington AL, Ashe H, Bath S, Every LC, et al. (2002) The North-West Diabetes Foot Care Study: incidence of, and risk factors for, new diabetic foot ulceration in a community-based patient cohort. Diabetic medicine : a journal of the British Diabetic Association 19: 377–84.
  4. Adler AI, Boyko EJ, Ahroni JH, Stensel V, Forsberg RC, et al. (1997) Risk factors for diabetic peripheral sensory neuropathy. Results of the Seattle Prospective Diabetic Foot Study. Diabetes care 20: 1162–1167.
  5. Boyko EJ, Ahroni JH, Stensel V, Forsberg RC, Davignon DR, et al. (1999) A prospective study of risk factors for diabetic foot ulcer. The Seattle Diabetic Foot Study. Diabetes Care 22: 1036–1042. [crossref]
  6. McNeely MJ, Boyko EJ, Ahroni JH, Stensel VL, Reiber GE, et al. (1995) The independent contributions of diabetic neuropathy and vasculopathy in foot ulceration. How great are the risks? Diabetes Care 18: 216–219. [crossref]
  7. Shun CT, Chang YC, Wu HP, Hsieh SC, Lin WM, et al. (2004) Skin denervation in type 2 diabetes: correlations with diabetic duration and functional impairments. Brain 127: 1593–1605.
  8. Andersen H, Gjerstad MD, Jakobsen J (2004) Atrophy of foot muscles: a measure of diabetic neuropathy. Diabetes Care 27: 2382–2385. [crossref]
  9. Andersen H, Nielsen S, Mogensen CE, Jakobsen J (2004) Muscle strength in type 2 diabetes. Diabetes 53: 1543–1548. [crossref]
  10. Andreassen CS, Jakobsen J, Andersen H (2006) Muscle weakness: a progressive late complication in diabetic distal symmetric polyneuropathy. Diabetes 55: 806–812. [crossref]
  11. Andreassen CS, Jakobsen J, Ringgaard S, Ejskjaer N, Andersen H (2009) Accelerated atrophy of lower leg and foot muscles–a follow-up study of long-term diabetic polyneuropathy using magnetic resonance imaging (MRI). Diabetologia 52: 1182–1191. [crossref]
  12. Cheuy VA, Hastings MK, Commean PK, Ward SR, Mueller MJ (2013) Intrinsic foot muscle deterioration is associated with metatarsophalangeal joint angle in people with diabetes and neuropathy. Clinical biomechanics (Bristol, Avon) 28: 1055–1060.
  13. Raspovic A (2013) Gait characteristics of people with diabetes-related peripheral neuropathy, with and without a history of ulceration. Gait & posture 38: 723–728.
  14. van Schie CH (2005) A review of the biomechanics of the diabetic foot. Int J Low Extrem Wounds 4: 160–170. [crossref]
  15. Abboud RJ, Rowley DI, Newton RW (2000) Lower limb muscle dysfunction may contribute to foot ulceration in diabetic patients. Clinical biomechanics (Bristol, Avon) 15: 37–45.
  16. Frykberg RG, Lavery LA, Pham H, Harvey C, Harkless L, et al. (1998) Role of neuropathy and high foot pressures in diabetic foot ulceration. Diabetes Care 21: 1714–1719. [crossref]
  17. Stess RM, Jensen SR, Mirmiran R (1997) The role of dynamic plantar pressures in diabetic foot ulcers. Diabetes Care 20: 855–858. [crossref]
  18. Abbott CA, Vileikyte L, Williamson S, Carrington AL, Boulton AJ (1998) Multicenter study of the incidence of and predictive risk factors for diabetic neuropathic foot ulceration. Diabetes care 21: 1071–1075.
  19. Andersen H, Jakobsen J (1997) A comparative study of isokinetic dynamometry and manual muscle testing of ankle dorsal and plantar flexors and knee extensors and flexors. European neurology 37: 239–242.
  20. Andersen H (1996) Reliability of isokinetic measurements of ankle dorsal and plantar flexors in normal subjects and in patients with peripheral neuropathy. Arch Phys Med Rehabil 77: 265–268. [crossref]
  21. Andersen H, Poulsen PL, Mogensen CE, Jakobsen J (1996) Isokinetic muscle strength in long-term IDDM patients in relation to diabetic complications. Diabetes 45: 440–445.
  22. Dyck PJ, O’Brien PC, Kosanke JL, Gillen DA, Karnes JL (1993) A 4, 2, and 1 stepping algorithm for quick and accurate estimation of cutaneous sensation threshold. Neurology 43: 1508–1512. [crossref]
  23. Peduzzi P, Concato J, Kemper E, Holford TR, Feinstein AR (1996) A simulation study of the number of events per variable in logistic regression analysis. J Clin Epidemiol 49: 1373–1379. [crossref]
  24. Shaw JE, van Schie CH, Carrington AL, Abbott CA, Boulton AJ (1998) An analysis of dynamic forces transmitted through the foot in diabetic neuropathy. Diabetes care 21: 1955–1959.
  25. van Schie CH, Vermigli C, Carrington AL, Boulton A (2004) Muscle weakness and foot deformities in diabetes: relationship to neuropathy and foot ulceration in caucasian diabetic men. Diabetes care 27: 1668–1673.
  26. Dyck PJ, Albers JW, Andersen H, Arezzo JC, Biessels GJ, et al. (2011) Diabetic polyneuropathies: update on research definition, diagnostic criteria and estimation of severity. Diabetes/metabolism research and reviews. 27: 620–628.
  27. Monteiro-Soares M, Dinis-Ribeiro M (2010) External validation and optimisation of a model for predicting foot ulcers in patients with diabetes. Diabetologia 53: 1525–1533. [crossref]
  28. Lemaster JW, Mueller MJ, Reiber GE, Mehr DR, Madsen RW, et al. (2008) Effect of weight-bearing activity on foot ulcer incidence in people with diabetic peripheral neuropathy: feet first randomized controlled trial. Physical Therapy 88: 1385–1398.
  29. Armstrong DG, Lavery LA, Holtz-Neiderer K, Mohler MJ, Wendel CS, et al. (2004) Variability in activity may precede diabetic foot ulceration. Diabetes Care 27: 1980–1984. [crossref]
  30. Allet L, Armand S, de Bie RA, Golay A, Monnin D, et al. (2010) The gait and balance of patients with diabetes can be improved: a randomised controlled trial. Diabetologia 53: 458–466. [crossref]
  31. Sartor CD, Hasue RH, Cacciari LP, Butugan MK, Watari R, et al. (2014) Effects of strengthening, stretching and functional training on foot function in patients with diabetic neuropathy: results of a randomized controlled trial. BMC musculoskeletal disorders 15: 137-2474-15-137.